Where is everybody? · Working papers
Small bodies with unexplained accelerations
Revised after a second, separate analysis run for this project tried to break it. Neither analysis is an outside expert.
A census of unexplained non-gravitational accelerations among inactive small bodies: limits on high area-to-mass (sail-like) objects
Revised after referee review, 2026-10-12. Entry point:
code/run_all.py (full run 25 min with cached
downloads).
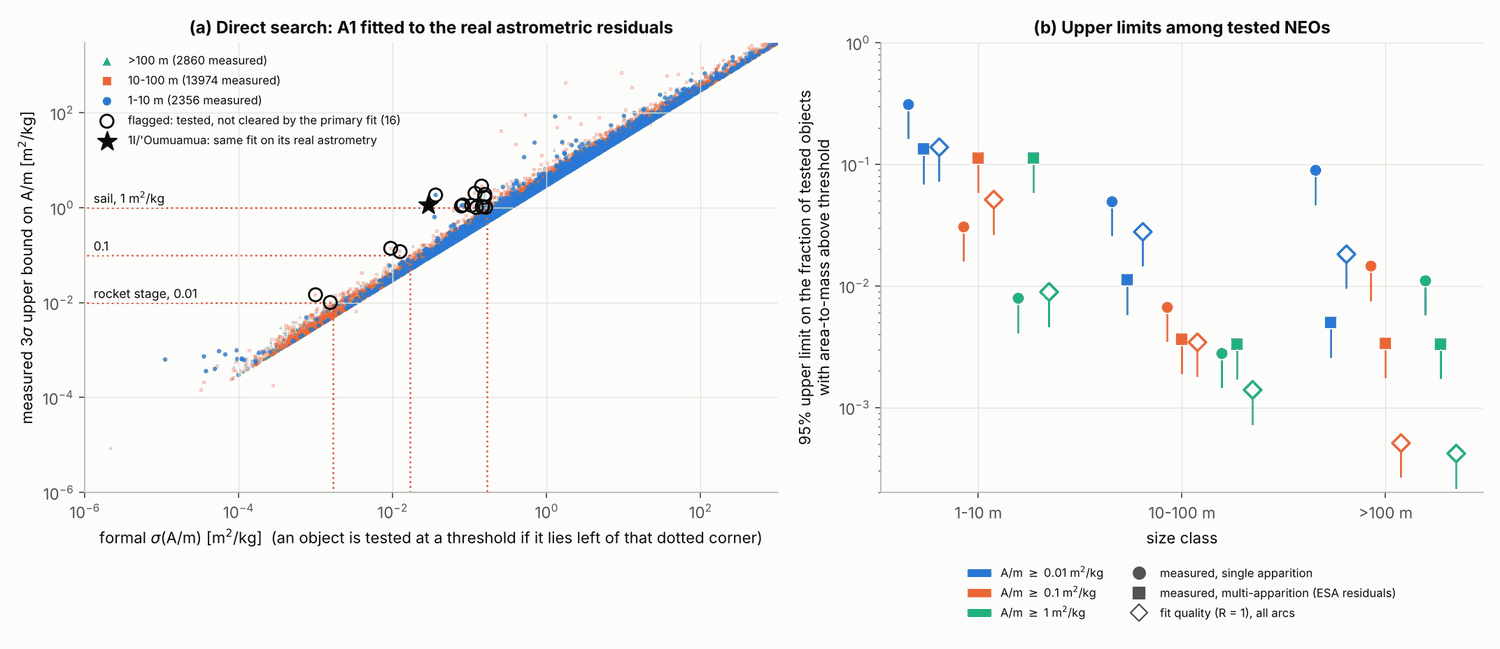
Result in one paragraph. The first-pass limits did not survive review as stated. They are replaced by weaker ones from a search that was actually carried out. I fitted a radial non-gravitational term to the real astrometric residuals of 19,192 near-Earth objects (NEOs) and found no sail-like object. Among objects whose data could have shown one (formal σ(A/m) ≤ X/6, a sample fixed without looking at the result), the one-sided 95% upper limits on the fraction with area-to-mass ratio A/m ≥ 1 m²/kg are 0.79% for 1–10 m objects (596 tested, 22% of the bin; one marginal 4.1σ value on a 4-day arc counted as a detection), 0.28% for 10–100 m (2,767 single-apparition objects standing for 35% of the bin; three non-significant unresolved cases counted as detections) and, above 100 m, 1.1% on single-apparition arcs (564 tested, 14% of the bin) or 0.33% on multi-apparition arcs (0 of 898, standing for 67% of the bin, conditional on gravity-only linking). Analysis variants move these by up to a factor of about 2 (0.36–1.6%, 0.16–0.66%, 0.64–1.2%). For rocket-stage-like values (A/m ≥ 0.01) the limits are 31%, 5.0% and 8.9% on single-apparition arcs and 13%, 1.1% and 0.50% on multi-apparition arcs, and 98.9%, 95.7% and 54.6% of the three size bins are not tested at that level. Main caveats: these are fractions of tested, catalogued objects, not of the population; the catalogue is censored on the tested variable (gravity-only linking, and removal of high-A/m objects on Earth-like orbits as presumed human debris); the fits are linearised; and astrometric systematics give values of 5σ or more with both signs in 0.1–0.3% of objects. One object, 2007 AA2, has an unexplained term (A/m = 0.0087 ± 0.0010 m²/kg; 8.8σ formal, 4.3σ with one point per station-night). It is a follow-up candidate, not a detection, and it lies 100 times below sail values.
1. Question
Do any inactive small bodies show non-gravitational accelerations that natural processes do not explain, and what fraction of catalogued NEOs can be excluded from having a sail-like (A/m ≥ 1 m²/kg, as for 1I/'Oumuamua) or hardware-like (A/m ≥ 0.01 m²/kg, as for a spent rocket stage) area-to-mass ratio? A radial acceleration A1/r² corresponds to A1 = 2.2654e-7 au/d² per m²/kg (radiation pressure coefficient C_R = 1).
2. Data
All snapshots are dated 2026-10-12. Raw files are in
raw/ and are re-downloaded by
code/s01_download.py and
code/s06_neocc.py.
- JPL Small-Body Database (SBDB) query API: 42,718 NEO asteroids; 980 objects with non-gravitational parameters, 615 of them asteroid-designated (A1 22, A2 611, A3 11).
- MPC astrometry: bulk file of unnumbered objects (2,195,701 optical observations of 37,573 unnumbered NEOs) and the MPC observations API (2,329 objects); observatory codes; JPL radar astrometry.
- JPL Horizons: planetary positions, reference trajectories, 'Oumuamua, artificial objects.
- ESA NEO Coordination Centre (NEOCC): catalogue
neo_km.cat(42,725 NEOs, 389 with non-gravitational parameters, 7 with a fitted A/m between −2.4e-4 and 8.2e-4 m²/kg), per-object orbits and 2,206 post-fit residual files (.rwo). - Literature values: Micheli et al. 2018; Seligman et al. 2024 Table 2; Taylor et al. 2024 Table 1; Loeb & Cloete 2025; Hibberd et al. 2026.
The analysed sample is 25,519 NEOs (a stratified random sample with weights standing for all 42,718): 18,312 with a numerical model, 6,981 with a two-body model, 226 without usable astrometry. It contains 2,289,131 observations, of which 143,304 (in 1,966 objects) are space-based and are placed at the spacecraft using the satellite position records.
3. Method
Census. Each term of 3σ or more is compared with natural bounds: the maximum Yarkovsky acceleration for A2 (nominal: 2000 kg/m³, albedo 0.14; generous: 1000 kg/m³, albedo 0.45) and radiation pressure on a low-density rock for A1. Other cases are checked against the literature.
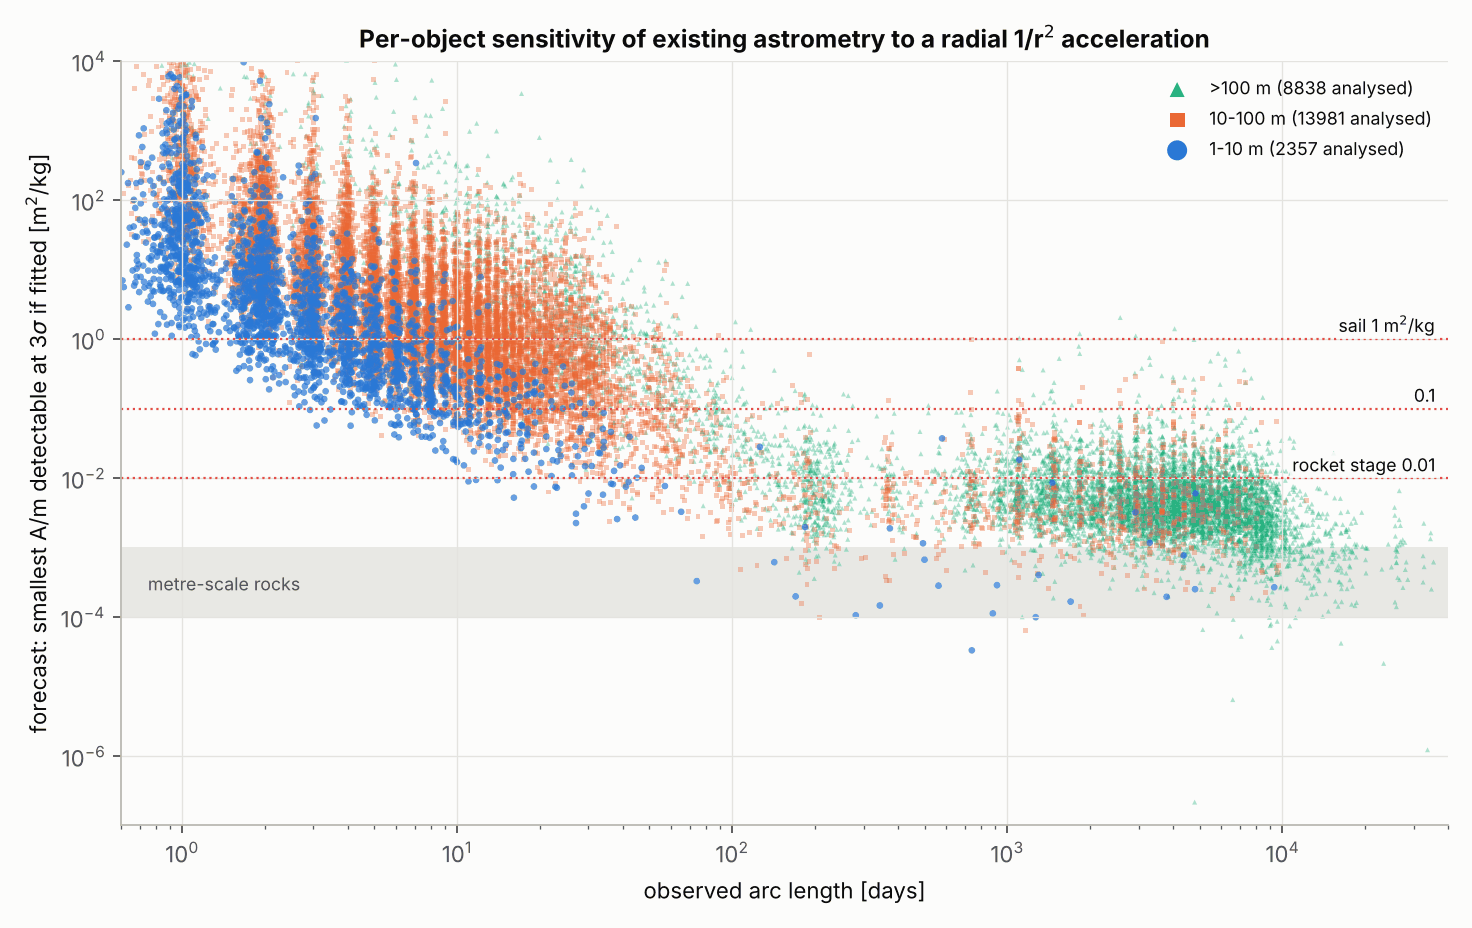
Forecast. For each analysed NEO the uncertainty a fit of A1 would have, σ(A1), is computed from the real observation epochs, stations and weights by linearising the catalogue trajectory. Arcs up to 180 d, all objects under 100 m and all objects with a fitted A1 use numerical integration with variational equations (Sun, Earth, Moon, planets, Earth J2 near flybys, solar relativity). Multi-year arcs of larger objects use two-body partial derivatives. The forecast gives completeness only; it is not a limit.
Direct search. A1 is estimated by a linearised weighted least-squares fit of six state corrections plus A1 to real residuals, with 3σ outlier rejection and rms scaling.
- Single-apparition arcs (≤ 180 d): my own residuals about JPL's trajectory (17,353 objects). Estimates of 4σ or more are re-estimated with a full non-linear Gauss–Newton fit.
- Multi-apparition arcs (> 180 d): ESA NEOCC post-fit residuals combined with my own partials (1,818 objects). My own residuals are not accurate enough over years (4.8% of objects beyond 5σ). For objects with numerical partials (mostly under 100 m) the transverse term A2 is solved together with A1, because Yarkovsky drift otherwise leaks into A1. For two-body partials (over 100 m, a random sample of 900) A1 is fitted alone.
Tested samples and limits. An object is tested at threshold X if its formal σ(A/m) ≤ X/6. This does not depend on the outcome. Its upper bound is max(estimate, 0)/0.75 + 3σ; the factor 0.75 covers linearisation bias. It is cleared if the bound is below X, and flagged otherwise. A flagged object is resolved only if its estimate is below 4σ and either the fit without outlier rejection or the fit with one station-night removed gives a bound below X. Unresolved objects are counted as detections. Limits are one-sided 95% Clopper–Pearson limits on raw tested counts. Weighted counts are given as the share of the size bin that the tested sample stands for.
Indirect fit-quality criterion (recast). A second line of evidence uses JPL's gravity-only fits. The sample is every object whose forecast signal at X satisfies s ≥ 2R√(2n), with R fixed at 0.7 or 1.0. A sail in that sample would force a normalised rms of at least 2R or heavy rejection of data. Failures (rms ≥ 2R, or JPL used less than 80% of the MPC astrometry) are listed and vetted by direct measurement.
4. Results
4.1 Census (Fig. 1)
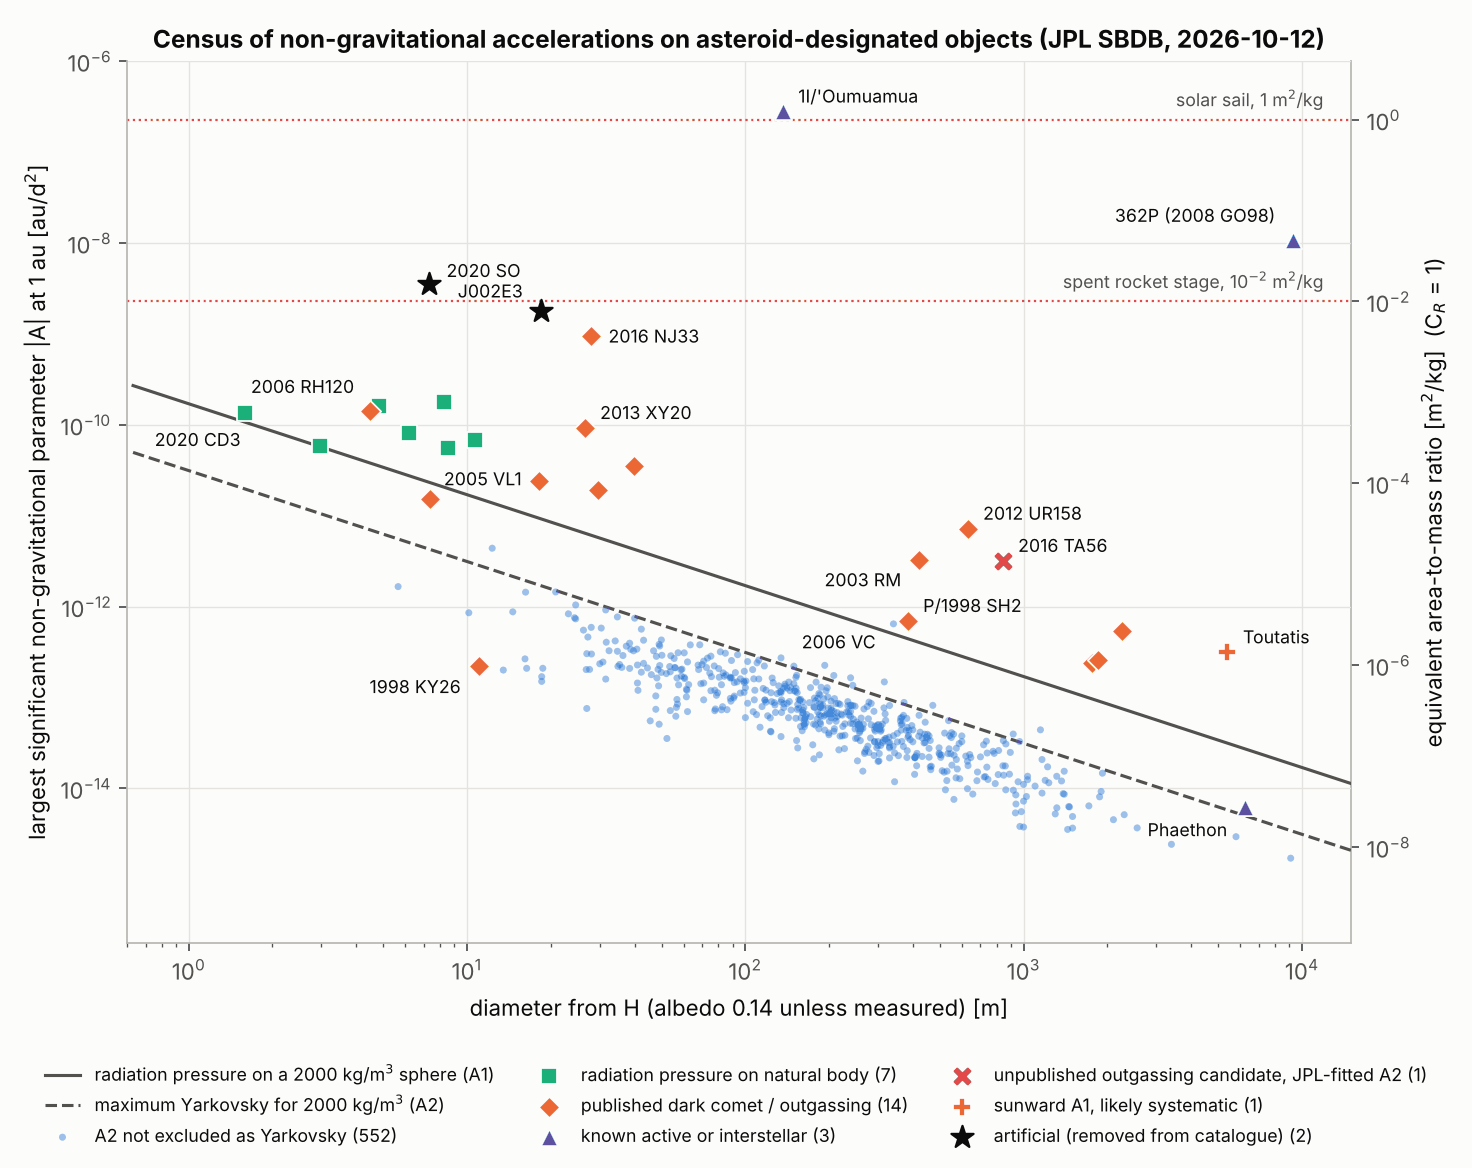
Of 578 asteroid-designated objects with a term at 3σ or more, 552 are not excluded as Yarkovsky drift. Fourteen of these exceed the nominal Yarkovsky maximum and three do so at 3σ: (428209) 2006 VC (7.0 times), 2011 CL50 (1.7 times) and (613995) 2008 NP3 (1.4 times). The rest are 7 radiation-pressure detections on natural bodies (A/m 2.5e-4 to 7.8e-4 m²/kg), 14 published dark comets, 3 known active or interstellar objects, 1 marginal sunward A1 (Toutatis, a probable systematic) and 1 unpublished outgassing candidate, (883607) 2016 TA56. This half of the study reproduces known work with newer data.
| Object or class | A/m or equivalent (m²/kg) |
|---|---|
| 1I/'Oumuamua (Micheli et al. 2018; JPL; this pipeline) | 1.08; 1.23 ± 0.16; 1.063 ± 0.029 |
| 2020 SO (Centaur stage); J002E3 (S-IVB stage) | 0.0157; 0.0079 |
| 2007 AA2 (candidate, this work) | 0.0087 ± 0.0010 |
| 2016 NJ33, largest radial term of an inactive NEO | (4.2 ± 1.3)e-3 |
| Dark comets, total acceleration | 1.0e-6 to 4.2e-3 (median 1.6e-4) |
| Radiation pressure on natural NEOs (7) | 2.5e-4 to 7.8e-4 |
| 2016 TA56 (transverse term) | 1.4e-5 |
'Oumuamua's acceleration is 70–140 times that of the two confirmed rocket bodies and about 260 times the largest radial term of an inactive NEO.
4.2 Direct search (Fig. 5)
N is the raw number tested. Brackets give the weighted number and the share of the size bin. "Fl/Un" is flagged/unresolved.
| Size | A/m ≥ | Single-apparition N | Fl/Un | 95% limit | Multi-apparition N | Un | 95% limit |
|---|---|---|---|---|---|---|---|
| 1–10 m | 0.01 | 8 (0.3%) | 0/0 | 31% | 21 (0.8%) | 0 | 13% |
| 0.1 | 96 (3.5%) | 0/0 | 3.1% | 25 (0.9%) | 0 | 11% | |
| 1 | 596 (21.8%) | 4/1 | 0.79% | 25 (0.9%) | 0 | 11% | |
| 10–100 m | 0.01 | 59 (259; 1.0%) | 1/0 | 5.0% | 423 (840; 3.3%) | 1 | 1.1% |
| 0.1 | 445 (1,953; 7.7%) | 2/0 | 0.67% | 816 (1,624; 6.4%) | 0 | 0.37% | |
| 1 | 2,767 (8,743; 34.5%) | 6/3 | 0.28% | 906 (1,804; 7.1%) | 0 | 0.33% | |
| >100 m | 0.01 | 32 (136; 0.9%) | 0/0 | 8.9% | 599 (6,528; 44.5%) | 0 | 0.50% |
| 0.1 | 204 (792; 5.4%) | 0/0 | 1.5% | 888 (9,688; 66.0%) | 0 | 0.34% | |
| 1 | 564 (2,052; 14.0%) | 2/2 | 1.1% | 898 (9,797; 66.7%) | 0 | 0.33% |
The unresolved objects, all counted as detections, are:
- 2023 TU5 (1–10 m): 0.53 ± 0.13 m²/kg, 4.1σ, 11 observations over 4 days.
- 2015 HA117, 2024 RF, 2026 NX1 (10–100 m): 0.47 ± 0.16, 0.19 ± 0.27, 0.38 ± 0.17. None is significant; their bounds simply do not fall below 1.
- 2009 FO28 (>100 m): 0.88 ± 0.16, which becomes −0.27 ± 0.37 without one station-night. 2016 JP5: 0.31 ± 0.50.
- 2007 AA2 (10–100 m, at X = 0.01): see 4.5.
None is a credible sail. If every flagged object were counted, the single-apparition limits at A/m ≥ 1 would be 1.5%, 0.43% and 1.1%. The multi-apparition limits are set by sample size, not sensitivity. Share of each bin not tested at A/m ≥ 0.01 / 0.1 / 1: 98.9 / 95.6 / 77.3% (1–10 m), 95.7 / 85.9 / 58.3% (10–100 m), 54.6 / 28.6 / 19.3% (>100 m).
4.3 Indirect fit-quality criterion
All arcs. Ranges are R = 0.7 to 1.0. Twenty-seven distinct objects
fail, all because JPL used under 80% of the astrometry and none because
of rms; all are cleared by direct measurement
(data/fit_quality_flagged.csv).
| Size | A/m ≥ | Raw N | 95% limit (raw N) | Limit with weighted N | Bin not tested (R = 0.7) |
|---|---|---|---|---|---|
| 1–10 m | 0.01 | 20 | 13.9% | same | 99.3% |
| 0.1 | 73–57 | 4.0–5.1% | same | 97.3% | |
| 1 | 441–334 | 0.68–0.89% | same | 83.9% | |
| 10–100 m | 0.01 | 192–105 | 1.5–2.8% | 0.73–1.35% | 98.4% |
| 0.1 | 980–864 | 0.31–0.35% | 0.12–0.14% | 90.2% | |
| 1 | 2,568–2,137 | 0.12–0.14% | 0.039–0.046% | 69.4% | |
| >100 m | 0.01 | 419–162 | 0.71–1.8% | 0.53–1.29% | 96.2% |
| 0.1 | 6,303–5,815 | 0.048–0.052% | 0.032–0.035% | 36.4% | |
| 1 | 7,211–7,139 | 0.042% | 0.027–0.028% | 24.7% |
On single-apparition arcs only, at A/m ≥ 1: 0.72–0.97%, 0.18–0.24% and 0.78–0.93% (weighted N: 0.050–0.063% and 0.20–0.24% for the two larger bins). This criterion is indirect: it assumes a sail would spoil the gravity-only fit. Injections support that premise (lowest gravity-only rms of injected sample members 1.67 against a ceiling of 1.4 for R = 0.7, and 2.48 against 2.0 for R = 1).
4.4 Forecast completeness (Figs. 3 and 4; not a limit)
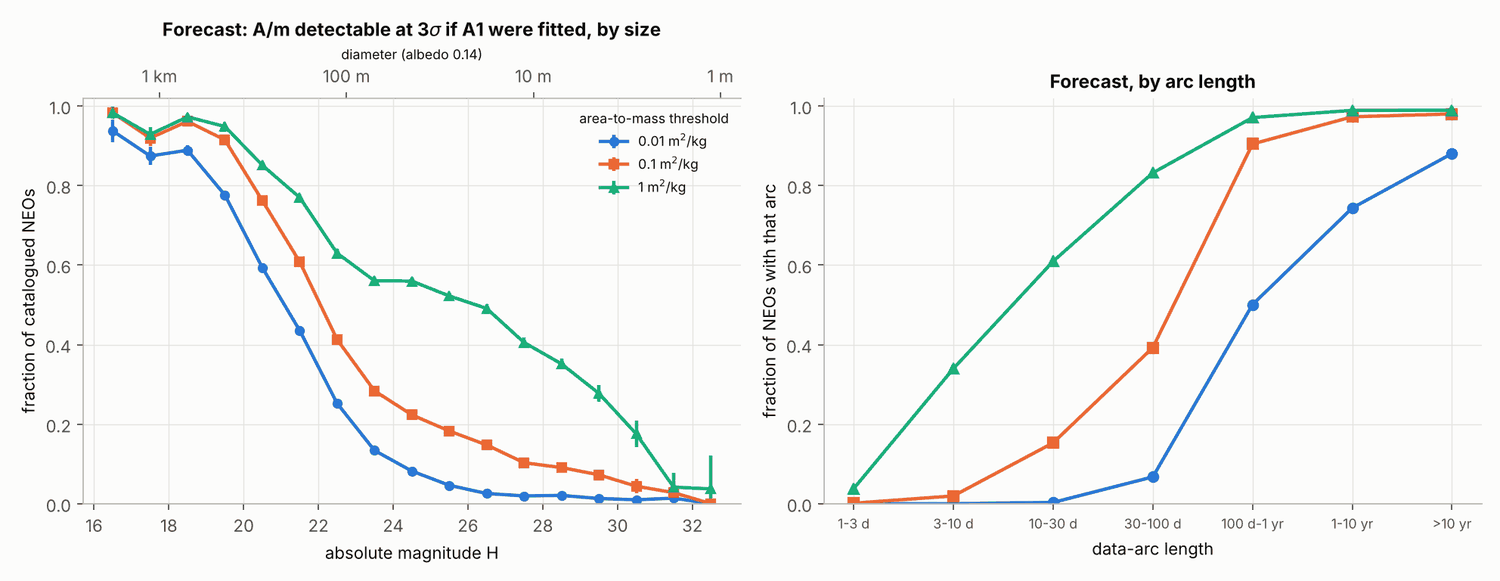
A fit would reach 3σ at A/m = 0.01 / 0.1 / 1 for 24% / 38% / 62% of the catalogue: 1.6 / 7.5 / 31.9% of 1–10 m objects, 7.3 / 20.7 / 52.7% of 10–100 m and 57.5 / 72.1 / 82.7% above 100 m. Arc length decides: at A/m = 1 the sensitive share is 3.8% for arcs of 1–3 d, 61% for 10–30 d and 97% beyond 100 d. The median 1–10 m NEO (arc 2 d) is sensitive only to A/m ≥ 2.2 m²/kg among analysed objects, or 3.7 over the catalogue including arcs under a day.
4.5 Individual objects
| Object | Finding |
|---|---|
| 2007 AA2 (H 24.6, about 43 m; a = 1.03 au, e = 0.12, i = 10.6°) | Apparitions in January 2007 and July 2026. JPL's gravity-only solution has rms 0.67. A/m = 0.0087 ± 0.0010 (A2 solved; own residuals give 0.0088 ± 0.0008). Survives removal of any station-night (minimum 6.4σ); 4.3σ night-compressed. An out-of-plane term A3 = (−1.39 ± 0.14)e-11 au/d², of dark-comet size, fits equally well (Δχ² 100 against 104). Radiation pressure on a 43 m sphere would need a density near 4 kg/m³, so the natural readings are outgassing or a systematic of a two-apparition link. No publication found. |
| (883607) 2016 TA56 | A2 = (−3.19 ± 0.36)e-12 au/d² (8.9σ), fitted by JPL (D. Farnocchia, 2026-06-17); 24 times the generous Yarkovsky bound. Comet-like orbit (Tisserand parameter 2.69). Absent from published dark-comet lists. |
| (428209) 2006 VC | A2 at 7.0 times the nominal Yarkovsky maximum. |
| 2019 EF3 | Metre-class, six-year linkage, JPL rms 1.5. The MPC file holds only its discovery night; no constraint (σ of 2–20 m²/kg). |
| 1991 VG | A/m = (−0.05 ± 0.99)e-4; bound 3.0e-4, at least 26 times below rocket-stage values. |
| 2000 SG344 | −0.010 ± 0.014; bound 0.041. A rocket stage is not excluded. |
| 2005 VL1 (Venera 2 hypothesis) | JPL radial term (−3.7 ± 3.4)e-3. A Sun-facing 10 m² on 963 kg is 4.2σ too high; the proponents' adopted acceleration is 3.1σ too high. |
| 1998 KY26 (Phobos 1 hypothesis) | (1.6 ± 1.7)e-4. Sun-facing 10 m² on 6,220 kg: 8.5σ; the proponents' effective 4.5 m²: 3.3σ. |
5. Robustness checks
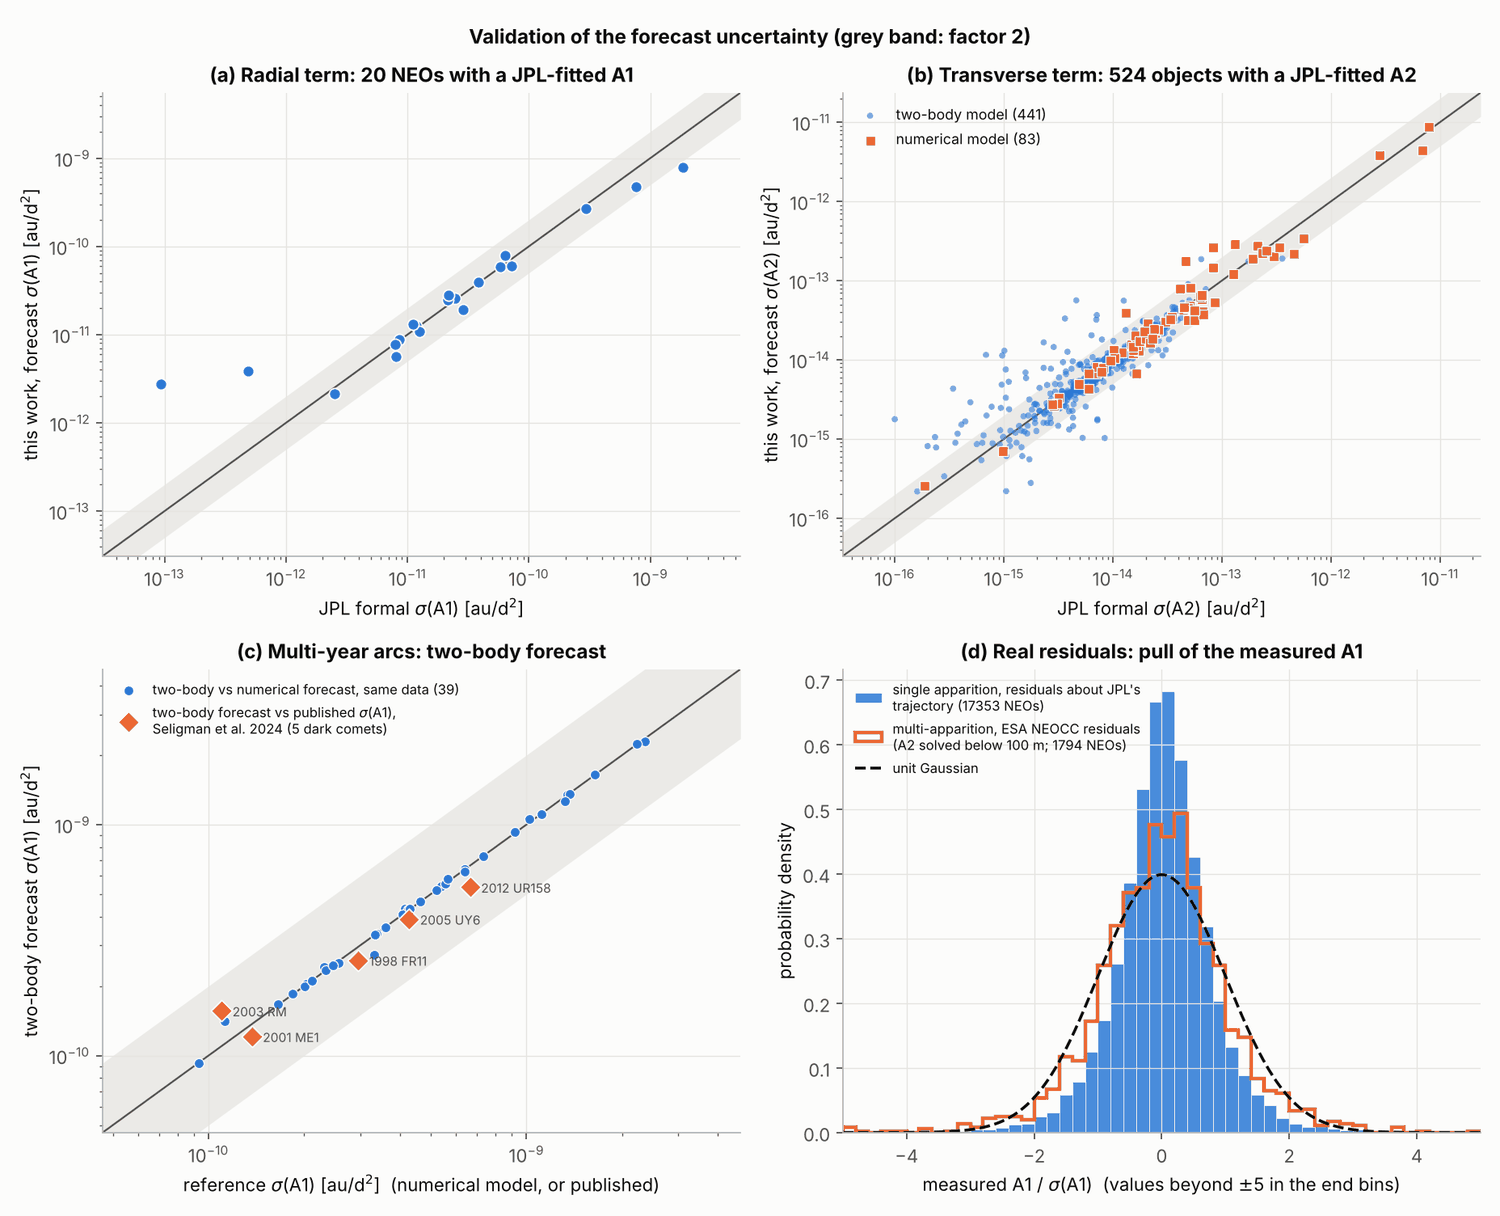
Forecast (Fig. 2). Against JPL's formal σ(A1) for 20 NEOs the ratio has median 1.01 (16–84%: 0.71–1.23). For σ(A2), 524 objects: 0.98. Two-body against numerical on 39 multi-year arcs: 0.82–1.26. Against the published σ(A1) of five dark comets (Seligman et al. 2024) the two-body forecast is 0.25–1.42 of the published value (median 0.77; 0.88 with data truncated at mid-2024), so long-arc forecasts may be optimistic by up to a factor 2. The referee's independent code agrees to 0.6% on 16 short arcs.
Measurement.
- 'Oumuamua, started from a gravity-only orbit: A/m = 1.063 ± 0.029 (Micheli et al.: 1.08).
- A2 recovered from ESA residuals against JPL's A2 (62 objects): median ratio 1.0015 (16–84%: 0.885–1.138), 97% same sign.
- Control objects with a JPL A1: 2006 RH120 6.0e-4 ± 0.2e-4 against 6.29e-4 ± 0.35e-4; 2020 WY and 2021 VH2 agree within 1σ. 2012 TC4, 2016 NJ33 and 2013 BA74 disagree at the 1e-3 level (very close flybys, or JPL solves an A3 that leaks into A1).
- Pulls, single-apparition (17,353 objects): 16–84% width 0.64; 0.12% beyond 5σ (8 outward, 13 sunward), no outward value survives single-night removal.
- Pulls, ESA residuals with A2 solved (923): width 0.89; beyond 5σ one outward (2007 AA2) and two sunward. With A1 alone on the same objects, 1.7% lie beyond 5σ (8 outward, 8 sunward), which is the Yarkovsky leak.
- Own and ESA residuals agree on 339 single-apparition objects (median difference 0.02σ, correlation 0.92).
Injection. Noiseless: detectability matches the forecast (median 1.000). Noisy, end to end: of 120 arcs with A/m = 1 and 40 with 0.1 injected, none is falsely cleared and 158 are recovered at 5σ or more (recovered/injected median 1.00, range 0.77–1.42). The linear step alone would have falsely cleared 20 of 120, which is why the non-linear refit and the 0.75 margin exist. Two-body partials recover A1 alone (0.82–1.16) but not A1 with A2 (0.07–6.1); the maximum Yarkovsky drift of a 100 m body leaks into A/m at a median 3.6e-5 and at most 7e-3 m²/kg.
Variants (direct search, single-apparition, A/m ≥ 1; cells are N / unresolved / limit):
| Variant | 1–10 m | 10–100 m | >100 m |
|---|---|---|---|
| Baseline | 596 / 1 / 0.79% | 2,767 / 3 / 0.28% | 564 / 2 / 1.1% |
| Sample at σ ≤ X/10 | 451 / 1 / 1.05% | 1,934 / 0 / 0.16% | 452 / 0 / 0.66% |
| σ doubled | 398 / 2 / 1.57% | 1,683 / 0 / 0.18% | 415 / 0 / 0.72% |
| σ halved, or C_R = 2 | 842 / 0 / 0.36% | 4,210 / 19 / 0.66% | 741 / 1 / 0.64% |
| No outlier rejection | 596 / 2 / 1.05% | 2,767 / 4 / 0.33% | 564 / 2 / 1.1% |
| Space-based objects excluded | 595 / 1 / 0.80% | 2,727 / 3 / 0.28% | 512 / 2 / 1.2% |
| Albedo 0.04 / 0.45 for size bins | 2.7% / 0.93% | 0.36% / 0.17% | 0.50% / 2.2% |
Multi-apparition, A/m ≥ 0.01: σ ≤ X/10 gives 1.7% (10–100 m) and 0.72% (>100 m); without solving A2, five 10–100 m objects are unresolved (1.9%). Fit-quality criterion, strict variant (JPL used all MPC astrometry), A/m ≥ 1: 0.93–1.24% / 0.17–0.21% / 0.075%; with σ doubled, at A/m ≥ 0.01: 18% / 4.9–8.9% / 4.1–8.2%.
6. Limitations
- Every limit is a fraction of tested, catalogued objects. At A/m ≥ 0.01 almost nothing under 100 m is tested.
- The catalogue is censored on the tested variable. Tracklets are linked with gravity-only orbits; Taylor et al. (2024, Table 1) find 95% of radially accelerated objects linked at 1e-8 au/d² and 75% at 1e-7 (transverse: 38% and 1%), and A/m = 1 (2.3e-7) is outside their grid. Objects with high A/m on Earth-like orbits are removed as presumed human debris, sometimes on dynamical evidence alone; the MPC API returns no astrometry for 2020 SO, J002E3, 2018 CN41 or 2010 KQ.
- The measurement is linearised about another centre's trajectory; it is not an independent orbit determination. Multi-apparition results depend on ESA's residuals and weights.
- For objects above 100 m on multi-year arcs, A2 is not solved, and the worst-case Yarkovsky leak (7e-3) approaches the 0.01 threshold.
- Systematics give values beyond 5σ with both signs in 0.1–0.3% of objects. 2007 AA2 has two sunward counterparts of similar formal significance.
- Raw-count limits assume tested objects are representative of their sampling strata.
- Purely radial model with C_R = 1; sizes from H with albedo 0.14; approximate astrometric weights; no injection through the MPC and JPL pipelines; catalogues change daily.
7. Closest prior work and what is new
Seligman et al. (2023, 2024) plotted catalogued A1 and A2 and defined the dark comets. Farnocchia et al. (2023, 2026) list accelerations object by object. Fenucci et al. (2024, A&A 682, A29) and Del Vigna et al. (2018) run automated Yarkovsky detection with a consistency test against the expected drift; this is the closest prior work for the census, which here is a reproduction with newer data. Taylor et al. (2024) tested linking under injected accelerations. Micheli et al. (2018) measured 'Oumuamua.
New, to my knowledge: (1) a population-level direct search for radial acceleration in the real astrometry of 19,192 NEOs, with limits in area-to-mass units on outcome-independent samples; (2) the per-object sensitivity forecast for the catalogue, validated against JPL, published values and noisy injections; (3) the candidate 2007 AA2 and the radial bound on 1991 VG; (4) one A/m scale joining rocks, dark comets, rocket bodies and 'Oumuamua, which is a synthesis rather than a discovery.
8. Implications for the Fermi Paradox
The study tests one narrow channel: thin or hardware-like artefacts among tracked near-Earth objects. None was found. Among catalogued NEOs with adequate data (samples standing for about 54% of the catalogue), fewer than about 0.3–1% per size class can be sail-like, so 'Oumuamua's acceleration has no analogue among bound NEOs. This rules out sail-like derelicts being common in the tracked population. It is a weak constraint on lurkers in general. At rocket-stage values more than 95% of objects under 100 m are untested. Dense probes look like rocks. The catalogue is censored in the direction that matters, since an object with high A/m on an Earth-like orbit is usually classed as human debris and removed. The result is a modest update: no evidence of light artificial-looking objects at the sensitivities reached, with large and quantified incompleteness. The useful next steps are independent orbit fits for 2007 AA2 and a direct A1 search by the orbit-computing centres, including objects removed as presumed artificial.
9. Response to referee
The referee's verdict was "sound with fixes". No point is rejected outright; four partial departures are noted at the end.
- Outcome-dependent fit-quality sample. Accepted. The sample is now defined from the forecast with fixed R = 0.7 and 1.0. The 27 failing objects are listed and vetted by measurement; all are cleared. With weighted N the limits equal the referee's expected values (0.68–0.89% / 0.039–0.046% / 0.027–0.028% at A/m ≥ 1). I quote raw-N values as primary (section 4.3).
- "Limit, 3σ if fitted" column. Deleted and replaced by a real measurement on 19,192 objects (section 4.2). The forecast is reported as completeness only.
- Limits as fractions of catalogued NEOs. Accepted. Every limit now carries N and the share of the bin. The >100 m class leads with the single-apparition figure; the multi-apparition figure is labelled conditional on linking.
- Headline. Rewritten. Untested fractions at A/m ≥ 0.01 are given for all three bins.
- Taylor et al. citation. Corrected to the Table 1 radial values; A/m = 1 noted as outside their grid.
- Censoring and space-based astrometry. The censoring limitation is added. Space-based astrometry is now placed at the spacecraft (fixed rather than documented), with a variant excluding those objects.
- Validation gaps. Added the short-arc agreement, the Seligman et al. 2024 comparison, noisy injections and the σ-doubled variant as the long-arc systematic.
- 2016 TA56. Now described as JPL's own fit on a comet-like orbit; class renamed. 2006 VC and 2019 EF3 added to the follow-up table.
- Spacecraft hypotheses. Both the Sun-facing case and the proponents' own effective values are given.
- "576 natural". Replaced by "552 not excluded as Yarkovsky", with the objects above the nominal maximum named.
- Fenucci et al. 2024. Cited as closest prior work for the census.
- Raw counts, strict variant, median statement. All added or corrected.
Strongest objection ("no search was performed; the catalogue is filtered"). The search has now been performed. The filtering cannot be fixed from catalogue data and is stated as the main limitation.
Overclaims 1–9. All withdrawn or reworded as requested.
Partial departures. (a) Raw rather than weighted N is primary, which makes several limits weaker than the referee's expected values. (b) At metre scale I count the 4.1σ value of 2023 TU5 as a detection, giving 0.79% where the referee's own test gave 0.47%. (c) I extended the direct search to multi-year arcs with ESA residuals, which the referee did not expect to be verifiable; the A2 comparison and control objects support it. (d) The referee counts four objects above the nominal Yarkovsky maximum at 3σ including Phaethon; Phaethon is in my "known active" class, so the count among the 552 is three.
Files
Code: code/run_all.py (runs s01_download,
s02_census, s03_fisher,
s06_neocc, s04_limits,
s05_injection). Main tables: data/limits.csv,
data/measured_flagged.csv,
data/fit_quality_flagged.csv,
data/robustness_limits.csv,
data/followup_measured_candidates.csv,
data/special_objects.csv,
data/key_numbers.json. Figures:
figures/fig1_census.png to
figures/fig5_limits.png.
Key numbers
| Quantity | Value | Uncertainty | Note |
|---|---|---|---|
| NEOs with a direct A1 measurement on real astrometry | 19,192 | 17,353 own residuals about JPL's trajectory (arcs <= 180 d); 922 ESA NEOCC residuals with A2 solved; 896 ESA residuals, A1 alone; 20 JPL catalogue A1; 1 ESA catalogue A/m. Catalogue: 42,718 NEOs, 25,519 analysed. | |
| 95% upper limit, fraction with A/m >= 1 m2/kg, 1-10 m (direct search, single-apparition) | 0.79% | 0.36-1.57% across analysis variants; 1.5% if all 4 flagged objects are counted | 596 tested (21.8% of the bin); 1 unresolved (2023 TU5, 0.53 +/- 0.13 m2/kg, 4.1 sigma, 11 observations over 4 d) counted as a detection |
| 95% upper limit, A/m >= 1, 10-100 m (direct search) | 0.28% single-apparition; 0.33% multi-apparition | 0.16-0.66% across variants (single-apparition) | single: 2,767 tested (standing for 8,743 = 34.5% of the bin), 3 non-significant unresolved objects counted as detections; multi: 0 of 906 (7.1% of the bin) |
| 95% upper limit, A/m >= 1, >100 m (direct search) | 1.1% single-apparition; 0.33% multi-apparition | 0.64-1.22% across variants (single-apparition) | single: 564 tested (14.0% of the bin), 2 unresolved; multi: 0 of 898 standing for 9,797 (66.7% of the bin), conditional on gravity-only linking |
| 95% upper limit, A/m >= 0.1 (direct search; 1-10 m / 10-100 m / >100 m) | single-apparition 3.1% / 0.67% / 1.5%; multi-apparition 11% / 0.37% / 0.34% | raw tested N: 96 / 445 / 204 and 25 / 816 / 888 | |
| 95% upper limit, A/m >= 0.01 (direct search; 1-10 m / 10-100 m / >100 m) | single-apparition 31% / 5.0% / 8.9%; multi-apparition 13% / 1.1% / 0.50% | raw tested N: 8 / 59 / 32 and 21 / 423 / 599; 2007 AA2 counted as a detection in the 10-100 m multi-apparition cell | |
| Fraction of each size bin NOT tested by the direct search at A/m >= 0.01 / 0.1 / 1 | 1-10 m: 98.9% / 95.6% / 77.3%; 10-100 m: 95.7% / 85.9% / 58.3%; >100 m: 54.6% / 28.6% / 19.3% | catalogue-weighted | |
| Indirect fit-quality limits, all arcs, A/m >= 1 (R = 0.7 to 1.0) | 0.68-0.89% / 0.12-0.14% / 0.042% | with sampling-weighted N: 0.68-0.89% / 0.039-0.046% / 0.027-0.028% | raw N 441-334 / 2,568-2,137 / 7,211-7,139; sample defined from the forecast and a fixed rms ceiling; 27 failing objects, all vetted by measurement and cleared |
| Indirect fit-quality limits, all arcs, A/m >= 0.01 (R = 0.7 to 1.0) | 13.9% / 1.5-2.8% / 0.71-1.8% | weighted N: 13.9% / 0.73-1.35% / 0.53-1.29%; sigma x2: 18% / 4.9-8.9% / 4.1-8.2% | raw N 20 / 192-105 / 419-162 |
| Forecast completeness (not a limit): share of catalogue where a fit would reach 3 sigma at A/m = 0.01 / 0.1 / 1 | 24% / 38% / 62% | by bin at A/m = 1: 31.9% (1-10 m), 52.7% (10-100 m), 82.7% (>100 m); at 0.01: 1.6%, 7.3%, 57.5% | |
| Median 3-sigma-if-fitted sensitivity in A/m | 1-10 m: 2.2 (analysed) / 3.7 (catalogue) m2/kg; 10-100 m: 2.2 / 0.84; >100 m: 0.0061 / 0.0067 | median arcs 2 d, 11 d, 2,800 d | |
| Candidate 2007 AA2: radial A/m | 0.0087 m2/kg | +/- 0.0010 (8.8 sigma formal; 4.3 sigma with one point per station-night) | two apparitions (2007, 2026); survives removal of any station-night (min 6.4 sigma); an out-of-plane A3 = (-1.39 +/- 0.14)e-11 au/d2 fits equally well; two sunward values of similar formal significance exist in the same 923-object sample; unpublished |
| 1991 VG radial A/m (ESA residuals, A2 solved) | (-0.05 +/- 0.99)e-4 m2/kg; upper bound 3.0e-4 | at least 26 times below confirmed rocket-stage values (0.0079-0.0157) | |
| Census: asteroid-designated objects with a >= 3 sigma non-gravitational term (JPL SBDB, 2026-10-12) | 578 of 615 | 552 not excluded as Yarkovsky (14 above the nominal maximum, 3 at 3 sigma); 7 radiation pressure; 14 published dark comets; 3 known active/interstellar; 1 marginal sunward A1 (Toutatis); 1 unpublished outgassing candidate (2016 TA56) | |
| (883607) 2016 TA56 transverse term A2 (JPL solution, D. Farnocchia, 2026-06-17) | -3.19e-12 au/d2 | +/- 0.36e-12 (8.9 sigma) | 24 times the generous Yarkovsky bound; Tisserand parameter 2.69 (comet-like orbit); A/m-equivalent 1.4e-5 m2/kg |
| 1I/'Oumuamua A/m | 1.08 m2/kg (Micheli et al. 2018, 4.92e-6 m/s2 at 1 au); this pipeline 1.063 | +/- 0.029 (this pipeline, from a gravity-only start); JPL 1.23 +/- 0.16 | 70-140 times the two confirmed rocket bodies; about 260 times the largest radial A/m of an inactive NEO (2016 NJ33, (4.2 +/- 1.3)e-3) |
| Forecast sigma(A1) / JPL formal sigma(A1) | median 1.01 | 16-84%: 0.71-1.23; 17 of 20 within a factor 2 | sigma(A2): 0.98 (524 objects); two-body vs numerical 0.82-1.26; vs Seligman et al. 2024 (5 objects): median 0.77, range 0.25-1.42 |
| Transverse A2 recovered from ESA residuals / JPL A2 | median 1.0015 | 16-84%: 0.885-1.138 | 62 objects with JPL A2 >= 3 sigma and no non-gravitational term in ESA's solution; 97% same sign |
| End-to-end noisy injection test: false clearances | 0 of 160 | 120 arcs at A/m = 1 and 40 at 0.1; 158 recovered at >= 5 sigma; recovered/injected median 1.00 (0.77-1.42) | |
| Conversion: A1 per unit area-to-mass (C_R = 1) | 2.2654e-7 au/d2 per m2/kg |
Changes made after the referee report
- Replaced the outcome-dependent 'excluded by fit quality' sample by one defined from the forecast and a fixed rms ceiling (s >= 2R sqrt(2n), R = 0.7 and 1.0); listed all 27 failing objects (all because JPL used under 80% of the astrometry, none by rms), vetted each by direct measurement, and recomputed the limits (data/fit_quality_flagged.csv, data/limits.csv).
- Deleted the '95% limit, 3 sigma if fitted' column and replaced it with a real search: A1 fitted to the real astrometric residuals of 19,192 NEOs (17,353 single-apparition objects from own residuals about JPL's trajectory; 1,818 multi-apparition objects from ESA NEOCC post-fit residuals, new script code/s06_neocc.py). The forecast is now reported only as completeness.
- All limits are now stated as 'among N tested objects (x% of the bin)', computed from raw tested counts, with weighted counts beside them; the >100 m class leads with the single-apparition figure and the multi-apparition figure is labelled conditional on gravity-only linking.
- Rewrote the headline: the first-pass limits (0.53% / 0.032% / 0.027% at A/m >= 1; 12% / 0.46% / 0.20% at 0.01) are withdrawn; untested fractions at A/m >= 0.01 are given for all three size bins.
- Added protections found necessary during the revision: non-linear refit of significant short-arc estimates, a 0.75 linearisation margin on upper bounds, joint solution of A2 on multi-year arcs with numerical partials (Yarkovsky was leaking into A1), leave-one-station-night-out and night-compressed significance, and rules that count unresolved objects as detections.
- Space-based astrometry (143,304 observations of 1,966 analysed objects) is now placed at the spacecraft using the satellite position records instead of at the geocentre; a variant excluding these objects is in the robustness table.
- Added validations: comparison with Seligman et al. 2024 published sigma(A1) for five dark comets; A2 recovered from ESA residuals against JPL's A2 (62 objects); JPL-A1 control objects; 'Oumuamua positive control from a gravity-only start; pull distributions with sign counts; noisy end-to-end injection test (0 of 160 false clearances); two-body-partials injection test including Yarkovsky leakage.
- Corrected the Taylor et al. (2024) citation to their Table 1 radial values (0.95 linked at 1e-8, 0.75 at 1e-7 au/d2; transverse 0.38 and 0.01) and noted that A/m = 1 is outside their grid.
- Added limitations: the catalogue is censored by removal of presumed-artificial objects (the MPC API returns no astrometry for 2020 SO, J002E3, 2018 CN41 and 2010 KQ) and by gravity-only linking.
- 2016 TA56: stated that the A2 term is JPL's own fit (D. Farnocchia, 2026-06-17) and that the orbit is comet-like (Tisserand parameter 2.69); class renamed 'unpublished outgassing candidate'. Added (428209) 2006 VC, 2019 EF3 and the new candidate 2007 AA2 to the follow-up list.
- Spacecraft-hypothesis rows for 2005 VL1 and 1998 KY26 now give both the Sun-facing 10 m2 case (4.2 and 8.5 sigma) and the proponents' own effective values (3.1 and 3.3 sigma).
- Census wording changed to '552 not excluded as Yarkovsky', with the 14 objects above the nominal maximum (3 at 3 sigma) identified; Fenucci et al. 2024 cited as closest prior work and the census described as a reproduction with newer data.
- Robustness table extended: raw counts, strict variant (JPL used all MPC astrometry), sigma x2 and sigma/2, no outlier rejection, space-based objects excluded, tested sample at sigma <= X/10, A2 not solved, albedo variants. Median sensitivity statement corrected (2.2 m2/kg over analysed objects, 3.7 over the catalogue).
- Full pipeline rerun with the final code (24.6 min); all data tables and five figures regenerated; figure labels and legends updated.
Referee points not accepted
- No referee point is rejected outright. Four partial departures follow, each with its evidence.
- Expected limit values: the referee's expected values (for example 0.04-0.05% for 10-100 m at A/m >= 1) use sampling-weighted N. I reproduce them exactly with weighted N (0.039-0.046%) but quote raw-count limits as primary (0.12-0.14%), because a weighted N treats objects that were never analysed as tested (the referee's own error 9).
- Direct test at metre scale: the referee obtained 0 candidates of 633 objects (limit 0.47%). My count is 1 unresolved of 596 (limit 0.79%), because I count the 4.1-sigma value of 2023 TU5 (11 observations over 4 d) as a detection rather than dismissing it; without it the limit would be 0.50%.
- Rocket-stage level: the referee could not verify limits at A/m >= 0.01 by direct measurement and expected only the indirect criterion to reach it. I extended the direct search to multi-year arcs with ESA NEOCC residuals and kept those limits (13% / 1.1% / 0.50%), supported by: A2 recovered from the same residuals matches JPL's A2 (median ratio 1.0015, 62 objects), JPL-A1 control objects are recovered (2006 RH120 6.0e-4 vs 6.29e-4 m2/kg), and the night-compressed pull width is 0.53. They remain conditional on gravity-only linking.
- Yarkovsky count: the referee lists 15 objects above the nominal maximum, 4 at 3 sigma, including Phaethon. Phaethon is in my 'known active' class, so among the 552 the counts are 14 and 3; with Phaethon they equal the referee's.
Figures
Code
Every number above is produced by these scripts from public data. The data tables themselves are not hosted here; the scripts download them.
common.py orbfisher.py run_all.py s01_download.py s02_census.py s03_fisher.py s04_limits.py s05_injection.py s06_neocc.py
Referee report
A second, separate analysis re-ran the code, recomputed the main numbers by its own route and tried to break the result. Like the first, it was run by Claude for this project; it is not an outside expert. In its report “the analyst” is the first analysis, which wrote the paper, and file names that are not linked on this page are its own working files. The paper above is the version revised in response.
Verdict: sound with fixes. Results reproduced: yes.
All headline numbers reproduce, and the central null result (no sail-like object, A/m >= 1 m2/kg) survives a direct test on real astrometry that the analyst did not make. The limits themselves are somewhat too optimistic and need restating (see errors).
WHAT I RERAN
- s02_census + s04_limits from the stored fisher_results.csv: limits.csv, census_summary.csv, robustness_limits.csv, completeness_by_bin.csv, special_objects.csv, validation_sigma.csv and key_numbers.json are byte-identical to the analyst's.
- s03_fisher on a random 1,200-object subsample: sig_A1, sig_A2, sig_A1_with_A2, res_med identical to the stored values for every object. The 'Oumuamua validation file is identical.
- s05_injection: identical (median 1.000, range 0.94-1.07).
- I did not rerun the full 18-minute Fisher step or re-download the 456 MB MPC file.
INDEPENDENT CHECKS
- Live JPL SBDB query (2026-10-12), my own script: 980 objects with non-gravitational parameters; 615 asteroid-designated (A1 22, A2 611, A3 11); 578 with a term at >= 3 sigma; 17 flagged non-radiative. All match. 2016 TA56: A2 = -3.186e-12 au/d2, 23.9 times the generous Yarkovsky bound, A/m-equivalent 1.41e-5. Matches.
- Constants: 1361/c = 4.540e-6 N/m2; 1 au/d2 = 20.04 m/s2; A1 per unit A/m = 2.2654e-7 au/d2. Correct. 'Oumuamua 4.92e-6 m/s2 gives 1.08 m2/kg; the JPL value 2.790e-7 au/d2 gives 5.59e-6 m/s2 and 1.23 m2/kg. Correct.
- JPL Horizons: J002E3 AMRAT = 0.0079; 2020 SO A1 = 3.5566674695484e-9 au/d2 with a pure 1/r2 law (0.0157 m2/kg). Both verified.
- Independent sigma(A1) forecast (my own code: astropy ephemerides and station positions, DOP853 integration, finite-difference partials; only the weights shared) for 16 short-arc NEOs across the three size bins: ratio referee/analyst 0.997-1.006. The forecast is numerically right in the short-arc regime, which the analyst's JPL validation did not cover (all 20 of their A1 validation objects have arcs of 74 d or more).
- Extra validation of the two-body long-arc forecast against published sigma(A1) for five multi-apparition dark comets (Seligman et al. 2024, Table 2): forecast/published = 0.88, 0.77, 0.57, 1.42, 0.26 (median 0.77). The comparison is loose because today's arcs are longer than those Seligman used, but it suggests the long-arc forecast is optimistic by up to a factor 2, and 4 in one case.
- Direct measurement instead of forecast. For 6,569 short-arc objects
I fitted the real MPC residuals about JPL's trajectory with 6 state
corrections plus A1 (linearised, 3-sigma clipping, space-based
observations dropped). Result: A1/sigma has median 0.03 and 16-84% range
-0.64 to +0.69, so the forecast uncertainties are conservative by about
1.5 times. Among objects with sigma(A/m) <= 0.2 (a sail would be a
5-sigma signal):
- 1-10 m: 0 candidates of 633 (95% limit 0.47%)
- 10-100 m: 2,622 objects, two marginal values (2015 FP, 2016 VU1; about 0.5 +/- 0.18, unstable when one night is removed)
100 m: 593 objects, one value driven by a single night (2009 FO28) No object has a measured A/m consistent with 1 or more. For A/m >= 0.1 there are 0 candidates among 116 / 491 / 219 short-arc objects and 0 among 427 multi-apparition 10-100 m objects. This test cannot reach A/m ~ 0.01 on multi-year arcs: the analyst's simplified dynamics do not reproduce JPL's trajectories well enough there (pre-fit rms median 2.1 sigma, symmetric tails out to 8 sigma).
- Citations checked through the arXiv API and the analyst's downloaded texts: 2609.24283, 2503.03552, 2503.09137, 2410.06874, 2412.07603, 2212.08115, 2212.08135, 1810.11490, 1703.03479 all exist with the stated content. Farnocchia et al. 2026 (Nat. Astron., doi 10.1038/s41550-026-02913-7, P/1998 SH2) is confirmed by the Nature page and the JPL release. Micheli et al. 2018 does say "(4.92 +/- 0.16) x 10-6 m s-2" and "AMR between 0.5 and 1 m2 kg-1". The Seligman 2024 Table 2 values in the code match the paper.
Strongest objection
No search was actually performed, and the catalogue is filtered on the very quantity being tested.
JPL has fitted a radial term for 22 objects. For everything else the study has (a) a forecast of what a fit would achieve and (b) an argument that a sail would have spoiled JPL's gravity-only rms. Leg (b) is circular as a statistical limit: an object is counted as 'tested' only if its fit is good, so a sail can never be in the tested set and 'zero of N' is guaranteed. The catalogue itself has also been shaped by gravity-only processing at three stages: the MPC links tracklets with gravity-only orbits, JPL adds non-gravitational terms or rejects outliers when a fit fails, and objects that show high area-to-mass on Earth-like orbits are deleted as presumed human debris, often without a positive identification. An expert would say a null result in such a catalogue is close to automatic.
Does the conclusion survive? For sail-like objects (A/m >= 1), yes, with weaker numbers. I replaced the circular step by a direct measurement on the real astrometry of 6,569 short-arc objects: none has an A/m consistent with 1 (0 of 633 metre-class objects with 5-sigma sensitivity, limit 0.47%; nothing credible among 2,622 objects of 10-100 m and 593 larger ones). Redefining the tested sample independently of the outcome changes the limits by a factor 1.0-1.7 at A/m >= 1. The whole catalogue contains only 12 objects with normalised rms above 1.3, all on arcs of two days or less except one doubtful linkage, so there is no hidden population of bad fits. Single-apparition arcs avoid the cross-apparition linking bias, and Taylor et al. find radial accelerations are mostly still linked (75% at 1e-7 au/d2).
For rocket-stage-like objects (A/m >= 0.01) the conclusion survives only as a much weaker statement: about 14%, 1% and 1% rather than 12%, 0.46% and 0.20%, resting on JPL's rms and on multi-year arcs, and not verifiable with the analyst's dynamical model. The censoring by 'artificial' reclassification cannot be removed at all: the result bounds what is in the asteroid catalogue, not what is in space.
Errors found
- major. The 'excluded by fit quality' sample is
selected on the outcome. An object enters N only if its observed JPL rms
is low enough (s <= 2rmssqrt(2n)), and a real sail could
never pass that test, so 'zero detections among N' is true by
construction. A Clopper-Pearson limit of 3/N is valid only if the sample
is defined by data quality alone and the testable objects that fail are
counted or vetted. Objects with poor fits, the only ones that could be
signals, are silently moved to 'insensitive'.
- Evidence: Recast with an outcome-independent definition (forecast s >= 2Rsqrt(2n), R fixed at 0.7 or 1.0; any sail in the sample would then show rms >= 2R, and no such object exists). 95% limits become: A/m>=1: 0.68-0.89% / 0.039-0.046% / 0.027-0.028% (analyst 0.53 / 0.032 / 0.027); A/m>=0.1: 4.0-5.1% / 0.12-0.14% / 0.032-0.035% (analyst 2.8 / 0.098 / 0.031); A/m>=0.01: 14% / 0.73-1.35% / 0.54-1.3% (analyst 12 / 0.46 / 0.20). In addition 3 / 7 / 17 analysed objects in the testable sample at A/m>=1 fail only because JPL used under 80% of the MPC astrometry (e.g. 2022 FY, 2023 BU, 2023 TD167; 2018 GE, 2019 OK, 2005 TD49, 2015 XU169, 2003 TT9, (679648); (2340) Hathor). Counted as unvetted candidates they would raise the limits to about 2%, 0.4% and 0.3%. The four I could measure directly (2023 TD167, 2005 TD49, 2018 GE, 2015 XU169) are consistent with zero and exclude A/m>=1.
- Fix: Define the tested sample from forecast sensitivity and a fixed rms ceiling (not each object's own rms), list every testable object that fails (high rms or under 80% of astrometry used), vet each one, and quote the recast limits. Give the range for R = 0.7-1.0 as a systematic. Quote the rocket-stage limits as about 14%, about 1% and about 1%, not 12%, 0.46% and 0.20%.
- major. The table in section 4.3 has a column '95%
limit, 3 sigma if fitted' (6.6%, 1.5%, 0.34%, ... 0.025%). No A1 was
fitted for these objects, so these are not limits on anything; k = 0 is
assumed, not observed.
- Evidence: s04_limits.limits() takes k from the census of the 22 objects with a catalogued A1 and applies it to the forecast-sensitive N. The report text admits the criterion is hypothetical but still prints the numbers as limits.
- Fix: Relabel the column 'limit that would follow if A1 were fitted and nothing found', or delete it. Alternatively replace it with a real measurement: my linearised A1 estimates on 6,569 short-arc objects show this is cheap (minutes) and give 0 candidates of 633 metre-class objects at A/m>=1.
- major. The headline limits are described as
fractions 'of catalogued NEOs', but they apply only to the testable
subset: 568 of 2,731 (21%) for 1-10 m, 9,488 of 25,308 (37%) for 10-100
m, 11,295 of 14,679 (77%) for >100 m at A/m>=1. The >100 m and
10-100 m figures also rest mostly on multi-apparition arcs, which exist
only because a gravity-only orbit linked them.
- Evidence: limits.csv, n_sensitive against n_catalogued. With single-apparition arcs only and the recast definition, A/m>=1 gives 0.72-0.96% (N 416-309), 0.050-0.063% (N 5,974-4,718) and 0.20-0.24% (N 1,480-1,241). Testable objects have longer arcs than average, which is not independent of being a sail if sails are harder to follow.
- Fix: State every limit as 'among the N testable objects (x% of the bin)'. For >100 m, lead with the single-apparition figure (about 0.2%) and give the all-arc figure (0.027%) as conditional on linking being unaffected. Change 'a few per ten thousand catalogued NEOs of 10 m or more' to 'fewer than about 5 per 10,000 testable 10-100 m objects and about 2 per 1,000 testable larger ones on single-apparition arcs'.
- minor. Taylor et al. (2024) are misquoted. The
report says they 'show that linking fails for |A| >= 1e-8 au/d2 (A/m
>= 0.04)'.
- Evidence: Their Table 1 gives linked fractions for a radial acceleration of 0.95 at 1e-8 and 0.75 at 1e-7 au/d2; it is the transverse component that collapses (0.38 and 0.01). The abstract says the algorithms 'fail to link a significant fraction'. A/m = 1 (2.3e-7 au/d2) lies beyond their grid.
- Fix: Quote the radial numbers: about 5% loss at 1e-8 and about 25% at 1e-7 au/d2, untested at 2.3e-7. Note that this makes the multi-apparition denominators less biased than the report feared for A/m <= 0.4, and that the bias is unquantified at A/m = 1.
- minor. Space-based observations are placed at the
geocentre. Station codes without parallax constants default to (0,0,0)
and the satellite position lines are discarded. This is not documented.
- Evidence: 28,455 observations (1.3%) of 1,812 objects: C51 NEOWISE 21,003, C57 TESS 6,362, plus 270, 247, C53, 258, 274, C55; 115 objects have over half their astrometry from space. In my residual-based test this produced fake 4-10 sigma 'detections' of A/m 0.3-0.7 (2010 XO10, 2014 BH25, 2021 HU2, 2021 XE4, 2020 HB10), each of which vanished when the single C51 night was removed. The effect on the Fisher forecast is negligible, and the HST points in the 'Oumuamua check are affected the same way.
- Fix: Parse the satellite lines or drop these observations, and say so in the limitations. Anyone who reuses the residuals (res_med, res_p90) should know.
- minor. The validation of sigma(A1) does not cover
the two regimes that carry the limits: short arcs (days to weeks,
numeric model) and multi-year arcs with the two-body model. The 20 JPL
comparison objects all use the numeric model on arcs of 74 d to 92 yr.
The injection test is internal and noiseless, so it tests linearity
only.
- Evidence: My independent code agrees to 0.6% on 16 short arcs, so that regime is fine. Against Seligman et al. 2024's published sigma(A1) for five multi-apparition objects the two-body forecast is 0.26-1.42 of the published value (median 0.77).
- Fix: Add both comparisons. Treat the long-arc forecast as possibly optimistic by a factor 2 and carry the existing 'sigma x 2' variant as the quoted systematic for the >100 m bin.
- minor. 2016 TA56 is presented as an 'automatic
flag' on an 'apparently unpublished' case. The acceleration is JPL's own
measurement: the solution was produced manually by Davide Farnocchia on
2026-06-17.
- Evidence: Live SBDB record: producer 'Davide Farnocchia', soln_date 2026-06-17, 94 observations, arc 2007-2026, rms 0.43. The orbit is comet-like (Tisserand parameter about 2.7, q = 0.59 au, i = 32 deg). My web and arXiv searches also found no paper.
- Fix: Say that JPL fitted this term in June 2026, that the analyst's contribution is noticing it is absent from the published dark-comet lists, and that its Jupiter-family-like orbit makes outgassing the obvious reading. Drop 'no published explanation' from the class name.
- minor. The tests of the spacecraft hypotheses
assume a permanently Sun-facing 10 m2 panel with C_R = 1, which the
hypothesis authors do not claim.
- Evidence: Hibberd et al. (arXiv:2609.24283) derive an effective area of about 4.5 m2 for 6,220 kg (7.2e-4 m2/kg) and a mostly non-radial force. Against JPL's radial term (1.6 +/- 1.7)e-4 m2/kg that is about 3.3 sigma, not 8.5 sigma.
- Fix: Report both: Sun-facing 10 m2 is excluded at 8.5 sigma; the authors' own effective area is in about 3 sigma tension with the radial term. Same caveat for 2005 VL1 (4.2 sigma only if Sun-facing).
- minor. In sampled strata the weighted N
extrapolates the pass rate to objects that were never analysed, and the
80% rule lets up to a fifth of an object's astrometry be discarded by
JPL.
- Evidence: Directly analysed objects passing at A/m>=1: 3,292 (10-100 m) and 7,291 (>100 m), giving 0.091% and 0.041% instead of 0.032% and 0.027%. Requiring that JPL used all the MPC astrometry cuts N by 25-50% (limits 0.70% / 0.045% / 0.052% at A/m>=1; 18% / 0.73% / 0.43% at 0.01). JPL also counts some DECam 2014 objects at twice the MPC number (74 objects), a bookkeeping oddity.
- Fix: Give the raw analysed counts beside the weighted ones and add the strict no-rejection variant to the robustness table.
- minor. 'Yarkovsky-consistent' (552 objects) means
not excluded by a deliberately generous bound (1000 kg/m3, albedo 0.45),
yet the headline says 576 of 578 'have a natural or already-published
classification'.
- Evidence: 15 of these exceed the nominal maximum (2000 kg/m3, albedo 0.14) and 4 exceed it at 3 sigma: (428209) 2006 VC at 7 times nominal (3.7 sigma detection), 2011 CL50, (613995) 2008 NP3, Phaethon.
- Fix: Say '552 not excluded as Yarkovsky' and list the four that pass only because of the generous bound; add 2006 VC to the follow-up table.
- minor. Small text slips. The 'median 1-10 m NEO is
sensitive only to A/m >= 2.3' is the median over analysed objects (I
get 2.19); weighted over the catalogue including arcs under 1 d it is
3.65. 2019 EF3, the only metre-class object with a multi-year arc and a
poor fit (rms 1.5, 84 observations, 2019-2025 in SBDB), is counted
insensitive because the MPC file holds only its discovery night.
- Evidence: sensitivity_per_object.csv; SBDB and MPC API records for 2019 EF3 (80 observations, all on 2019-03-12 from station 568).
- Fix: Correct the median statement and add one line on 2019 EF3 (probably a doubtful linkage, but it is exactly the kind of object the criterion discards without looking).
Overclaims
- Headline: 'No catalogued near-Earth asteroid shows a sail-like or even rocket-stage-like radial acceleration.' Only 22 objects have a fitted A1. For rocket-stage values (A/m >= 0.01) about 99% of metre-class objects, 97% of 10-100 m objects and 90% of larger ones are not excluded by anything. Should read: 'none of the 22 objects with a fitted radial term, and none of the N objects whose gravity-only fits would have exposed it'.
- 'The 95% upper limit on the fraction of catalogued NEOs with A/m >= 1 is 0.53% / 0.032% / 0.027%.' These are fractions of the testable subset (21% / 37% / 77% of each bin), and after removing the outcome-dependent selection they are 0.7-0.9% / 0.04-0.05% / 0.03% (0.2% for >100 m on single-apparition arcs).
- 'For A/m >= 0.01 it is only 12%, 0.46% and 0.20%.' With a sample defined independently of the observed rms these are about 14%, 0.7-1.4% and 0.5-1.3%, and I could not verify them by direct measurement.
- The '95% limit, 3 sigma if fitted' column (down to 0.022%) is a forecast of what a search would deliver, not a limit; no search was done.
- '576 have a natural or already-published classification.' For 552 of them 'natural' means 'not excluded by a generous Yarkovsky bound'; four exceed the nominal Yarkovsky maximum at 3 sigma.
- 'which limits lurker or derelict-sail hypotheses to a few per ten thousand catalogued NEOs of 10 m or more.' True only for A/m >= 1, only among testable objects, and only if multi-apparition linking is unbiased. It also ignores that objects showing high A/m on Earth-like orbits are routinely removed from the catalogue as presumed human debris.
- 'Taylor et al. (2024) show that linking fails for |A| >= 1e-8 au/d2.' For radial accelerations they find 95% linked at 1e-8 and 75% at 1e-7.
- 2016 TA56 as an 'automatic flag' and 'unexplained': the term was measured by JPL in June 2026 and the orbit is comet-like.
- '10 m2 on 6,220 kg (Phobos 1 hypothesis) is 8.5 sigma too high': only for a permanently Sun-facing panel; the proponents' own effective area gives about 3 sigma.
Novelty check
Novel: partly. The census half reproduces known work with newer data. The dark-comet lists are Seligman et al. 2023/2024 and Farnocchia et al. 2023/2026; automated Yarkovsky detection with a consistency test against the expected drift is Fenucci et al. 2024 (A&A 682, A29, arXiv:2311.10175, not cited), Del Vigna et al. 2018 and Greenberg et al. 2020; the radiation-pressure detections are Micheli et al. and Farnocchia et al. The non-gravitational term of 2016 TA56 was fitted by JPL in June 2026; the analyst only noticed it is unpublished.
What I could not find anywhere (web and arXiv searches, 2026-10-12) is a population-level statement in area-to-mass units: a per-object forecast of radial-acceleration sensitivity for the existing NEO catalogue, and upper limits on the fraction of catalogued NEOs with rocket-stage-like or sail-like A/m. The nearest are Taylor et al. 2024 (linking under injected accelerations for 1,000 NEOs), LSST detectability forecasts (Levine, Rubin 2024 talk; no paper found) and single-object bounds (2009 BD, 2011 MD, 2020 CD3, 2024 PT5). That part appears to be new, and the common A/m scale joining rocks, dark comets, rocket bodies and 'Oumuamua is a useful synthesis rather than a discovery.
- Seligman et al. 2023, PSJ, arXiv:2212.08115 (catalogued A1/A2/A3 of small NEOs; six dark comets)
- Seligman et al. 2024, PNAS, arXiv:2412.07603 (14 dark comets, Table 2 with A1 and its uncertainty)
- Farnocchia et al. 2023, arXiv:2212.08135 (2003 RM)
- Farnocchia et al. 2026, Nat. Astron., doi:10.1038/s41550-026-02913-7 (P/1998 SH2)
- Taylor et al. 2024, arXiv:2410.06874 (MPC linking with injected non-gravitational accelerations; search for unlinked pairs)
- Fenucci et al. 2024, A&A 682, A29, arXiv:2311.10175 (automated Yarkovsky detection and consistency test at ESA NEOCC; not cited by the analyst)
- Del Vigna et al. 2018, arXiv:1805.05947 (Yarkovsky and radiation-pressure detections among NEAs)
- Micheli et al. 2012, 2013, 2014 (radiation pressure on 2009 BD, 2012 LA, 2011 MD; natural A/m)
- Micheli et al. 2018, Nature 559, 223; Bialy & Loeb 2018, arXiv:1810.11490 ('Oumuamua)
- Loeb & Cloete 2025, arXiv:2503.03552; Spada 2025, arXiv:2503.09137; Hibberd et al. 2026, arXiv:2606.01288 and 2609.24283 (spacecraft hypotheses for 2005 VL1 and 1998 KY26)
Required changes
- Section 3 ('Two criteria') and s04_limits.add_sensitivity: replace the per-object bound s <= 2rms_obssqrt(2n) by a sample defined without the observed rms (forecast s >= 2Rsqrt(2n) with fixed R; give R = 0.7 and 1.0). List every object in that sample that fails (rms >= 2R, or JPL used under 80% of the astrometry), vet each, and recompute limits. Expected values: A/m>=1: 0.7-0.9% / 0.04-0.05% / 0.03%; A/m>=0.1: 4-5% / 0.12-0.14% / 0.03%; A/m>=0.01: 14% / 0.7-1.4% / 0.5-1.3%.
- Section 4.3 table: delete or relabel the '95% limit, 3 sigma if fitted' column; it is a forecast, not a limit. Better, replace it with measured values: fit A1 to the real residuals for the short-arc sample (a linearised fit takes minutes; I obtained 0 candidates of 633 metre-class objects at A/m>=1, limit 0.47%).
- Headline, key numbers and section 8: write each limit as 'among the N testable objects (x% of the size bin)', not as a fraction of catalogued NEOs. For >100 m lead with the single-apparition limit (about 0.2%) and present 0.027% as conditional on unbiased linking. Replace 'a few per ten thousand catalogued NEOs of 10 m or more'.
- Headline first sentence: change 'No catalogued near-Earth asteroid shows a sail-like or even rocket-stage-like radial acceleration' to a statement limited to the 22 objects with fitted A1 and the N objects excluded by fit quality; state the untestable fractions at A/m>=0.01 for all three bins, not only for metre-class objects.
- Section 5, linking paragraph: correct the Taylor et al. citation to their Table 1 radial values (0.95 linked at 1e-8, 0.75 at 1e-7 au/d2; transverse 0.38 and 0.01) and note that A/m = 1 lies outside their tested range.
- Section 6: add the limitation that objects showing high A/m on Earth-like orbits are removed from the catalogue as presumed artificial, sometimes on dynamical evidence alone, so the catalogue is censored on the tested variable. Add that space-based astrometry (1.3% of observations; NEOWISE, TESS and others) is placed at the geocentre in this pipeline.
- Section 5 validation: add a short-arc check (an independent implementation agrees to 0.6% on 16 objects) and the comparison with Seligman et al. 2024's published sigma(A1) for five multi-apparition objects (forecast/published 0.26-1.42); quote the 'sigma x 2' variant as the systematic for long arcs.
- Section 4.4 and census class names: state that the A2 of 2016 TA56 was fitted by JPL (D. Farnocchia, 2026-06-17) and that its orbit is comet-like (Tisserand parameter about 2.7); rename the class from 'no published explanation' to 'unpublished outgassing candidate'. Add (428209) 2006 VC (7 times the nominal Yarkovsky maximum) and 2019 EF3 (rms 1.5 on a 6-year linkage of a metre-class object) to the follow-up list.
- Section 4.4, 2005 VL1 and 1998 KY26 rows: say the 4.2 and 8.5 sigma tensions hold only for a permanently Sun-facing 10 m2 panel with C_R = 1; for Hibberd et al.'s own effective area (about 4.5 m2) the radial tension is about 3 sigma.
- Section 4.1 and headline: replace '576 have a natural or already-published classification' by '552 are not excluded as Yarkovsky (4 of them exceed the nominal maximum at 3 sigma)'.
- Section 7: cite Fenucci et al. 2024 (A&A 682, A29) as the closest prior work for the automated Yarkovsky-consistency census, and describe the census as a reproduction with newer data.
- Robustness table: add the raw analysed counts next to the weighted N (3,292 and 7,291 at A/m>=1 for the two larger bins) and a strict variant requiring that JPL used all the MPC astrometry (N falls by 25-50%). Correct 'median 1-10 m NEO sensitive only to A/m >= 2.3' (2.2 over analysed objects; 3.7 over the catalogue).