Where is everybody? · Working papers
Cold objects crossing in front of stars
Revised after a second, separate analysis run for this project tried to break it. Neither analysis is an outside expert.
Occultation limits cold enclosed stars to a few percent along bulge sightlines
Summary. A search of the public OGLE-II bulge difference-image light curves (221,801 catalogued light curves, drawn from 6.37 million monitored stars with I < 18, 1997-2000), calibrated by injection into catalogue light curves, finds no star that vanishes once, totally and sharply. If every star along these sightlines sat inside an opaque 10 au sphere, 130 (conservative efficiency) to 480 (optimistic) such events would have passed the cuts. The 95% upper limit on the enclosed fraction of stars, f, is therefore about 0.02 (conservative; 0.006 optimistic) at R = 10 au, about 0.003 (0.0007) at 100 au, 0.2 (0.04) at 3 au, and nothing below 2 au. If all main-sequence stars are enclosed at one temperature the limit is 0.01 at 30 K, 0.03 at 50 K, 0.3 at 100 K and none at 150 K or warmer. These numbers are good to one significant figure, and carry a further systematic of about a factor of 2. Main caveats:
- The search covers the objects a 2002 pipeline catalogued as candidate variables, not every star. Inclusion is measured on eclipsing binaries (79%), not by injection into images.
- The sightlines cross the inner Galaxy; this is not a local measurement.
- Only opaque, sharp-edged spheres larger than about 3 au are constrained.
- For R of 100 au or more, most detections would be events already in progress when the survey began. Counting only events whose ingress falls inside the survey weakens those limits by a factor of about 3.
- The first version of this search was blind to the signal because of a loader defect found by the referee. The null was re-established after the repair (section "The loader defect").
Question
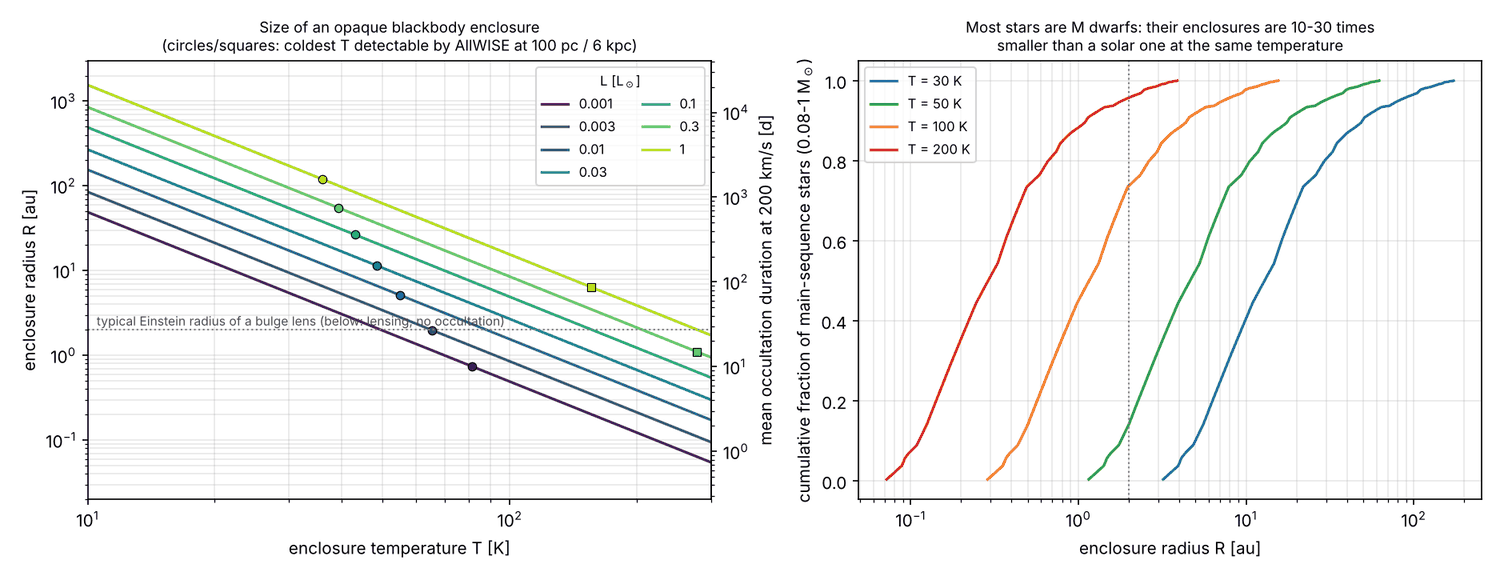
A star wholly enclosed by an opaque shell that re-radiates its luminosity at temperature T has radius R = sqrt(L/Lsun) x (393.6 K / T)^2 au. Cold shells are large, escape WISE, and gravity alone still allows 42% of local stellar mass to be dark (study dark_companions). A sphere larger than its own Einstein radius cannot microlens; it blots out background stars instead. How many such total occultations should existing surveys contain, how many have they recorded, and what limit on f follows?
One premise of the study plan is wrong: a 1 Lsun enclosure at 30 K has R = 172 au (344 au across), not 9 au.
Data
| Data set | Use |
|---|---|
| OGLE-II bulge difference-image (DIA) catalogue of candidate variables, Wozniak et al. 2002: 221,801 light curves, 49 fields, 1997-2000 | the search |
| OGLE-II DIA reference-image subframes (header template frame) | check of the reference-epoch reconstruction |
| OGLE-II VI maps, Udalski et al. 2002: 30.5 million stars, 6.37 million with I < 18 | number of monitored stars |
| OGLE Collection of Variable Stars, bulge eclipsing binaries (Soszynski et al. 2016) | catalogue-inclusion test |
| Mroz et al. 2019 (VizieR J/ApJS/244/29): OGLE-IV microlensing rates, star counts | rate normalisation, forecasts |
| Gaia DR3; Gaia Science Alerts index (27,076 alerts); SIMBAD | artefact test, identifications, alert census |
| Mamajek dwarf sequence | mass-luminosity relation |
| Paper texts (listed under prior work) | selection functions |
Method
- Signal. R(L, T), folded over a Kroupa present-day mass function (0.08-1 Msun).
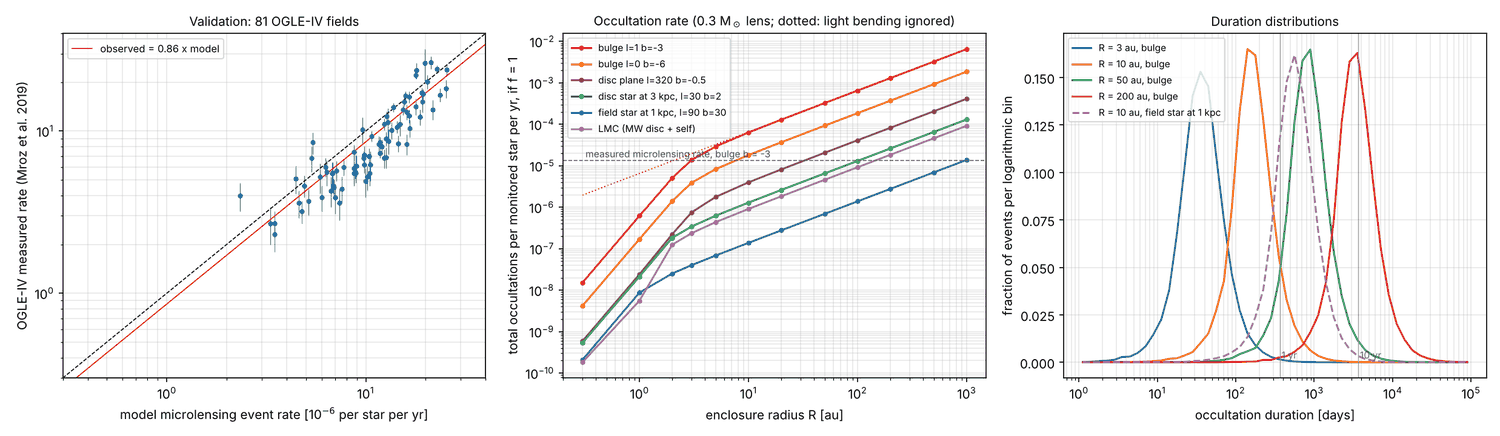
- Rates. A standard microlensing Galactic model (double-exponential disc, Dwek G2 bar), sampled by Monte Carlo over source-occulter pairs. Light bending is included: the star vanishes only when both images are covered, so R_eff = R - r_E^2/R, and zero if R < r_E. The same code reproduces the OGLE-IV microlensing event rate in 81 fields with observed/model = 0.86 (16-84%: 0.62-0.98); that ratio normalises the rates.
- Search record. For each published search: would a star that vanishes completely, once, be recorded and kept?
- New search. OGLE-II DIA photometry measures flux at a fixed position, so a vanished star is still measured. Total flux = reference + difference flux; "low" means below 50% of the bright level (85th percentile). A point is used if quality flags 1-11 are clear and the flux is not the error code -99.0. Cuts C1-C7 are in the cut-flow table.
- Efficiency.
- Total occultations are subtracted from the raw fluxes of 1,000 quiet catalogue stars (14 durations x 6 epochs). The quality mask is rebuilt with the same function as for real data. An event counts if it passes C1-C7 and an emulation of the pipeline's variable finder (Wozniak 2000).
- The star must be in the reference image. The frames stacked into each field's reference image were reconstructed by non-negative least squares (the stack-weighted mean difference flux of every variable is zero). The occulted star's reference magnitude must be brighter than 18.5 (conservative) or 19.5 (optimistic).
- Catalogue inclusion is measured on independent eclipsing binaries.
- Blending (Monte Carlo), foreground stars (colour cut) and rate normalisation enter in conservative and optimistic versions.
- Limits. Expected events N = f x sum over fields and magnitude bins of (stars x efficiencies x rate x effective exposure). With zero events, f < 3.0/N at 95%.
code/run_all.py reruns everything from the public
archives (2.9 GB download, then about 10-15 minutes). It stops if an
occultation injected into an I = 16 star is not recovered through the
real load path, or if the 1998 fade of Terz V 2637 is missing.
Results
The signal
| R [au] | 10 K | 30 K | 50 K | 100 K | 300 K |
|---|---|---|---|---|---|
| L = 0.001 Lsun | 49 | 5.4 | 2.0 | 0.49 | 0.05 |
| 0.01 | 155 | 17 | 6.2 | 1.5 | 0.17 |
| 0.1 | 490 | 54 | 20 | 4.9 | 0.54 |
| 1 | 1549 | 172 | 62 | 15 | 1.7 |
Most stars are M dwarfs, so the median enclosure is 13 au at 30 K, 4.6 au at 50 K and 1.2 au at 100 K. At 100 K only 17% of stars have R > 3 au; the rest sit inside their Einstein radius (about 2 au for a bulge lens) and lens instead of occulting.
Occultation of a monitored star, for f = 1 and R = 10 au:
| Sightline | Rate [per star per yr] | Optical depth | Duration, median (10-90%) |
|---|---|---|---|
| Bulge, l = 1, b = -3 | 6.4e-5 | 3.5e-5 | 161 d (76-356) |
| Bulge, l = 0, b = -6 | 1.8e-5 | 1.1e-5 | 160 d (75-376) |
| Galactic plane, l = 320 | 4.0e-6 | 6.9e-6 | 506 d (231-1,130) |
| Field star at 1 kpc, b = 30 | 1.4e-7 | 2.6e-7 | 556 d (254-1,220) |
| LMC | 9.1e-7 | - | about 560 d |
Rate and duration scale as R. Below about 5 au light bending cuts the bulge rate (by 1.4 at 3 au, 10 at 1 au). The event is flat-bottomed, achromatic, single and total down to the blend level. Ingress lasts from 2 hours (dwarf source) to 4 days (50 Rsun giant) at 200 km/s (fig1, fig2).
What has been searched
| Search | Stars | Records a vanished star? | Total, single, achromatic disappearances |
|---|---|---|---|
| Bramante, Diamond & Kim 2025 (EROS-2, OGLE) | proposal and forecast | - | not searched; efficiency set to 1 |
| MACHO, Drake & Cook 2003 | 3.3e7 bulge, 1.5e7 Clouds | probably | at most 83 bulge leftovers, unvetted; final cut demands dust reddening |
| 2MASS calibration fields, Quillen et al. 2014 | over 4e4 | not stated | 0 (no dimming over 0.2 mag lasting over a day among quiescent stars) |
| VVV, Smith 2021, Lucas 2024 | about 3e8 | no (detection-based) | 1 by luck (VVV-WIT-11) |
| ASAS-SN, JoHantgen 2025 | 5.1e6 | yes | 0 |
| ZTF, Tzanidakis 2025 | 6.3e7 | no | none reported |
| Gaia alerts | all sky | no | none identifiable |
| OGLE-III/IV | 5.4e7 (I < 18) | yes | never searched |
| VASCO, Villarroel 2020, Solano 2022 | 6e8 | only in empty fields | none confirmed |
| OGLE-II, this work | 6.37e6 monitored; 221,801 catalogued | yes (Terz V 2637 recorded at zero flux) | 0 |
Detection-based catalogues store a vanished star as a gap. Smith et al. say VVV-WIT-11 "would not ordinarily have been selected ... were it not for a handful of mismatches" with a neighbour. Gaia17bpp entered the alert stream only on its way back up. Of the 12,483 Gaia alerts that have a historic magnitude, 99 are fadings deeper than 2 mag (21 deeper than 3); keywords attribute 84 to known variable classes.
The OGLE-II search
| Cut | Why | Light curves left |
|---|---|---|
| All catalogue light curves | 221,801 | |
| C1: at least 3 low points, bright state I < 18 | a zero must stand well clear of the noise | 6,078 |
| C2: centroid within 1.5 px of a reference-image star | the flux belongs to a known star | 4,779 |
| C3: at least 5 consecutive low points over at least 3 d, 3 of them in 1997-1999 | rejects bad nights; the variable finder used 1997-1999 | 1,959 |
| C4: single episode (at most 2% of points low elsewhere, at most 60% low) | rejects repeating variables | 130 |
| C5: ingress or egress caught within a season (gap under 30 d, bright side above 75%) | sharp edge; rejects steps hidden in seasonal gaps | 10 |
| C6: scatter outside the event below max(5%, 2.5 sigma) | rejects variables | 0 |
| C7: scatter inside below max(7%, 2.5 sigma) | flat bottom | 0 |
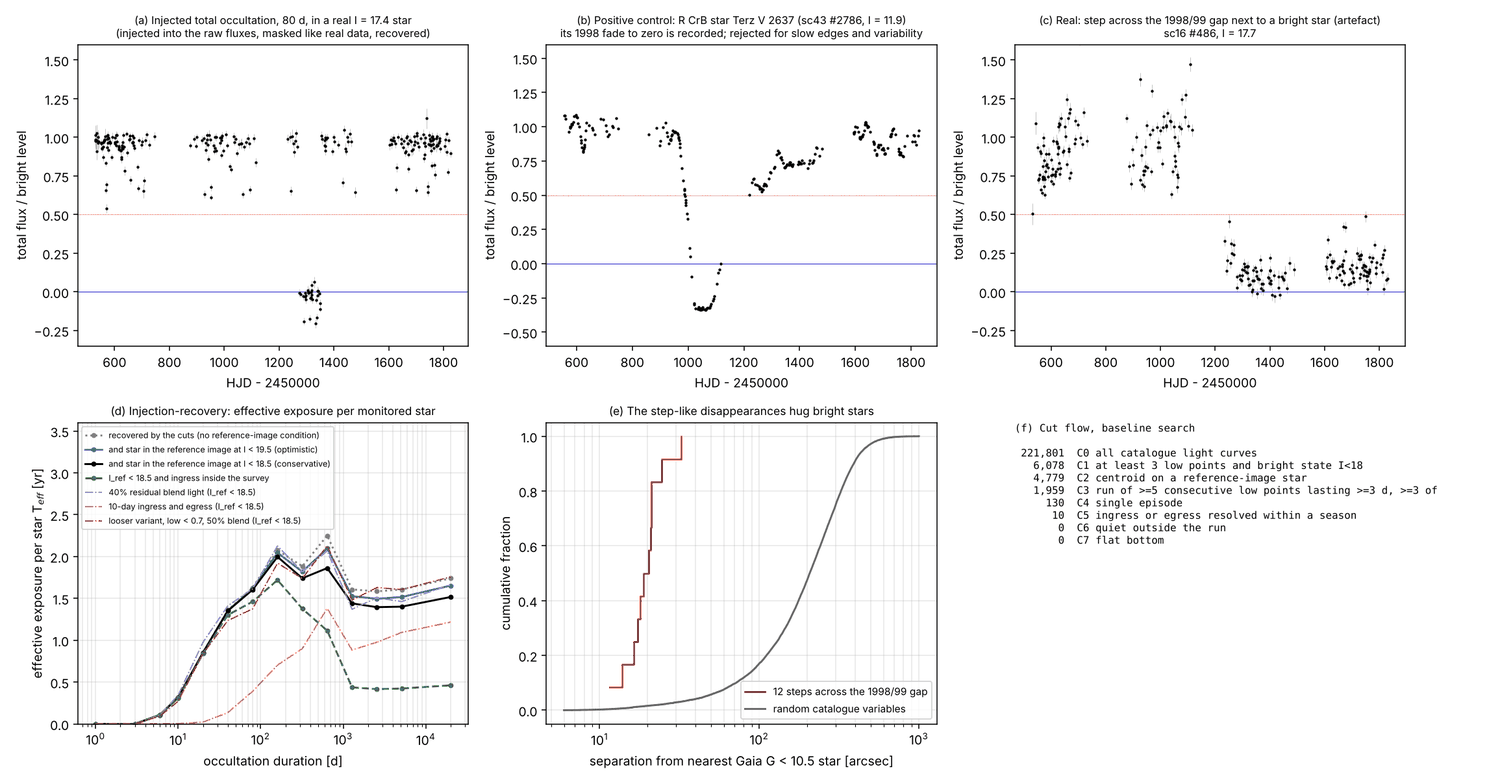
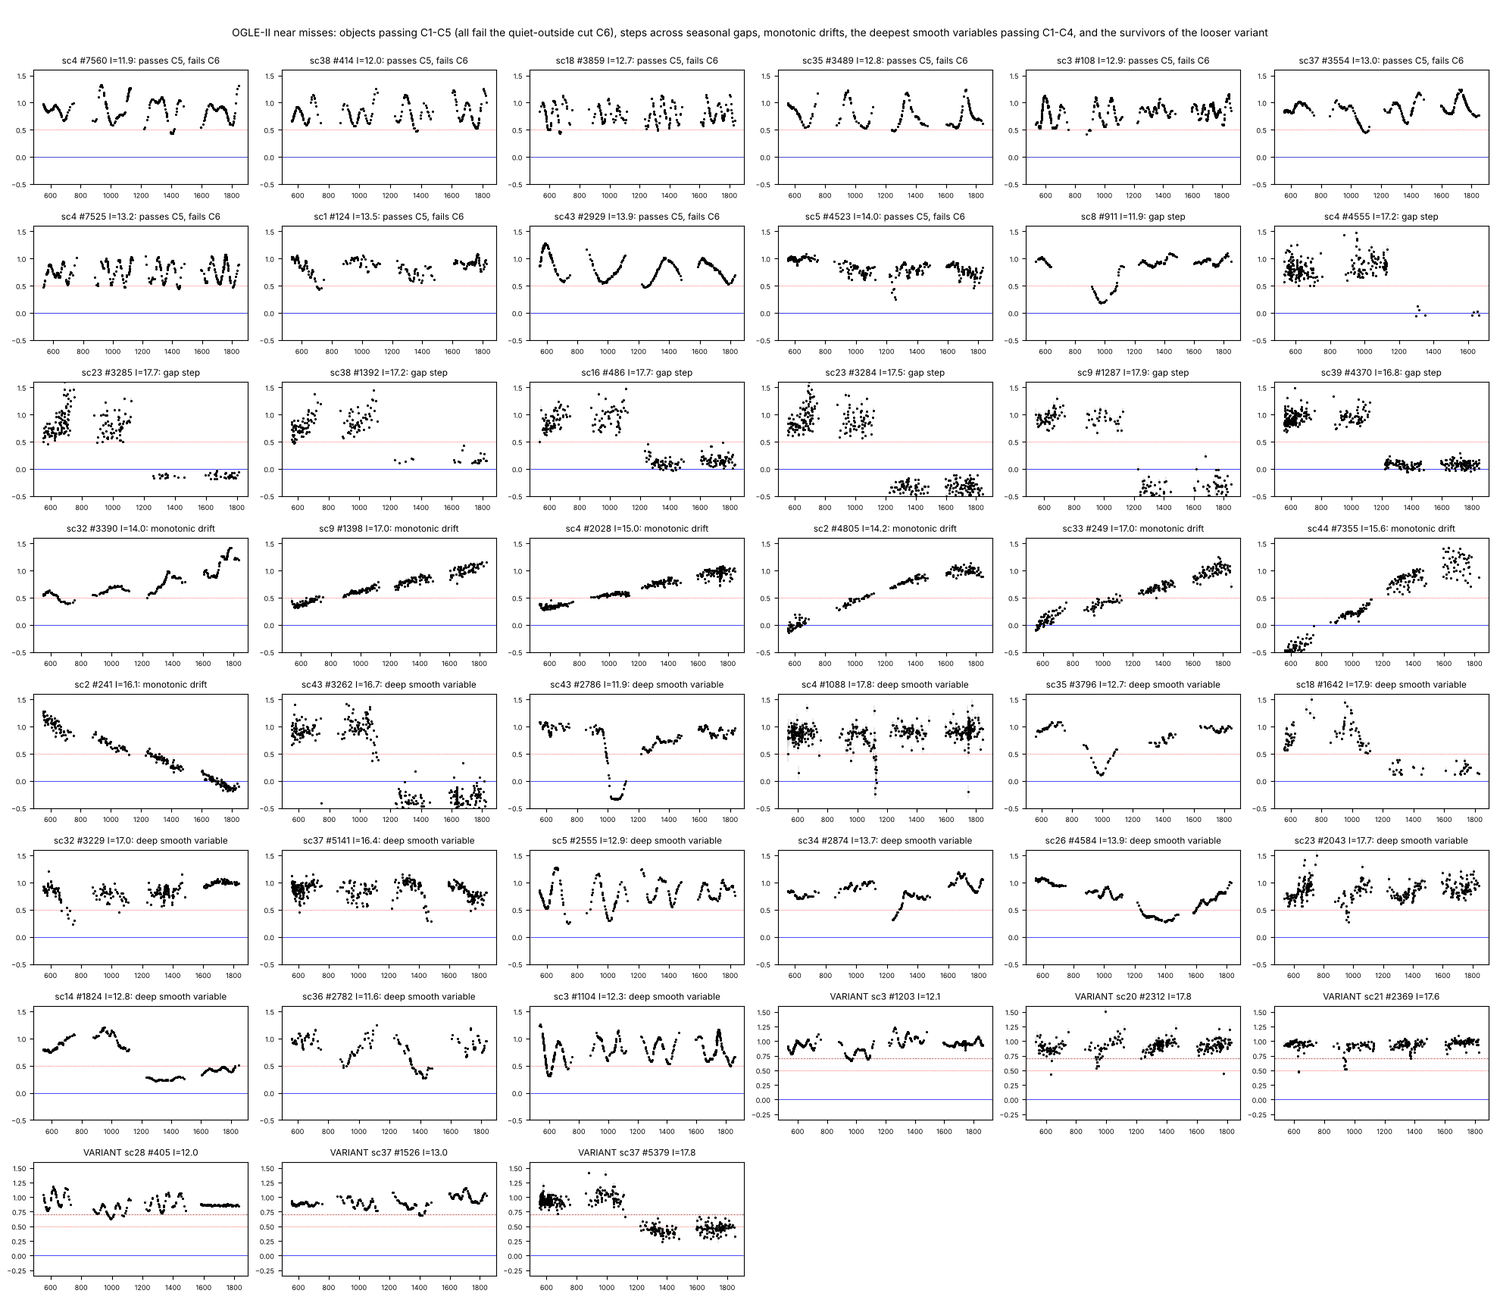
No light curve passes (fig3, fig5).
- The 10 that pass C5 are bright (I = 11.9-14.0), with minima at 0.38-0.49 of the bright level and scatter outside the dip of 0.08-0.23. Nine are catalogued OGLE long-period variables and one is a 2MASS young-star candidate. All fail C6 by a wide margin.
- The 130 that pass C4 are 115 smooth variables, 7 monotonic drifts and 8 with an edge in a seasonal gap. Six of the drifts have a Gaia star moving 56-220 mas/yr within 4 arcsec (a star leaving its template position); the seventh is a long-period variable.
- Deep dimmers the corrected data reveal:
- Terz V 2637 (sc43 #2786, I = 11.9), a known R CrB star. Its 1998 fade is recorded as 40 consecutive points over 129 d at a median of -0.31 of the bright level. It fails C5 (the decline takes weeks), C6 and C7. It is the positive control: a real star going to zero is in the catalogue and is seen by the search.
- OGLE BLG-LPV-196232 (sc35 #3796, I = 12.7): V-shaped dip to 0.11. Fails C5, C6, C7.
- V3811 Sgr (sc8 #911, I = 11.9): U-shaped dip to 0.19 whose ingress falls in a seasonal gap. Fails C5, C6, C7.
- Faint single dips that pass C4 (sc4 #1088, sc37 #5141, sc32 #3229, sc23 #2043; I = 16.4-17.8) have gradual or ragged edges and fail C5 and C6 or C7. Three lie within 3 arcsec of a catalogued long-period variable. sc4 #1088 dips on the last nights of the 1998 season together with two other objects in its field.
- Steps across the 1998/99 gap. Twelve catalogue objects drop to near zero between those seasons. All lie within 32 arcsec of a Gaia G < 10.5 star (median 19.5 arcsec), against 7.6% of random variables within 60 arcsec (KS p = 1.6e-18). They are artefacts of bright-star spikes. They also show that sustained losses of I = 17-18 flux do enter the catalogue.
- sc23 #4377 (269.540, -30.829) declines through 1997 from 1.4 to 0.4 of its bright level and then sits flat at 0.25 for three seasons. That fits an eclipse by a large body or the decay of an outburst onto a quiescent level equally well. It fails C4 (68% of points low) and I found no SIMBAD entry.
Efficiency
Effective exposure per star, in years (84,000 injections; 19,743 pass the cuts; 5 of those fail the emulated variable finder):
| Duration | 10 d | 40 d | 160 d | 640 d | 7 yr | 55 yr |
|---|---|---|---|---|---|---|
| Recovered by the cuts | 0.32 | 1.36 | 2.08 | 2.25 | 1.58 | 1.74 |
| and star in reference image, I_ref < 19.5 (optimistic) | 0.32 | 1.35 | 2.05 | 2.10 | 1.50 | 1.65 |
| and I_ref < 18.5 (conservative) | 0.32 | 1.35 | 2.00 | 1.86 | 1.39 | 1.52 |
| and ingress inside the survey | 0.31 | 1.30 | 1.72 | 1.11 | 0.42 | 0.46 |
Nothing shorter than 3 d is recovered. The reconstructed reference images use a median of 20 frames per field, with mean weight 0.28 in 1997, 0.13 in 1998 and 0.60 in 1999. The frame named in each published reference-image header is recovered in 49 of 49 fields.
Catalogue inclusion, measured. The OGLE Collection of Variable Stars lists eclipsing binaries found by period searches, independently of the DIA catalogue. Of 1,296 binaries with an OGLE-II and an OGLE-IV identifier, I < 18 and a primary eclipse deeper than 0.75 mag (below half light), 79% are in the DIA catalogue and pass C2. Chance matches are 0.6%.
| I magnitude | under 15 | 15-16 | 16-17 | 17-17.5 | 17.5-18 |
|---|---|---|---|---|---|
| Deep eclipsing binaries | 58 | 73 | 338 | 373 | 454 |
| In catalogue and pass C2 | 0.93 | 0.75 | 0.83 | 0.81 | 0.74 |
An eclipse puts a few percent of scattered points below half light; an occultation puts five or more consecutive points at zero. I therefore treat these fractions as a floor for occultations, but that is an argument, not a measurement.
| Efficiency factor | Conservative | Optimistic | Basis |
|---|---|---|---|
| In the catalogue and passes centroid cut | 0.54-0.79 by magnitude | 0.74-0.93 | eclipsing binaries; conservative takes the smaller of (measured minus 2 sigma) and the microlensing-based value (174 of 214 events, Wozniak et al. 2001) |
| One star supplies at least 60% of the flux | 0.44 | 0.88 | blending Monte Carlo, merge radius 1.3 or 0.65 arcsec |
| Not a foreground disc star | 0.73 | 1 | stars bluer than the clump by 0.4 mag |
| Rate normalisation | 0.62 | 0.86 | OGLE-IV microlensing, 16th percentile or mean |
| Exposure table | I_ref < 18.5; 4-day ingress for I < 15 | I_ref < 19.5 | injections |
| Overall, R = 10 au | 0.16 | 0.61 |
Limits
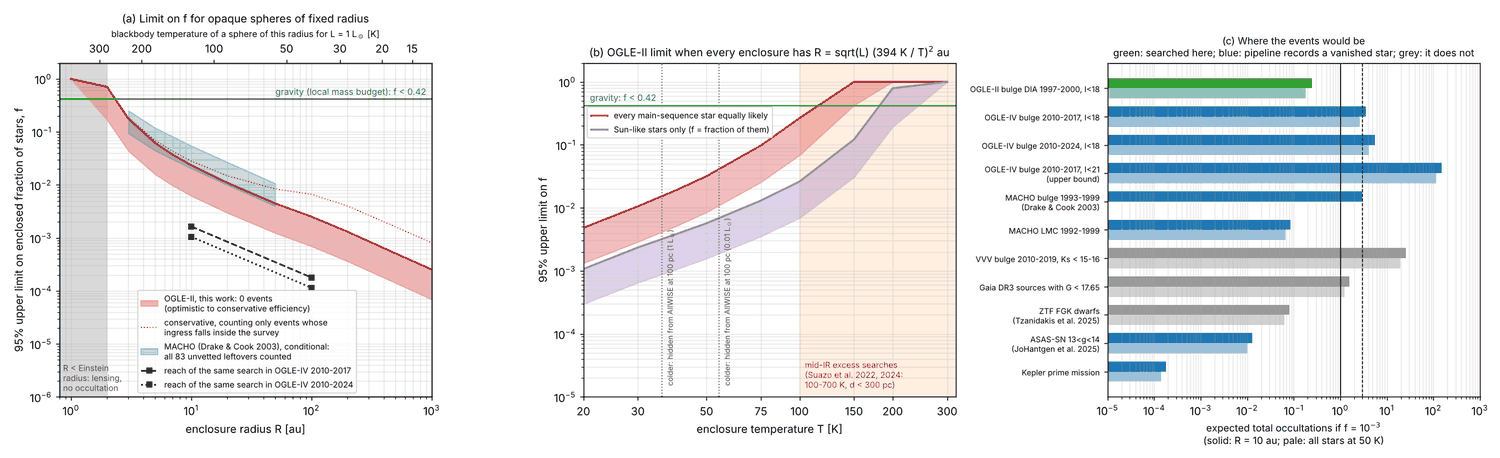
Limits are 95% upper limits on f, rounded to one significant figure. "Ingress only" is the conservative case restricted to events that begin inside the survey.
| Enclosure | Events expected if f = 1 | Conservative | Optimistic | Ingress only |
|---|---|---|---|---|
| R = 3 au | 17-68 | 0.2 | 0.04 | 0.2 |
| R = 5 au | 48-190 | 0.06 | 0.02 | 0.07 |
| R = 10 au | 130-480 | 0.02 | 0.006 | 0.03 |
| R = 20 au | 270-1,000 | 0.01 | 0.003 | 0.01 |
| R = 50 au | 670-2,400 | 0.004 | 0.001 | 0.008 |
| R = 100 au | 1,200-4,300 | 0.003 | 0.0007 | 0.007 |
| R = 1,000 au | 12,000-43,000 | 0.0003 | 0.00007 | 0.0008 |
| All stars at 30 K | 280-1,000 | 0.01 | 0.003 | 0.02 |
| All stars at 50 K | 94-350 | 0.03 | 0.008 | 0.04 |
| All stars at 75 K | 31-120 | 0.1 | 0.03 | 0.1 |
| All stars at 100 K | 11-44 | 0.3 | 0.07 | 0.3 |
| All stars at 150 K or warmer | under 7 | none | 0.4 | none |
| Sun-like only, 30 K | 1,300-4,600 | 0.002 | 0.0006 | 0.006 |
| Sun-like only, 100 K | 110-430 | 0.03 | 0.007 | 0.03 |
| Sun-like only, 150 K | 25-98 | 0.1 | 0.03 | 0.1 |
For "Sun-like only", f is the fraction of 0.7-1 Msun stars (6% of all). Spheres under 2 au and enclosures warmer than about 200 K are unconstrained (fig4). On top of the conservative-optimistic bracket, which is dominated by the modelled blending factor, I attach a systematic of about a factor of 2: the conservative case is not a strict bound.
MACHO, re-read (order of magnitude only). Drake & Cook expected 1e5 detections for a cloud model whose event rate my model puts 30-80 times above that of 7 au enclosures at f = 1. Counting all 83 of their bulge leftovers as candidates gives f < 0.03-0.08 at 7 au. That scaling is uncertain by a factor of several. Their one named candidate, MACHO 120.21786.958 (a drop of more than 3.5 mag), passed their reddening test, so it is chromatic and not an opaque sphere.
Forecasts (events at f = 1e-3; order of magnitude outside OGLE-II):
| Data set | R = 10 au | Sun-like at 30 K |
|---|---|---|
| OGLE-II (searched here) | 0.25 | 2.4 |
| OGLE-IV 2010-2017, I < 18 | 3.5 | 35 |
| OGLE-IV 2010-2024, I < 18 | 5.5 | 54 |
| OGLE-IV, all I < 21 sources (upper bound) | 150 | 1,600 |
| MACHO bulge | 3 | - |
| VVV bulge (if forced photometry existed) | 26 | 280 |
| Gaia, G < 17.65 (missing transits) | 1.6 | 17 |
| ZTF / ASAS-SN / Kepler | 0.08 / 0.01 / 0.0002 | 0.9 / 0.1 / 0.002 |
The same search on OGLE-IV (2010-2024, conservative efficiency) would reach f of about 1e-3 at 10 au and 1e-4 at 100 au.
The loader defect
The first version kept a photometric point only if its difference flux exceeded -90 counts. The error code is exactly -99.0, and valid fluxes of a vanished I < 18 star are routinely far below -90. The search therefore discarded the signal it was looking for, and its null was vacuous. The injection test did not catch this because it reused the mask computed before injection. The referee found both problems.
After the repair:
- With the old mask, 0 of 20 injected I = 16 events are recoverable; with the corrected mask, 19 of 20, and none of their 654 in-event points is lost.
- In the full injection, 6,870,578 in-event points exist before masking and the same number after.
- Terz V 2637 shows 40 low points; with the old mask it showed none.
- In real sustained faint states, quality flags are set less often than elsewhere (error codes 5.9% against 9.4% of epochs), so the pipeline does not flag away faint states.
Robustness checks
- Stars with I < 17 only (2.9 million): R = 10 au limit 0.03 / 0.01.
- Looser search (drop of 30% or more): 6 survivors. Three are catalogued OGLE long-period variables grazing the threshold; two dip on the same nights in adjacent fields; one is a bright-star step. Counting all six as real gives 0.08 / 0.02 at 10 au.
- No reference-image condition: limits tighten by 9-13%.
- First-version inclusion factors instead of the eclipsing-binary ones: limits change by under 5%.
- A 4-day ingress and egress for every source lowers expected events by 0.44 (3 au), 0.70 (10 au), 0.87 (100 au); a 10-day ingress by 0.14, 0.37, 0.65. Applied to the I < 15 bin alone (8% of stars), as in the conservative case, the 4-day loss costs 3-4%.
- Residual blend light of 30-40% in the injections: under 10%.
- Ignoring light bending: +64% at 3 au, +3% at 10 au. A 1 Msun lens: a factor 0.33 at 3 au, 0.93 at 10 au.
- Sources weighted to the far side +22%; bar-only sources +5%; new random seed under 1%.
- The referee's independent rate, scaled from measured OGLE-IV microlensing rates without my Galactic model, agrees (5.6e-5 per star per yr field-averaged in both).
- Model against Smith et al. 2021 at VVV-WIT-08: 1.1e-6 against their 0.8e-6 per star per yr.
Limitations
- Bulge sightlines (inner disc and bar, 4-8 kpc), not the solar neighbourhood.
- Opaque, sharp-edged spheres only. Partial swarms, fuzzy edges and anything under about 3 au are not constrained.
- No injection into images. Inclusion rests on eclipsing binaries (periodic, so the finder gets many chances; only 34 have periods above 10 d, of which 19 are catalogued), on an emulated variable finder, and on the fading objects the catalogue demonstrably contains.
- Blending (0.44-0.88) is a Monte Carlo with an extrapolated luminosity function.
- For R of 50 au and above, most exposure is from events in progress at survey start; see the ingress-only column.
- Red-clump sources (I of 15-16, ingress about a day) are treated as instantaneous.
- Four seasons; star counts not corrected for field overlaps (a few percent); parallax ignored.
- Near misses were classified from light curves, Gaia and SIMBAD; none was followed up.
- The MACHO re-reading and the forecasts for other surveys are order-of-magnitude.
- Literature search limited to arXiv, web queries and the papers listed.
Closest prior work and what is new
The idea is not new. Bramante, Diamond & Kim (2025, Phys. Rev. Lett. 134, 141001; arXiv:2409.08322) proposed exactly this test: dark objects larger than their Einstein radius dimming background stars in EROS-2 and OGLE data, with the rate formalism in which the physical radius replaces the Einstein radius. They forecast dark-matter constraints assuming a future null result and unit efficiency, and did not search. Kerins, Binney & Silk (2002) predicted the same for cold clouds, and Drake & Cook (2003) searched MACHO for them with injected events. Smith et al. (2021) computed chance-occultation rates for 0.5 au dark bodies and found VVV-WIT-08. Quillen et al. (2014, arXiv:1402.1198) searched over 40,000 stars in the 2MASS calibration fields for transient obscuration. Lucas et al. (2024), JoHantgen et al. (2025) and Tzanidakis et al. (2025) search for dippers, not for total single disappearances. Megastructure work uses transits of the host star (Arnold 2005; Wright et al. 2016), optical dimming (Zackrisson et al. 2018), waste heat (Carrigan 2009; Griffith et al. 2015; Suazo et al. 2022, 2024) or two-epoch vanishing (Villarroel et al. 2020; Solano et al. 2022). The sibling study dark_companions forecast an event count; it did not originate the test.
New here:
- The executed search: to my knowledge the first search of a forced-photometry bulge survey for total, single, sharp-edged disappearances, with an efficiency from end-to-end injection into catalogue light curves, a reconstruction of the reference-image epochs, and catalogue inclusion measured on independent eclipsing binaries.
- The application to enclosed stars: limits on f against radius and blackbody temperature, including the light-bending cut-off.
- The audit of which pipelines can record a vanished star, and forecasts per data set.
Implications for the Fermi Paradox
One figure for an integrator: along inner-Galaxy sightlines, fewer than about 2% of stars (95%, conservative) can be inside opaque, sharp-edged enclosures of 10 au or more, with a further systematic of about a factor of 2, against 42% from the mass budget. It is not a local measurement and it says nothing useful below about 3 au (warmer than about 150 K for Sun-like stars, 75 K for M dwarfs). For 100 au or more the limit is a few tenths of a percent, or just under 1% if only ingress events are trusted. Two percent of the Galaxy is still of order 1e9 stars, so this bounds prevalence, not existence. The archives that would reach f of 1e-3 to 1e-4 (OGLE-III/IV, forced photometry at VVV positions) exist and have not been searched for disappearances.
Figures
Response to referee
Errors
- Loader mask deletes the signal (fatal). Agreed and fixed.
One function,
quality_mask(flags 1-11 clear, flux not equal to -99.0), now serves real and injected data. Everything was rerun. The cut flow matches the referee's corrected run exactly; zero candidates. - Injection not end-to-end. Fixed: events go into the raw arrays and the mask is rebuilt. Two regression assertions were added (injected I = 16 event; Terz V 2637 decline). Terz V 2637 is fig3b.
- Inventory of what the data contain was wrong. Rewritten: 130 pass C4 (115 / 7 / 8), 10 pass C5 and fail C6, deep dimmers named with reasons, 12 gap steps within 32 arcsec, 6 variant survivors (sc44 #6877 and sc18 #807 no longer appear).
- Bramante, Diamond & Kim missing. Cited and credited for the idea and formalism; Quillen et al. 2014 cited. Novelty narrowed to the executed search and the megastructure application. The claim that the sibling study originated the idea is withdrawn.
- Efficiency only at catalogue level. Wording changed throughout. Beyond the evidence the referee listed, I added a measurement: 79% of 1,296 independent deep eclipsing binaries are in the catalogue and pass C2. I also added an emulated variable finder and a check that quality flags are not set preferentially in faint states. The factor-of-2 systematic is attached as requested, because none of this is image-level injection.
- Egress-only exposure. I took the first option: reference-image epochs were reconstructed and the star is required to be in the reference image (cost 9-13% for long events). I also report the ingress-only alternative. It weakens the R of 100 au and above and Sun-like 30 K limits by 2.6-3.2, more than the "up to 2" the referee anticipated.
- sc23 #4377. Described neutrally; the eclipse label is dropped.
- Gaia alerts denominator. Now "99 of the 12,483 alerts that have a historic magnitude".
- MACHO. The named candidate is mentioned, the limit is labelled order-of-magnitude, and the "vetted to zero" hypothetical is removed.
- Instantaneous ingress. Measured with 4-day and 10-day ramps. Per source the effect is large (a 4-day ingress halves the exposure for events of 80 d or less). On the totals it is 3-4%, as the referee expected, because only 8% of sources are bright giants. The loss is applied to I < 15 in the conservative case.
Overclaims. The title is softened. Limits are given to one significant figure with the systematic. The R of 100 au and above limits carry the ingress-only alternative beside them. The integrator gets a single qualified figure.
Numbers that differ from the referee's corrected-mask rerun. Expected events at 10 au are 127-482 (referee: 145-500) and the limit is 0.024 / 0.0062 (0.021 / 0.0060). The difference comes from the reference-image condition, the giant-ingress loss and the measured inclusion, all added in this revision. The variant limit is 0.076 / 0.025 (0.073 / 0.024). I measure the minimum of OGLE BLG-LPV-196232 at 0.11, not 0.13.
Points rejected. None in substance.
Code entry point: code/run_all.py
Key numbers
| Quantity | Value | Uncertainty | Note |
|---|---|---|---|
| Candidates for a total, single, sharp-edged occultation in OGLE-II (corrected loader) | 0 | cut flow 221,801 -> 6,078 -> 4,779 -> 1,959 -> 130 -> 10 -> 0 -> 0 | 130 pass C1-C4 (115 smooth variables, 7 drifts, 8 steps across a seasonal gap); 10 pass C5 and all fail the quiet-outside cut C6 (I = 11.9-14.0 long-period variables, minima 0.38-0.49 of the bright level, outside scatter 0.08-0.23) |
| 95% upper limit on enclosed fraction f, R = 10 au | about 0.02 conservative; 0.006 optimistic | unrounded 0.024 / 0.0062; further systematic of about a factor of 2 (no image-level injection) | Expected events if f = 1: 130-480 (790 before efficiency factors). Ingress-only exposure: 0.03. Stars with I < 17 only: 0.03 / 0.01 |
| 95% upper limit on f, R = 100 au | about 0.003 conservative; 0.0007 optimistic | 0.007 if only events whose ingress falls inside the survey are counted; factor-2 systematic on top | R = 3 au: 0.2 / 0.04; R = 5 au: 0.06 / 0.02; R = 1,000 au: 3e-4 / 7e-5 (ingress-only 8e-4); no constraint below 2 au |
| 95% upper limit on f if every main-sequence star is equally likely to be enclosed at temperature T | 30 K: 0.01; 50 K: 0.03; 75 K: 0.1; 100 K: 0.3; 150 K and warmer: none (conservative) | optimistic: 0.003, 0.008, 0.03, 0.07, 0.4; ingress-only conservative: 0.02, 0.04, 0.1, 0.3 | R = sqrt(L)(393.6 K/T)^2 au folded over a Kroupa 0.08-1 Msun mass function |
| 95% upper limit on the fraction of Sun-like (0.7-1 Msun) stars enclosed at T | 30 K: 0.002; 50 K: 0.006; 100 K: 0.03; 150 K: 0.1; 200 K: 0.8 (conservative) | optimistic: 0.0006, 0.002, 0.007, 0.03, 0.2; ingress-only at 30 K: 0.006 | Sun-like stars are 6% of main-sequence stars |
| Effective exposure per star from end-to-end injection (star required to be in the reference image at I_ref < 18.5) | 0 below 3 d; 0.32 yr at 10 d; 1.35 yr at 40 d; 2.0 yr at 160 d; 1.4-1.5 yr from 3.5 to 55 yr | 1,000 hosts x 14 durations x 6 epochs = 84,000 injections; ingress-only: 1.7 yr at 160 d, 0.4-0.5 yr beyond 3.5 yr | 4-day ingress and egress halves it at 80 d or less; 10-day ingress is severe |
| Catalogue inclusion measured on independent deep (> 0.75 mag) eclipsing binaries with I < 18 | 79% in the DIA catalogue and passing the centroid cut (1,296 binaries) | by magnitude bin 0.93, 0.75, 0.83, 0.81, 0.74 (n = 58, 73, 338, 373, 454); chance matches 0.6% | OGLE Collection of Variable Stars binaries with OGLE-II and OGLE-IV identifiers; periods above 10 d: 19 of 34 |
| Overall detection efficiency beyond effective exposure, R = 10 au | 0.16 conservative; 0.61 optimistic | dominated by the modelled blending factor (0.44-0.88) | Inclusion and centroid 0.54-0.79 or 0.74-0.93 by magnitude; foreground 0.73 or 1; rate normalisation 0.62 or 0.86 |
| Loader defect of the first version | 0 of 20 injected I = 16 events recoverable with the old mask; 19 of 20 with the corrected one | 654 in-event points, 0 lost to the corrected mask; 6,870,578 in-event points in the baseline injection, none lost | Old mask kept a point only if difference flux > -90 counts; error code is exactly -99.0 |
| Positive control: R CrB star Terz V 2637 (sc43 #2786, I = 11.9) | 40 consecutive low points over 129 d from HJD 2450988.6, median flux -0.31 of the bright level | 0 low points visible with the defective mask | Passes C1-C4; fails C5-C7 (slow edges, variable outside, not flat) |
| Step-like disappearances across the 1998/99 gap | 12, all within 32 arcsec of a Gaia G < 10.5 star (median 19.5 arcsec) | control: 7.6% of random variables within 60 arcsec; KS p = 1.6e-18 | Instrumental artefacts; they also show that sustained losses of I = 17-18 flux are catalogued |
| Looser variant (drop of 30% or more) | 6 survivors; counting all as real gives f < 0.08 / 0.02 at R = 10 au | cut flow 16,346 -> 14,227 -> 4,715 -> 854 -> 369 -> 8 -> 6 | 3 catalogued OGLE long-period variables grazing the threshold, 2 same-night dips in adjacent fields, 1 bright-star step |
| Reference-image epochs reconstructed from the difference fluxes | median 20 frames per field; mean weight by season 0.28 (1997), 0.13 (1998), 0.60 (1999) | header template frame recovered in 49 of 49 fields (weight 0.03-0.07) | Used to require that an occulted star is present in the reference image |
| Total-occultation rate per monitored bulge star (l = 1, b = -3), f = 1, R = 10 au | 6.4e-5 per star per yr; optical depth 3.5e-5; median duration 161 d | model normalised to OGLE-IV microlensing: observed/model 0.86 (16-84%: 0.62-0.98); durations 10-90%: 76-356 d | Referee's independent route from measured microlensing rates agrees (5.6e-5 field-averaged in both) |
| Radius of a 1 Lsun blackbody enclosure at 30 K | 172 au (344 au across) | exact for a blackbody sphere | The study plan's '9 au across' is wrong. Median radius over the main sequence: 13 au at 30 K, 4.6 au at 50 K, 1.2 au at 100 K |
| Conditional limit from MACHO (Drake & Cook 2003), R = 7 au | f < 0.03-0.08 if all 83 bulge leftovers are counted | order of magnitude only (cloud-model normalisation uncertain by a factor of several) | Their one named candidate, MACHO 120.21786.958 (> 3.5 mag), passed the reddening test, so it is chromatic |
| Gaia Science Alerts that are fadings deeper than 2 mag | 99 of the 12,483 alerts that have a historic magnitude (0.8%); 21 deeper than 3 mag | keyword attribution: 84 to known variable classes, 15 unattributed | 27,076 alerts in total; Gaia17bpp alerted only on its re-brightening |
| Expected events at f = 1e-3, R = 10 au, by data set | OGLE-II 0.25; OGLE-IV I<18 2010-2017 3.5 (2010-2024: 5.5); OGLE-IV I<21 upper bound 150; MACHO bulge 3; VVV bulge 26; Gaia G<17.65 1.6; ZTF 0.08; ASAS-SN 0.013; Kepler 0.0002 | order of magnitude outside OGLE-II | Same search in OGLE-IV (2010-2024, conservative efficiency) would reach f about 1e-3 at 10 au and 1e-4 at 100 au |
Changes made after the referee report
- Fixed the fatal loader defect: ogle2lib.py now has one quality_mask function (flags 1-11 clear, flux != -99.0 error code, error > 0) used for real and injected data; the old condition F > -90 deleted every flux a vanished star produces. Reran the whole pipeline from run_all.py; all files in data/ and all five figures are from the final code.
- Cut flow replaced by 221,801 -> 6,078 -> 4,779 -> 1,959 -> 130 -> 10 -> 0 -> 0 (identical to the referee's corrected run); still zero candidates.
- Near-miss inventory rewritten: 130 pass C1-C4 (115 smooth variables, 7 drifts, 8 gap steps); 10 pass C5 and fail C6 (I = 11.9-14.0 long-period variables, minima 0.38-0.49). Deep dimmers named with the reason each fails: Terz V 2637 (R CrB), OGLE BLG-LPV-196232, V3811 Sgr; SIMBAD identifications for 57 near misses added (data/ogle2_nearmiss_simbad.csv).
- Gap-step statement updated to 12 steps, all within 32 arcsec of a G < 10.5 star (median 19.5 arcsec, KS p = 1.6e-18); looser variant updated to 6 survivors with a note on each (sc44 #6877 and sc18 #807 no longer appear).
- Injection made end-to-end: events are subtracted from the raw flux arrays, the mask is rebuilt with the same function, and recovery requires cuts C1-C7 plus an emulation of the Wozniak (2000) variable finder. Two regression assertions added (injected I = 16 event recovered through the real load path and not recoverable with the old mask; Terz V 2637 decline present). Terz V 2637 added as a positive-control panel in fig3.
- Loader defect disclosed in the first paragraph and in its own section of the report.
- New measurement of catalogue inclusion on 1,296 independent deep eclipsing binaries from the OGLE Collection of Variable Stars (new script 04b_catalogue_inclusion.py): 79% are in the DIA catalogue and pass the centroid cut. The efficiency factors now use it (optimistic: measured fraction; conservative: the smaller of measured minus 2 sigma and the first-version microlensing-based value).
- Reference-image epochs reconstructed per field by non-negative least squares (header template frame recovered in 49 of 49 fields); occulted stars must now be present in the reference image (I_ref < 18.5 conservative, < 19.5 optimistic). Ingress-only exposure reported as an alternative column and as a dotted line in fig4: limits for R >= 100 au and Sun-like 30 K weaken by 2.6-3.2.
- Finite ingress measured with 4-day and 10-day ramps; the 4-day loss is applied to stars with I < 15 in the conservative case and the all-source effect is reported as a robustness row.
- Prior work added and credited: Bramante, Diamond & Kim 2025 (PRL 134, 141001; arXiv:2409.08322) for the idea and rate formalism, Quillen et al. 2014 (arXiv:1402.1198). Novelty narrowed to the executed search and the megastructure application; the statement that the sibling study originated the idea removed.
- Wording: title softened; 'injection-calibrated' replaced by 'calibrated by injection into catalogue light curves'; limits quoted to one significant figure with a factor-of-2 systematic; integrator given a single figure with its qualifiers.
- sc23 #4377 described neutrally (slow decline onto a flat level; fails C4 with 68% of points low); Gaia17bpp-type label dropped.
- Gaia alerts denominator corrected to the 12,483 alerts with a historic magnitude.
- MACHO re-reading: candidate MACHO 120.21786.958 mentioned (chromatic, so not an opaque sphere), limit labelled order-of-magnitude, the 'vetted to zero' hypothetical removed.
- Headline numbers changed from the first version: expected events at R = 10 au 127-482 (was 143-496), limit 0.024 / 0.0062 (was 0.021 / 0.0060); the small weakening comes from the reference-image condition, the giant-ingress loss and the measured inclusion, not from the mask fix.
Referee points not accepted
- None rejected in substance; every required change was made. Three places where I did something other than the literal wording:
- Catalogue inclusion 'is inferred': it is now measured on 1,296 independent deep eclipsing binaries (79%), so the report says 'measured on eclipsing binaries, not by image-level injection' instead of 'inferred'. The factor-of-2 systematic the referee asked for is attached all the same, because binaries are periodic and are not vanishing stars.
- Egress-only exposure ('state that those limits may be weaker by up to a factor of 2'): I took the referee's first option and justified the exposure from reconstructed reference-image epochs (cost 9-13% for long events), and report the ingress-only alternative alongside. The measured ingress-only weakening is 2.6-3.2 for R >= 100 au, larger than the referee's 'up to 2', and the report says so.
- Finite ingress ('at most a few percent'): true for the totals (3-4%) only because 8% of sources are bright giants; per source, a 4-day ingress halves the effective exposure for events of 80 d or less. I report both. Also a detail: I measure the minimum of OGLE BLG-LPV-196232 at 0.11 of the bright level (referee: 0.13), and the final R = 10 au numbers (127-482 events; 0.024 / 0.0062) differ slightly from the referee's corrected-mask rerun (145-500; 0.021 / 0.0060) because of the added reference-image, ingress and inclusion factors.
Code
Every number above is produced by these scripts from public data. The data tables themselves are not hosted here; the scripts download them.
01_download.py 02_signal.py 03_rates.py 04_ogle2_search.py 04b_catalogue_inclusion.py 05_catalogues.py 06_limits.py common.py galmodel.py ogle2lib.py popmodel.py run_all.py
Referee report
A second, separate analysis re-ran the code, recomputed the main numbers by its own route and tried to break the result. Like the first, it was run by Claude for this project; it is not an outside expert. In its report “the analyst” is the first analysis, which wrote the paper, and file names that are not linked on this page are its own working files. The paper above is the version revised in response.
Verdict: sound with fixes. Results reproduced: partly.
Rerun as submitted. I copied the code to scratch and
ran run_all.py against the cached raw files (8.3 min). All
30 files in data/ came out byte-identical to the analyst's,
including the cut flow 221,801 -> 3,571 -> 2,405 -> 940 ->
35 -> 0 and every limit.
The search as coded could not see the signal.
ogle2lib.load_field (line 37) keeps a photometric point
only if F > -90. The error code is exactly -99.0 and is
already carried by flag bit 1 (checked in fields 1, 4, 20 and 39: no
exceptions either way). Valid difference fluxes are routinely far below
-90 counts, because an I = 18 star is about 135-145 counts and an I = 16
star about 850-900.
- The cut discards 18-24% of all clean photometry.
- It removes 96-99% of the clean points where a star brighter than I = 18 sits below half its reference flux.
- The injection never showed this, because it reuses the mask computed before injection. When I apply the real-data mask to the injected fluxes, recovery is 0 of 3,835 contained events (40, 160 and 640 d, 360 hosts, 6 fields); the analyst's way gives 57-80%.
- Fig. 3a shows an "injected, recovered" I = 17.4 event whose points the loader would have deleted from a real light curve.
Rerun with the mask corrected
(F != -99.0, full pipeline, 10.5 min):
| Quantity | As submitted | Mask corrected |
|---|---|---|
| Cut flow | 221,801 -> 3,571 -> 2,405 -> 940 -> 35 -> 0 | 221,801 -> 6,078 -> 4,779 -> 1,959 -> 130 -> 10 -> 0 -> 0 |
| Candidates passing all cuts | 0 | 0 |
| Expected events, f = 1, R = 10 au | 143-496 | 145-500 |
| 95% limit on f, R = 10 au (conservative / optimistic) | 0.0209 / 0.0060 | 0.0206 / 0.0060 |
| 95% limit on f, R = 100 au | 0.0022 / 0.00065 | 0.0022 / 0.00064 |
| All stars at 30 K | 0.0092 / 0.0027 | 0.0092 / 0.0027 |
| All stars at 50 K | 0.028 / 0.0081 | 0.028 / 0.0081 |
| All stars at 100 K | 0.23 / 0.067 | 0.23 / 0.067 |
| Sun-like at 30 K | 0.0020 / 0.00061 | 0.0020 / 0.00060 |
| Steps across the 1998/99 gap | 10, all within 25 arcsec of a G < 10.5 star | 12, all within 32 arcsec (median 19.5; KS p = 1.6e-18) |
| Looser-variant survivors | 5 | 6 |
| Looser-variant limit, R = 10 au | 0.063 / 0.020 | 0.073 / 0.024 |
- The 10 objects that now pass C5 are I = 12-14 long-period variables with minima at 0.38-0.49 of the bright level. All fail the quiet-outside cut by a wide margin (scatter 0.08-0.23).
- Effective exposure per star changes by under 6% at every duration.
- Three of the six variant survivors are catalogued OGLE long-period variables grazing the 0.7 threshold.
- The corrected data contain a natural positive control. sc43 #2786 is Terz V 2637, a known R CrB star, whose 1998 decline to zero or below is recorded with resolved ingress and a slow egress. The submitted run could not see it.
Independent recomputation.
- Rate: I scaled the measured OGLE-IV microlensing rate (Mroz et al. 2019, nearest field to each OGLE-II field) by (main-sequence stars / all lenses = 0.57) x R_eff / (mean sqrt(M) = 0.41 x mean r_E for 1 Msun = 3.1 au) = 4.3. This uses none of the analyst's density or kinematic model. It gives 5.6e-5 occultations per star per year for f = 1, R = 10 au, and 669 events at T_eff = 1.87 yr; the analyst's calibrated values are 5.6e-5 and 673.
- Star count: OGLE-IV I < 18 surface densities times the OGLE-II area give 6.9 million against the analyst's 6.37 million (ratio 0.92).
- Radius: R(1 Lsun, 30 K) = 172 au is right; the study plan's "9 au across" is wrong.
Citations spot-checked against the paper texts and found accurate: the Smith et al. 2021 quotes and 0.8 per square degree per year; Wozniak et al. 2001 (174 of 214, 6 well-measured misses); Wozniak 2000 (the variable finder accepts deviations "up or down"); Drake & Cook 2003 (83 -> 10 bulge, 1e5 expected); the Gaia17bpp alert comment.
Strongest objection
An expert would say the search never looked at 6.37 million stars. It looked at the 221,801 objects a 2002 pipeline chose to catalogue as variables, and as submitted it also threw away every flux measurement a vanished star would produce. The second half is a real, fatal-as-coded defect, but it is one line, and with it fixed the full pipeline gives the same null and the same limits to within 2%.
The first half is what remains. The probability that a vanishing star enters the catalogue, and the blending correction, are inferred rather than measured by image-level injection. The conclusion survives this in substance:
- the variable finder is symmetric in sign;
- the corrected data record a known R CrB star fading to zero;
- the catalogue demonstrably contains step-like losses of I = 17-18 flux (the 12 bright-star artefacts);
- the expected-event count is confirmed by an independent route from measured microlensing rates (669 against 673).
A hidden inefficiency large enough to lift the limit from about 2% back towards the gravity bound of 42% would need more than 90% of vanishing stars to go uncatalogued, which this evidence makes implausible. The honest statement is "below a few percent for R of 10 au or more along bulge sightlines, with about a factor of 2 systematic", not 2.1% or 0.6% to two figures.
Errors found
- fatal. As submitted, the OGLE-II search has zero
sensitivity to a total occultation of an I < 18 star, so the reported
null is vacuous. The loader's
(F > -90)condition deletes every valid difference flux below -90 counts, which is exactly what a vanished star produces. The injection hid this because it reuses the pre-injection mask. The defect is repairable, and I verified the repair: with the mask corrected the search still returns zero candidates and the limits move by under 2%.- Evidence: Error code is exactly -99.0 and coincides with flag 1 in fields 1, 4, 20 and 39. The mask discards 18-24% of clean points. In field 1, 2,553 clean points have a star brighter than I = 18 below half its reference flux, and 116 survive the mask. Injection through the real-data mask: 0 of 3,835 recovered, against 57-80% the analyst's way. Corrected cut flow: 6,078 -> 4,779 -> 1,959 -> 130 -> 10 -> 0.
- Fix: In
code/ogle2lib.pyline 37 replace(F > -90)with(F != -99.0), or drop it, since flag bit 1 already marks error codes. Rerun steps 04-06. Replace the cut-flow table, the near-miss inventory, fig3 and fig5, and every number derived from them (corrected values are in the reproduction notes).
- major. The injection-recovery test is not
end-to-end. Injected fluxes skip the quality mask applied to real data,
so the test could not detect the loader defect and would miss any
similar one.
- Evidence:
04_ogle2_search.pyinjection()passesgk, computed from un-injected fluxes, tool.metrics. Under the corrected mask Terz V 2637 shows a decline to -0.3 of the bright level with resolved ingress. - Fix: Inject into the raw arrays, then build the mask with the same function used for real data. Add two regression checks: an injected total occultation of an I = 16 star must be recovered through the full load path, and the 1998 decline of the known R CrB star Terz V 2637 (sc43 #2786) must appear in its loaded light curve.
- Evidence:
- major. The report's description of what the data
contain is wrong, because the mask hid all deep fades of bright stars.
It says 35 light curves reach C5 (22 smooth variables, 8 drifts, 5
steps) and none passes C5.
- Evidence:
ogle2_cutflow.csv,ogle2_search_summary.json; SIMBAD identifications for the deep dimmers. - Fix: Report the corrected inventory. 130 reach C5: 115 smooth variables, 7 monotonic drifts, 8 gap steps. 10 pass C5 and all fail C6; they are I = 12-14 long-period variables with minima at 0.38-0.49. Name the deep dimmers the corrected data reveal and say why each fails: Terz V 2637 (R CrB), OGLE BLG-LPV-196232 (V-shaped dip to 0.13), V3811 Sgr (U-shaped dip to 0.2). Update the gap-step count to 12 and the variant survivors to 6.
- Evidence:
- major. Closest prior work is missing. Bramante,
Diamond & Kim (arXiv:2409.08322; Phys. Rev. Lett. 134, 141001,
2025), "Dimming Starlight with Dark Compact Objects", already proposed
this test: dark objects larger than their Einstein radius dimming
background stars in EROS-2 and OGLE data, with the rate formalism in
which the physical radius replaces the Einstein radius. They forecast
constraints assuming a future null result and unit efficiency, and did
not search. The report and the sibling study present the test as an
unexploited idea of this project.
- Evidence: Text of arXiv:2409.08322: "null observations of dimming events in OGLE-III+IV could be used to set constraints"; the dimming efficiency is stated to be outside its scope; efficiency set to 1.
- Fix: Cite and credit Bramante et al. for the idea and the rate formalism. Restate what is new as (a) the first actual search and (b) the application to enclosed stars. Also cite Quillen et al. 2014 (arXiv:1402.1198), a small systematic search for transient obscuration events in the 2MASS calibration fields.
- major. Efficiency is calibrated only at catalogue
level, yet the headline calls the search "injection-calibrated" without
qualification. The search covers the 221,801 objects the variable finder
chose to catalogue. Whether a vanishing star among the other 6.1 million
is catalogued (0.81-0.97) is inferred from microlensing brightenings,
not measured. The "conservative" case is therefore not a strict lower
bound.
- Evidence: Wozniak 2000 section on variable finding; Wozniak et al. 2001 on the 40 missed events and the PSF-correlation cut.
- Fix: Say "calibrated by injection into catalogue light curves; image-level inclusion not measured" in the headline and summary. Add the supporting evidence that does exist: the variable finder is symmetric in sign; the catalogue records the Terz V 2637 decline; the 12 gap-step artefacts show that sudden sustained losses of I = 17-18 flux are catalogued. Attach an explicit systematic of about a factor of 2 to the limits.
- minor. For events longer than the survey (R of 50
au and above; the R = 100-1,000 au rows and the Sun-like 30 K rows),
about half of the effective exposure comes from egress-only events.
Those need the star to be in the reference-image star list although it
was hidden for part of 1997-1999. If the reference frames predate the
egress, the star fails the centroid cut or gets a wrong reference flux.
- Evidence: Effective exposure is flat at 1.5-1.7 yr from 1,280 d to 55 yr; by time symmetry roughly half of it is egress.
- Fix: Either show from the reference-image epochs that this loss is small, or count ingress-only exposure for durations beyond about 1,000 d and state that those limits weaken by up to a factor of 2.
- minor. The note on sc23 #4377 as a "Gaia17bpp-type
eclipse" is not supported. With all points restored (348 instead of 258)
it declines continuously through 1997 from 1.4 to 0.4 of the bright
level and then sits flat at 0.25 for three seasons. That is equally the
decay of an outburst onto a constant quiescent level.
- Evidence:
sc23_4377.png - Fix: Describe it neutrally as a slow decline onto a flat level, and drop the eclipse label or give both readings. It fails C4 under the corrected mask (68% of points low).
- Evidence:
- minor. "Of the 27,076 alerts, 99 are fadings deeper
than 2 mag" uses the wrong denominator. Only 12,483 alerts carry a
historic magnitude, so only those can be classed as fadings.
- Evidence:
data/gaia_alerts_summary.json: n_with_historic_magnitude = 12483. - Fix: Write "99 of the 12,483 alerts that have a historic magnitude".
- Evidence:
- minor. The MACHO re-reading omits that Drake &
Cook single out one bulge light curve (MACHO 120.21786.958) with a drop
of more than 3.5 mag as a good obscuration candidate. The 1,200-3,300 x
f scaling also rests on a cloud-model normalisation that the analyst's
own check shows is uncertain by a factor of several.
- Evidence: Drake & Cook 2003 text;
rate_sanity_checks.jsonimplied efficiencies 0.23-1.5. - Fix: Mention the candidate and that it passed their reddening test, so it is chromatic and not an opaque sphere. Call the MACHO conditional limit order-of-magnitude.
- Evidence: Drake & Cook 2003 text;
- minor. Injected events are instantaneous steps. For
the brightest sources (8% of the sample has I < 15; a few are giants
of 100 Rsun or more) ingress lasts days to weeks and could fail the edge
or flat-bottom cuts.
- Evidence:
ogle2_fields.csv: 8.1% of I < 18 stars have I < 15. - Fix: State this as a limitation; the effect on the expected counts is at most a few percent.
- Evidence:
Overclaims
- Title: "Cold enclosed stars cannot hide from occultation". They can if the enclosure is under about 3 au, or at any radius at the 1-2% level; the result is a prevalence bound along bulge sightlines.
- "A new, injection-calibrated search ... finds zero stars that vanish": as submitted the search could not have found any. After the fix it is calibrated at catalogue level only.
- Limits quoted to two significant figures (2.1%, 0.6%, 0.22%, 0.065%). The catalogue-inclusion and blending factors are inferred, so one significant figure with a factor-of-2 systematic is the supportable precision.
- "To my knowledge the first efficiency-calibrated search ..." and the framing of the test as this project's unexploited idea: Bramante, Diamond & Kim (2025) published the proposal and formalism. Only the executed search is new.
- "An integrator should therefore replace the gravity-only bound of about 0.4 ... by about 0.01-0.02": acceptable only with the qualifiers attached (R of 10 au or more, opaque and sharp-edged, inner-Galaxy sightlines, catalogue-level efficiency); 0.01 is the 30 K population case, not a general figure.
- "Fewer than 0.2% inside 100 au or more" and the R = 1,000 au limit of 2.3e-4: these rest on single-edge detections, half of them egress-only, and may be up to 2 times weaker.
- sc23 #4377 "looks like a Gaia17bpp-type eclipse": not established by the light curve.
- "If those 83 light curves were vetted to zero it would be 1e-3 to 2.5e-3" (MACHO): hypothetical, resting on a cloud-model scaling uncertain by a factor of several; it should not be read as a result.
Novelty check
Novel: partly. The search itself appears to be new. I found no published search of OGLE, MACHO or any other forced-photometry survey for total, single, achromatic disappearances read as a limit on enclosed stars, and no occultation limit on Dyson spheres. The idea and the rate formalism are not new. Bramante, Diamond & Kim (2025) proposed exactly this dimming test on EROS-2 and OGLE data for dark-matter clumps and forecast constraints without searching; the report does not cite them. Kerins, Binney & Silk (2002) and Drake & Cook (2003) did the same for dusty clouds and ran a calibrated MACHO search, which the report credits. The novelty claim should be narrowed to the search and the megastructure application.
- Bramante, Diamond & Kim 2025, Phys. Rev. Lett. 134, 141001 (arXiv:2409.08322), Dimming Starlight with Dark Compact Objects: proposes the test and the formalism, forecasts only, not cited by the analyst
- Drake & Cook 2003 (astro-ph/0301013): injection-calibrated MACHO search for obscuration by dusty clouds (credited)
- Kerins, Binney & Silk 2002: predicted extinction events from cold clouds (credited)
- Smith et al. 2021 (VVV-WIT-08): chance-occultation rates for 0.5 au dark bodies; notes that no concerted search has been done (credited)
- Quillen et al. 2014 (arXiv:1402.1198): search for transient obscuration events in the 2MASS calibration fields (not cited)
- Lucas et al. 2024; JoHantgen et al. 2025 (arXiv:2507.19594); Tzanidakis et al. 2025 (arXiv:2508.03964): dipper searches, none aimed at total single disappearances (credited)
Required changes
- Fix
code/ogle2lib.pyline 37: replace(F > -90)with(F != -99.0)or remove it. Rerun steps 04, 05 and 06 and regenerate every file indata/and figures 3, 4 and 5. - Replace the cut-flow table with 221,801 -> 6,078 -> 4,779 -> 1,959 -> 130 -> 10 -> 0 -> 0, and the key-number cut flow likewise.
- Rewrite the near-miss paragraph: 130 reach C5 (115 smooth variables, 7 drifts, 8 gap steps); 10 pass C5 and fail C6 (I = 12-14 long-period variables, minima 0.38-0.49). Name Terz V 2637, OGLE BLG-LPV-196232 and V3811 Sgr as the deep dimmers and say why each is rejected.
- Update the gap-step statement to 12 steps, all within 32 arcsec of a G < 10.5 star (median 19.5 arcsec, KS p = 1.6e-18).
- Update the looser variant to 6 survivors and limits of 0.073 / 0.024 at R = 10 au. Note that three are catalogued OGLE long-period variables at the threshold, and that sc44 #6877 and sc18 #807 no longer appear.
- Update the headline expected events to 145-500 and the R = 10 au limit to 0.021 / 0.0060; the other limits are unchanged at the quoted precision.
- Make the injection end-to-end: build the quality mask after injection with the same loader function. Add the Terz V 2637 light curve as a positive-control figure or check.
- Disclose the loader defect and its repair in the report, including that the first version of the search was blind and the null was re-established after the fix.
- Cite Bramante, Diamond & Kim 2025 (arXiv:2409.08322) as the prior proposal of the test and its rate formalism. Narrow the novelty claims in the report and JSON to the search and the megastructure application, and correct the statement that the sibling study originated the idea. Cite Quillen et al. 2014.
- Replace "injection-calibrated" in the headline with "calibrated by injection into catalogue light curves". Add a sentence that catalogue inclusion is inferred, and quote the limits with a factor-of-2 systematic.
- For R of 50 au and above and the Sun-like 30 K rows, either justify the egress-only exposure from the reference-image epochs or state that those limits may be weaker by up to a factor of 2.
- Reword the sc23 #4377 note neutrally; drop the Gaia17bpp-type eclipse label.
- Correct the Gaia alerts denominator to 12,483 alerts with a historic magnitude.
- Mention MACHO 120.21786.958 and label the MACHO conditional limit order-of-magnitude.
- Soften the title to something like "Occultation limits cold enclosed stars to a few percent along bulge sightlines".
- In the Fermi implications, give the integrator one figure: f below about 0.02 (conservative) for opaque sharp-edged enclosures of R = 10 au or more in the inner Galaxy, factor-of-2 systematic, not local, with nothing below 3 au.