Where is everybody? · Working papers
How repeatable is the road to intelligence?
Revised after a second, separate analysis run for this project tried to break it. Neither analysis is an outside expert.
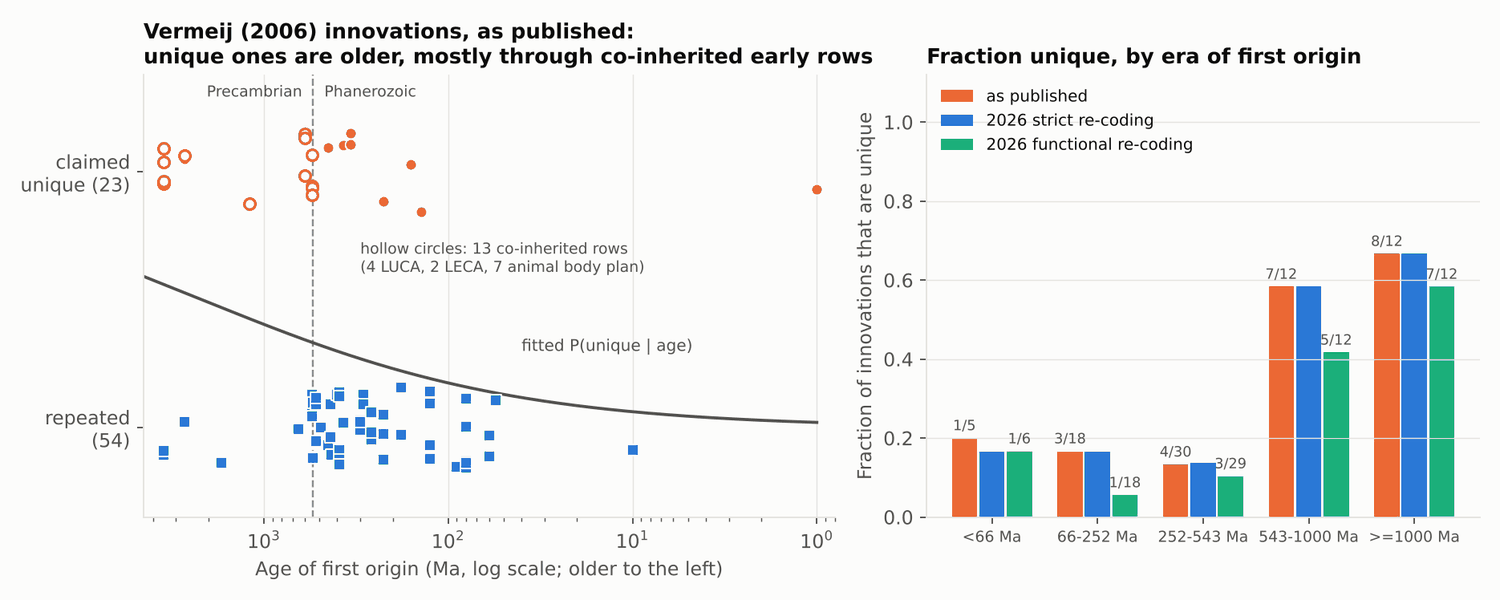
Vermeij's 2006 result reproduces on his own tables (the odds that an innovation has a single known origin rise 3.2-fold per tenfold increase in age, 95% interval 1.2-9.8, n = 77), but it rests on co-inherited early traits: counting the trait clusters of the last universal common ancestor, the last eukaryotic common ancestor and the animal body plan once each leaves 1.4 (0.5-5.0, p = 0.47), and no age trend is detectable within the Phanerozoic or within the Precambrian.
Summary
Vermeij's 2006 result reproduces on his own tables (the odds that an innovation has a single known origin rise 3.2-fold per tenfold increase in age, 95% interval 1.2-9.8, n = 77), but it rests on co-inherited early traits: counting the trait clusters of the last universal common ancestor, the last eukaryotic common ancestor and the animal body plan once each leaves 1.4 (0.5-5.0, p = 0.47), and no age trend is detectable within the Phanerozoic or within the Precambrian. Three of 13 proposed hard steps have recurred (primary plastids, complex multicellularity, colonisation of land) and eight have one known origin; the recurrence limits on the oldest of those (below 0.75-1.8 per billion years) cannot tell a hard step from an easy one. Among 1,547 living mammal species none matches human relative brain size (encephalization quotient 6.4): the best dolphins reach 0.73 of it (species with at least three brains measured) to 0.86 (one single record), three or four lineages separate for 20 million years or more come within a factor of 2, and no non-human species has a measured cortical neuron count within a factor of 2. A drift-free diffusion model gives median waits of 1 to 130 million years (90th percentile up to 210) for another mammal lineage to reach the human value, but only for a world that already has large-brained mammals, and the same model fails to reproduce the Cenozoic rise (hindcast probability 0.003 or less), so these are model outputs and not forecasts. The data give an upper limit (0.046 per lineage per million years, from 65 hand-coded lineage-million-years) and no lower limit on the chance that a large brain leads to technology; the first-pass figures of a 23% base rate, a dolphin at 88% of the human value, 7-9 independent origins, waits of 1-100 million years and P(hardware) of at least 0.9 are all withdrawn.
Key numbers
| Quantity | Value | Uncertainty | Note |
|---|---|---|---|
| Vermeij (2006) tables as published: odds ratio of an innovation being singular (one known origin) per tenfold increase in age | 3.20 | 95% profile-likelihood interval 1.20-9.82; permutation p = 0.014; n = 77 (23 singular) | Firth bias-reduced logistic regression. Fisher exact p = 0.00008 at a 543 Ma cut (15 of 23 singular vs 9 of 54 repeated rows are older) and 0.0048 at 1 Ga. A replication of Vermeij's own test. |
| Same odds ratio with the LUCA (4 rows), LECA (2 rows) and animal body-plan (7 rows) trait clusters each counted as one event | 1.44 | 95% interval 0.51-5.00; permutation p = 0.47; n = 67 | Fisher p = 0.125 at 543 Ma (5 of 13 singular vs 9 of 54 repeated rows are older) and 0.040 at 1 Ga. Collapsing only the body-plan rows: 2.94 (1.05-9.29), Fisher p = 0.008. Collapsing by stem lineage: 1.75 (0.64-5.73), p = 0.26. |
| Same odds ratio without the 7 rows dated 3.5 Ga or older | 1.89 | 95% interval 0.63-7.76; p = 0.22; n = 70 | The log-age trend is not significant once the oldest rows are removed. |
| Odds ratio within the Phanerozoic only / within the Precambrian only | 0.49 / 1.64 | 0.14-1.74 (n = 53) / 0.18-16.0 (n = 24) | Phanerozoic value is driven by one row (human language); without it 1.86 (0.22-40.6). No trend detectable within either eon; the intervals do not exclude the pooled value. |
| Step versus smooth gradient in log age, Vermeij as published (log-likelihoods) | -38.4 (best step) vs -43.9 (gradient) | cut position is a fitted third parameter | Best cut lies between Vermeij's rows dated 540 and 550 Ma. The step exceeds the gradient by more than 3 log units only for cuts between 520 and 600 Ma, by more than 1 unit for cuts between 430 and 600 Ma. After collapsing all three trait clusters the best step is only 2.5 units better and sits near 1.8 Ga. |
| Extended list of 38 dated innovations compiled for this study, four Homo-lineage rows counted once | odds ratio 1.41 per tenfold age | 0.57-4.58; p = 0.44; n = 35 | All rows: 0.71 (0.38-1.27). Excluding rows younger than 5 Ma: 5.5 (1.29-39). The list was chosen by the analyst and 18 of 39 rows were written from memory, so this is a sensitivity check only. |
| Proposed hard steps (13 rows): singular with no known second origin / contested / repeated | 8 / 2 / 3 | Repeated: primary plastid (2 origins), complex multicellularity (5-8), colonisation of land (5-25). Contested: mitochondrion-like organelle, neurons. | |
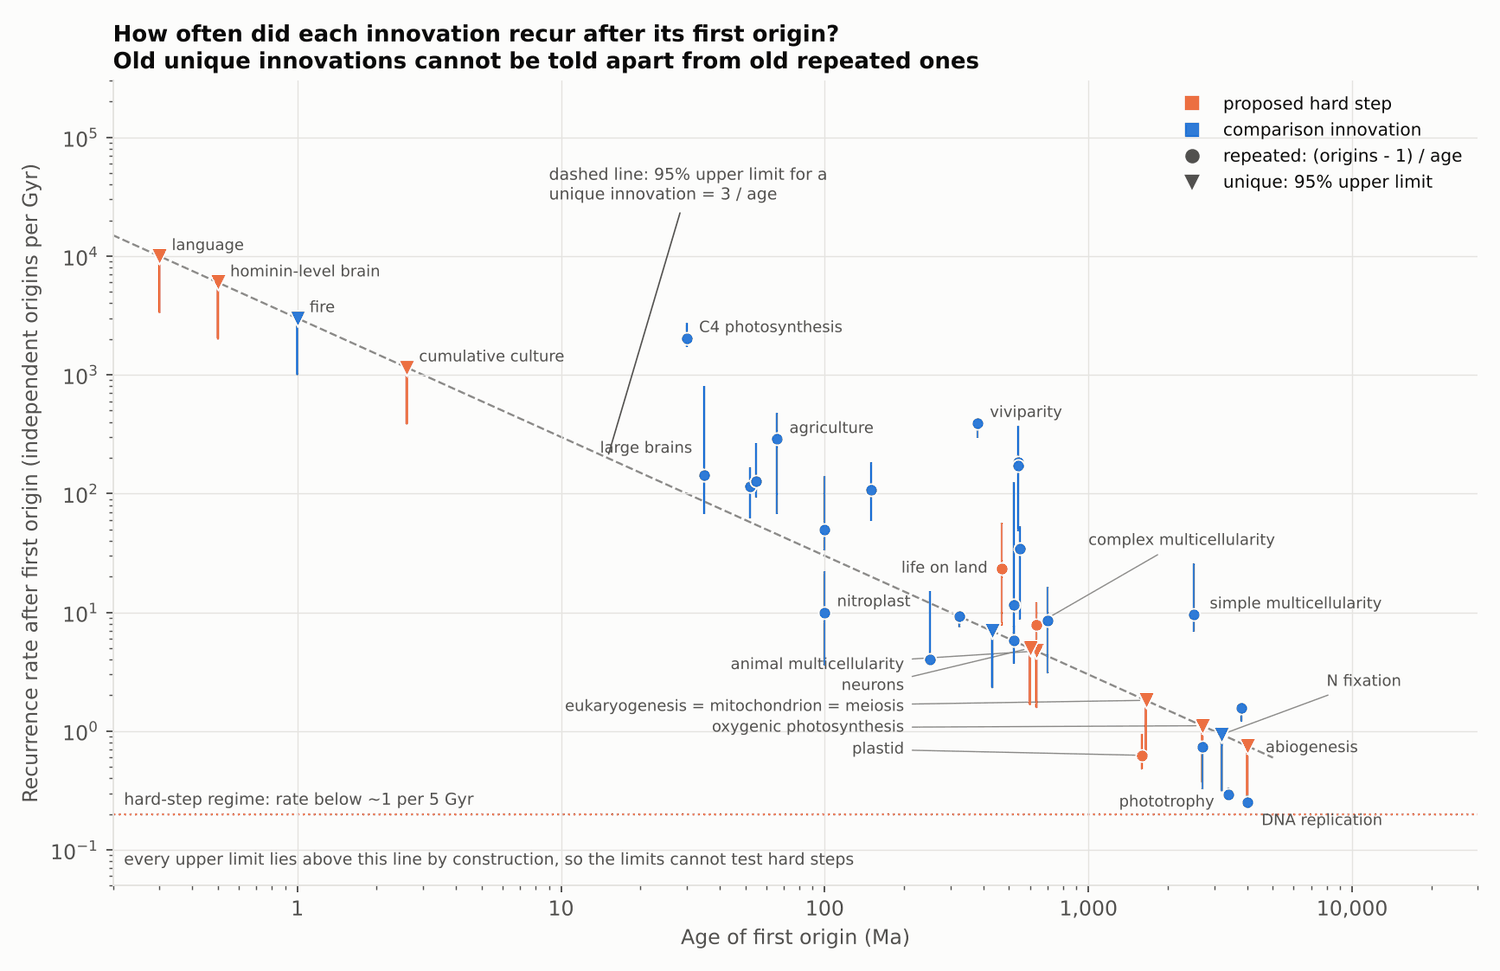
| 95% upper limit on the recurrence rate of the three oldest singular steps | abiogenesis < 0.75, oxygenic photosynthesis < 1.1, eukaryogenesis < 1.8 per Gyr | limits are 3/age by construction | These limits lie above the hard-step regime (below about 0.2 per Gyr) whatever the truth, so they cannot test hard-step models in either direction. |
| Ratio of Phanerozoic to Precambrian singular fractions (illustration only, not an estimate) | 0.22 | 0.21-0.47 across cuts and collapses; true value could be anywhere from 0 to 1 | The first-pass reading of this ratio as a 23% base rate of genuinely unique innovations is withdrawn; it assumes the minor Phanerozoic traits and the major Precambrian transitions are exchangeable. |
| Human encephalization quotient (EQ), Burger et al. record | 6.41 | Brain 1,250 g, body 65.1 kg, n = 7. With a 1,350 g brain: 6.92. | |
| Highest non-human EQ as a fraction of the human value | 0.73 (species with at least 3 brains measured) to 0.86 (single record) | 0.68-0.80 with a 1,350 g human brain | Pacific white-sided dolphin 4.71 (n = 4); northern right whale dolphin 5.52 (single record, no sample size). The first-pass 0.88 came from a white-beaked dolphin record with a juvenile body mass and is excluded. |
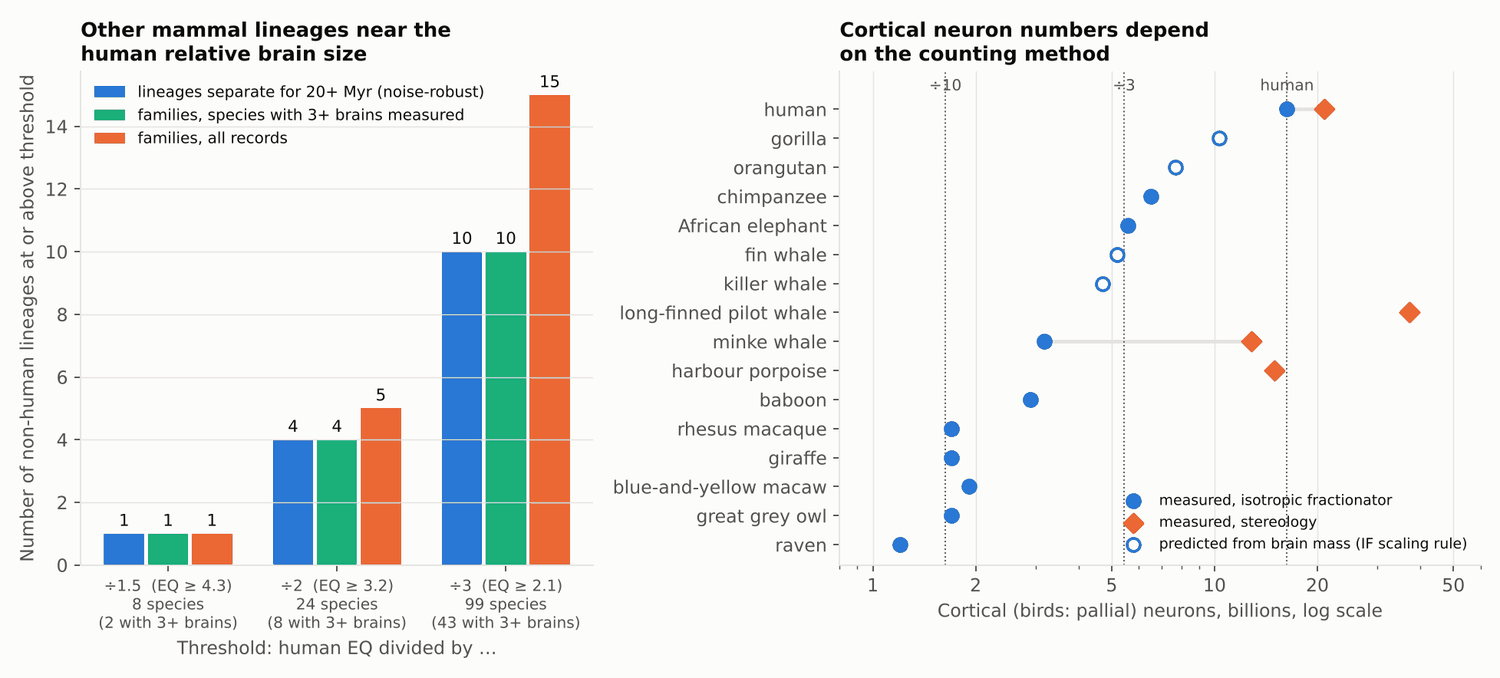
| Species within a factor 1.5 / 2 / 3 of human EQ | 8 / 24 / 99 (all records); 2 / 8 / 43 (at least 3 brains measured) | Families: 1 / 5 / 15 (all records), 1 / 4 / 10 (at least 3 brains). 11 of the top 25 non-human records have no sample size. | |
| Lineages separate for at least 20 Myr with a member within a factor 1.5 / 2 / 3 of human EQ | 1 / 4 / 10 | 1 / 3 / 9 if a species with at least 3 brains measured is required; 1 / 3 / 5 for lineages separate at least 30 Myr | Within a factor 2: dolphins plus porpoises, spider monkeys (Atelidae), capuchins (Cebidae), and macaques (single records only). All are toothed whales or primates. |
| Non-human species within a factor 2 / 3 of the human cortical neuron count (16.3 billion, isotropic fractionator) | 2 / 9 species, of which 0 / 2 have a measured count | Within a factor 2: two gorilla species by scaling-rule prediction only. Measured within a factor 3: chimpanzee 6.5 billion, African elephant 5.6 billion. The primate rule over-predicts the human count by 30-50%. Stereology gives 4 times more than the fractionator for the minke whale (12.8 vs 3.2 billion). | |
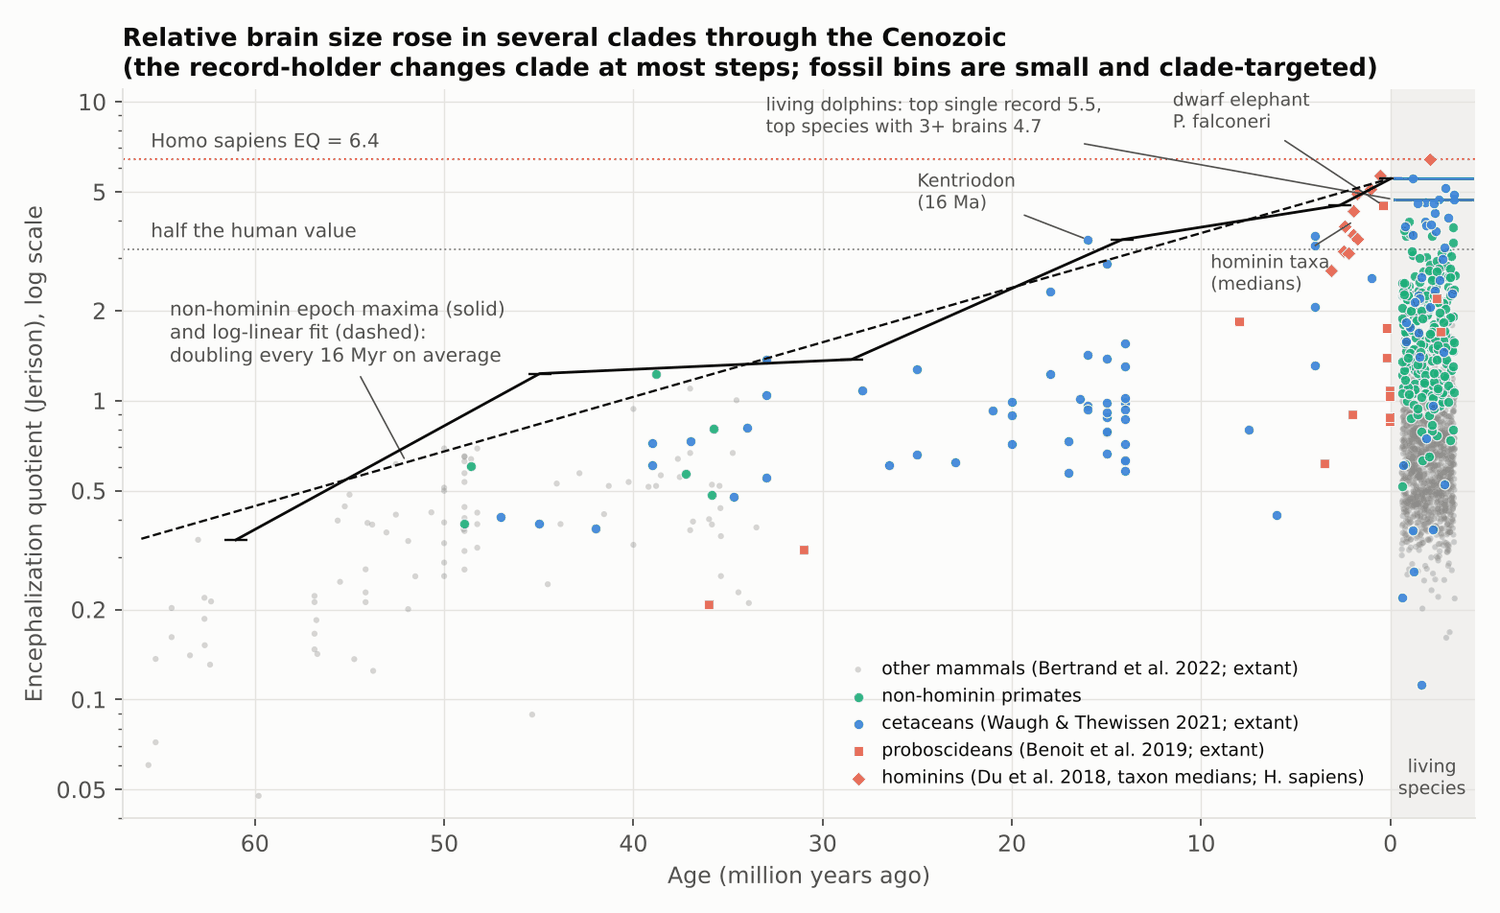
| Slope of the maximum EQ of non-hominin mammals across six Cenozoic time bins | 0.042 per Myr in ln EQ (doubling every 16 Myr) | bootstrap 0.038-0.048; 0.037 (0.027-0.047) with every bin rarefied to 10 specimens | An average over a stepped series whose record-holder changes clade at most steps and whose last fossil point is a dwarf island elephant; not to be extrapolated. |
| Brownian-motion rate of ln EQ across mammals, per Myr | 0.0059 (plain); 0.0022 (with a measurement-noise term); 0.0009 (sister-species pairs) | noise-corrected 95% interval 0.0020-0.0025; fitted noise 0.15 in ln EQ per species (0.14-0.16) | In 8 simulations at the fitted rate and noise the plain estimator returns 0.0049-0.0062, the noise-corrected one 0.0020-0.0024 and the sister-pair one 0.0014-0.0025. The observed sister-pair value is below that simulated range, so a single Brownian rate plus noise does not describe the data at all time depths. |
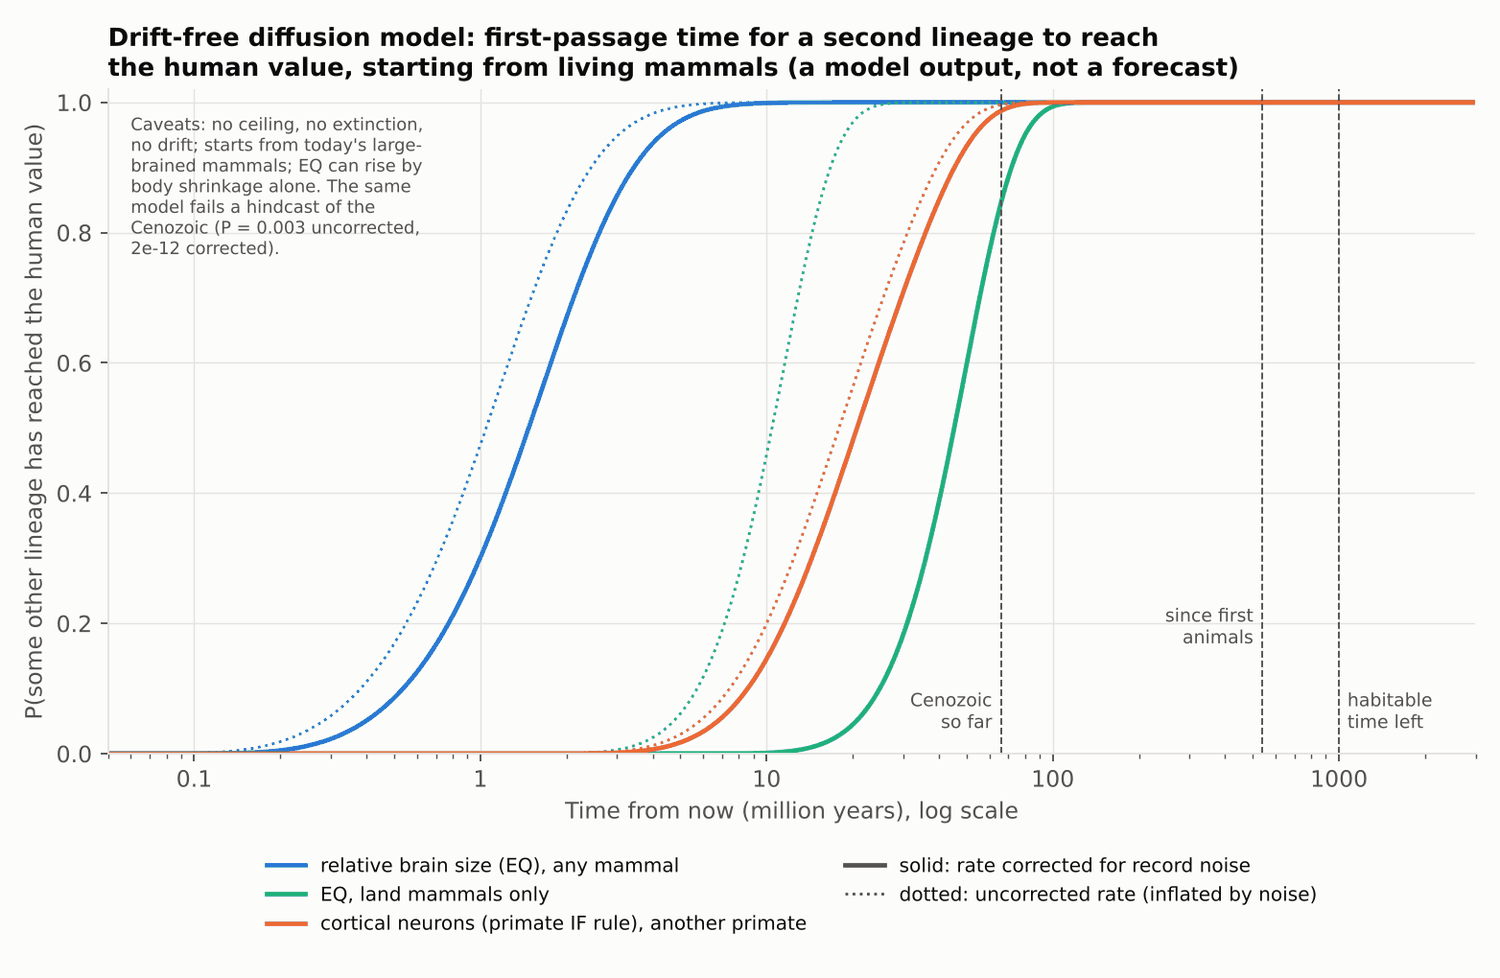
| Median first-passage time for another mammal lineage to reach human EQ or human-scale primate brain mass | 1.1 to 127 Myr across criteria, record sets and four rate estimates | largest 90th percentile 211 Myr | Land mammals only, noise-corrected rate: 46 Myr (10-90% range 25-72). Conditional on today's large-brained mammals; the model has no ceiling and no drift. |
| Hindcast: probability that any of 5,000 lineages starting at the Paleocene median EQ (0.16) reaches half the human EQ in 61 Myr under the same model | 0.003 (plain rate); 2e-12 (noise-corrected rate) | Several lineages did reach it, so the drift-free model is rejected by the history it is fitted to. | |
| Hominin EQ rise | 0.25 per Myr in ln EQ | standard error 0.02; 94 crania | About 6 times the non-hominin envelope slope. Fossil hominin EQs use the Ruff et al. (1997) volume-to-mass conversion and assumed body masses. |
| Hazard of technology arising in a large-brained lineage | < 0.046 per lineage per Myr (95% upper limit) | no lower limit | From 65 lineage-Myr of hand-coded exposure without technology (a judgement table, not a measurement). The mean probability of technology within 1 Gyr under log-uniform priors ranges 0.22-0.78 depending only on where the prior's floor is put. |
Data used
- Vermeij 2006, PNAS 103:1804, Tables 1 and 2 (23 singular + 54 repeated innovations with ages), transcribed once from the PMC page PMC1413639 and committed as data/vermeij2006_tables_as_published.csv; not re-downloadable by script
- Burger, George, Leadbetter & Shaikh 2019, J Mammal 100:276 (Dryad 10.5061/dryad.2r62k7s; https://zenodo.org/api/records/4989800/files/BrainAllometry_Supplement_Data.csv/content): brain and body mass for 1,552 living mammal species; 1,547 used after excluding 5 flagged records
- Alvarez-Carretero et al. 2022, Nature 602:263: 4,705-species mammal timetree (https://raw.githubusercontent.com/sabifo4/mammals_dating/main/02_SeqBayes_S2/03_Generate_final_mammal_tree/4705sp_mean.nwk); primary tree, 1,337 species matched
- Upham, Esselstyn & Jetz 2019, PLoS Biol 17:e3000494: completed 5,911-species MCC tree (https://raw.githubusercontent.com/n8upham/MamPhy_v1/master/_DATA/MamPhy_fullPosterior_BDvr_Completed_5911sp_topoCons_NDexp_MCC_v2_target.tre), robustness only, 1,460 species matched; and the DNA-only 4,098-species MCC tree (https://raw.githubusercontent.com/n8upham/MamPhy_v1/master/_DATA/MamPhy_fullPosterior_BDvr_DNAonly_4098sp_topoFree_NDexp_MCC_v2_target.tre), added in revision to check the cetacean anomaly
- Bertrand et al. 2022, Science 376:80 (Zenodo 10.5281/zenodo.5918811): 116 Paleogene and extant placental endocasts with body mass
- Waugh & Thewissen 2021, PLoS ONE 16:e0257803, S3 Table (Europe PMC PMC8478358 supplementary files): 54 fossil cetacean brain and body masses
- Benoit et al. 2019, Sci Rep 9:9323 (Europe PMC PMC6597534 full text): 28 proboscidean endocasts
- Du et al. 2018, Proc R Soc B 285:20172738 (Dryad 10.5061/dryad.c30g9; https://zenodo.org/api/records/4977822): 94 dated hominin endocranial volumes
- Muller & Montgomery 2019, J Evol Biol (Dryad 10.5061/dryad.rm4368f; https://zenodo.org/api/records/4068964): brain and body mass of 17 cetacean species, used as a cross-check
- Massen et al. 2021, Commun Biol 4:503 source data (DataverseNL 10.34894/ROFNL1; https://dataverse.nl/api/access/datafile/26144): measured cortical neuron counts for 22 mammal species
- Kverkova et al. 2022, PNAS 119:e2121624119, Dataset S1 (Europe PMC PMC8931369 supplementary files) and Sol et al. 2022, Nat Ecol Evol 6:1381 (Zenodo 10.5281/zenodo.6460346): neuron numbers for 220 bird and reptile species
- Neuron counts transcribed by hand (19 rows) from open full texts fetched from Europe PMC: Avelino-de-Souza et al. 2025 (PMC12445405), Herculano-Houzel et al. 2014 (PMC4053853), Mortensen et al. 2014 (PMC4244864), Kazu et al. 2014 (PMC4228855), Jardim-Messeder et al. 2017 (PMC5733047)
- Mills, Macalady, Frank & Wright 2025, Sci Adv 11:eads5698 (PMC11827626): context only
- Hand-entered tables written by the analyst: 10 assumed hominin body masses; an extended list of 39 innovations with numbers of origins and ages (18 rows from memory, flagged in data/innovations_2026.csv); a five-row table of large-brained lineages and their exposure times without technology
Method
How repeatable is the road to intelligence? Independent origins of major innovations and of large brains
Revised after referee review.
Summary
Vermeij's 2006 result reproduces on his own tables: innovations with one known origin ("singular") are older than repeated ones, and the odds of being singular rise 3.2-fold per tenfold increase in age (95% interval 1.2-9.8, n = 77). The result does not survive counting co-inherited traits once. When the four traits of the last universal common ancestor (LUCA), the two of the last eukaryotic common ancestor (LECA) and the seven animal body-plan traits are each treated as one event, the odds ratio is 1.4 (0.5-5.0, p = 0.47), and no age trend is detectable within the Phanerozoic or within the Precambrian. Three of 13 proposed hard steps have recurred (primary plastids, complex multicellularity, colonisation of land). Eight have one known origin, and the limits on how often the oldest of them could recur (below 0.75 to 1.8 per billion years) are too weak to tell a hard step from an easy one. Among 1,547 living mammal species none matches human relative brain size. The nearest are dolphins at 0.73 of the human value (species with at least three brains measured) to 0.86 (a single record), and three or four lineages separate for at least 20 million years come within a factor of 2. No non-human species has a measured cortical neuron count within a factor of 2 of ours. A drift-free diffusion model puts the median wait for another mammal lineage to reach human relative brain size between 1 and 130 million years (90th percentile up to 210), but it applies only to a world that already has large-brained mammals and it fails to reproduce the Cenozoic rise it is fitted to. The data give an upper limit and no lower limit on the chance that a large brain leads to technology.
Main caveats: Vermeij's list and the grouping of co-inherited traits are judgements; relative brain size is not brain hardware and can rise by body shrinkage; most brain records are single specimens; the waiting times are model outputs, not forecasts. Five first-pass headline figures did not survive review and are withdrawn: a 23% base rate of genuinely unique innovations, a dolphin at 88% of the human value, 7-9 independent origins of near-human relative brain size, waits of 1-100 million years, and a probability of at least 0.9 that brain hardware recurs.
Units: Ma = million years ago, Ga = billion years ago, Myr and Gyr = million and billion years.
Question
Hard-step models of the Fermi paradox assume a few evolutionary transitions are so improbable that they happen once per habitable planet at most. Two things can be checked with data. First, are one-off innovations really different from repeated ones, or do they only look unique because they are old and the evidence of other origins is lost? Second, how close have other lineages come to the human brain, and how long would another take?
Data
All downloads are scripted in code/fetch_data.py (19
files, about 30 MB). The one input that cannot be re-downloaded is the
transcription of Vermeij's two tables, committed as
data/vermeij2006_tables_as_published.csv.
| Source | Content | Rows used |
|---|---|---|
| Vermeij 2006, PNAS 103:1804, Tables 1-2 | innovations with age, singular or repeated | 23 singular + 54 repeated |
| Extended list compiled for this study | 39 innovations with number of origins and age (18 rows from memory) | 38 dated |
| Burger et al. 2019 | brain and body mass, living mammals | 1,547 of 1,552 species; 459 with at least 3 brains measured |
| Alvarez-Carretero et al. 2022 (primary); Upham et al. 2019 (check) | dated mammal trees | 1,337 and 1,460 species matched |
| Bertrand et al. 2022; Waugh & Thewissen 2021; Benoit et al. 2019; Du et al. 2018 | fossil endocasts: placentals, cetaceans, proboscideans, hominins | 116, 54, 28 and 94 specimens |
| Massen et al. 2021 plus 19 hand-transcribed rows | measured cortical neuron counts, mammals | 29 species |
| Kverkova et al. 2022; Sol et al. 2022 | neuron counts, birds and reptiles | 220 species |
Selection cuts. Five extant records are excluded as wrong or not
adult, each listed with its reason in code/extract_data.py:
cattle, harbour porpoise, white-beaked dolphin, and two rodents. The
white-beaked dolphin was added in this revision: its body mass of 67.5
kg is a quarter to a third of the adult mass of 180-300 kg. Keeping all
five would give 10, 26 and 102 species within factors 1.5, 2 and 3 of
the human value in place of 8, 24 and 99.
Method
Part 1. I reproduce Vermeij's test (are singular innovations older than repeated ones?) with Fisher exact tests at his two cuts (1 Ga and 543 Ma), a bias-reduced (Firth) logistic regression of singular against log10 age with profile-likelihood intervals, and permutation tests. I repeat it under a 2026 re-coding of his rows, within each eon, without the oldest rows, and with co-inherited traits collapsed to one event in three ways: the seven animal body-plan rows only; clusters by stem lineage (LUCA, LECA, Eumetazoa stem, Bilateria stem); and LUCA, LECA and body plan each once. I compare a step in time with a smooth gradient by log-likelihood, scanning every possible cut. For 13 proposed hard steps and 25 comparison innovations I compute recurrence rates (origins per Gyr) or, for singular ones, the 95% upper limit 3/age.
Part 2. Relative brain size is Jerison's encephalization quotient, EQ = brain mass / (0.12 x body mass^0.667), masses in grams. I count species, families and lineages within factors 1.5, 2 and 3 of the human EQ, for all records and for species with at least three brains measured. A "lineage separate for T Myr" is a clade obtained by cutting the dated tree T Myr ago; it counts if a member with at least three brains is over the threshold or at least two members are. Cortical neuron counts are measured values where they exist and otherwise predictions from the published scaling rules of the isotropic fractionator (a method that dissolves tissue and counts nuclei); stereology (counting cells in sampled sections) is reported separately. Fossil endocast volumes are converted to brain mass with the Ruff et al. (1997) formula for hominins and 1.0 g/cm3 for Paleogene placentals, with 0.92 g/cm3 as a sensitivity case. The fossil series gives the maximum EQ of non-hominin mammals in six time bins. Rates of change of ln EQ come from independent contrasts on the tree in four ways: plain; robust (median-based); with a measurement-noise term fitted jointly by restricted maximum likelihood; and from sister-species pairs. Waiting times are first-passage times of drift-free Brownian motion from today's species to the human value. The same model is run backward as a hindcast from the Paleocene.
Results, Part 1: innovations
Odds ratio of being singular per tenfold increase in age (Firth regression; 95% profile interval; permutation p).
| Version of Vermeij's list | n | Odds ratio | p | Fisher p at 543 Ma |
|---|---|---|---|---|
| As published | 77 | 3.20 (1.20-9.82) | 0.014 | 0.00008 |
| 2026 re-coding, strict | 77 | 3.50 (1.30-11.0) | 0.008 | 0.00008 |
| 2026 re-coding, by function | 77 | 3.47 (1.18-11.6) | 0.012 | 0.0002 |
| Without the 7 rows dated 3.5 Ga or older | 70 | 1.89 (0.63-7.76) | 0.22 | 0.0008 |
| Phanerozoic only | 53 | 0.49 (0.14-1.74) | 0.30 | - |
| Phanerozoic without human language | 52 | 1.86 (0.22-40.6) | 0.54 | - |
| Precambrian only | 24 | 1.64 (0.18-16.0) | 0.65 | - |
| Seven body-plan rows as one event | 71 | 2.94 (1.05-9.29) | 0.021 | 0.008 |
| Stem-lineage clusters once | 71 | 1.75 (0.64-5.73) | 0.26 | 0.008 |
| LUCA, LECA and body plan each once | 67 | 1.44 (0.51-5.00) | 0.47 | 0.125 |
- The replication is exact: 15 of 23 singular and 9 of 54 repeated rows are dated before 543 Ma. Vermeij's text says 14 of 23 and 55 repeated; his printed tables give 15 and 54.
- The association sits in the rows dated 550 Ma or older. Fractions singular by era: 1 of 5 (younger than 66 Ma), 3 of 18 (66-252 Ma), 4 of 30 (252-543 Ma), 7 of 12 (543-1,000 Ma), 8 of 12 (older than 1 Ga).
- A step fits better than a gradient (log-likelihood -38.4 against -43.9) with the best cut between the rows Vermeij dated 540 and 550 Ma. The cut is a fitted parameter. The step is better by more than 3 units only for cuts between 520 and 600 Ma and by more than 1 unit for cuts between 430 and 600 Ma. After collapsing all three trait clusters the best step is 2.5 units better and moves to about 1.8 Ga, so the Cambrian step is a property of the animal body-plan rows.
- No trend is detectable within either eon, but the intervals (0.2-41 and 0.2-16) do not exclude one. The Phanerozoic value of 0.49 is produced by one row, human language.
- With the fullest collapse the contrast at 543 Ma is not significant (p = 0.125); at 1 Ga it is nominally so (p = 0.040). So the direction survives and the strength does not.
- Extended list: all 38 rows give 0.71 (0.38-1.27); counting the four Homo-lineage rows once gives 1.41 (0.57-4.58, p = 0.44); excluding everything younger than 5 Ma gives 5.5 (1.3-39). The sign depends on how the human rows are treated.
Recurrence. Of the 13 hard-step rows, 8 are singular with no known second origin (abiogenesis, oxygenic photosynthesis, eukaryogenesis, meiotic sex, animal-grade multicellularity, human-grade brain, language, cumulative culture), 2 are contested (a mitochondrion-like organelle, neurons) and 3 are repeated (primary plastid: 2 origins; complex multicellularity: 5-8; colonisation of land: 5-25). Upper limits for the oldest singular ones are 0.75 per Gyr (abiogenesis), 1.1 (oxygenic photosynthesis) and 1.8 (eukaryogenesis). Old repeated innovations have rates in the same range: DNA replication 0.25, phototrophy 0.29, primary plastid 0.63, aerobic respiration 0.74, carbon fixation 1.6 per Gyr. Old singular and old repeated innovations therefore cannot be distinguished, but the limits lie above the hard-step regime by construction, so they cannot test hard-step models either way.
Illustration only: the ratio of the Phanerozoic singular fraction (7 of 52) to the Precambrian one (15 of 24) is 0.22, and 0.21-0.47 across cuts and collapses. Reading it as the share of old singular innovations that are genuinely unique assumes the two halves of the list are the same kind of thing, which they are not. The true value could be anywhere from 0 to 1.
Results, Part 2: brains
Living mammals. Human EQ is 6.41. The highest non-human value is 5.52 (northern right whale dolphin; one record with no sample size), 0.86 of human. Among species with at least three brains measured the highest is 4.71 (Pacific white-sided dolphin), 0.73 of human. With a 1,350 g human brain these become 0.80 and 0.68.
| Within this factor of human EQ | 1.5 | 2 | 3 |
|---|---|---|---|
| Species, all records | 8 | 24 | 99 |
| Species with at least 3 brains | 2 | 8 | 43 |
| Families, all records / at least 3 brains | 1 / 1 | 5 / 4 | 15 / 10 |
| Lineages separate at least 30 Myr | 1 | 3 | 5 |
| Lineages separate at least 20 Myr | 1 | 4 | 10 |
| Lineages separate at least 10 Myr | 1 | 5 | 20 |
Requiring a species with at least three brains lowers the factor-2 lineage counts to 2, 3 and 4. Within a factor 1.5 there is one lineage, the dolphins. Within a factor 2 there are dolphins plus porpoises, spider monkeys, capuchins and, on single records only, macaques. Requiring both EQ and absolute brain mass to be at least half the human value leaves 15 species (5 with at least three brains), all dolphins and porpoises. Species-level parsimony on the tree gives 7-11 origins within a factor 2, but most of those are noise inside young families and I do not use them.
Neurons. Humans have 16.3 billion cortical neurons by the fractionator. No non-human species has a measured count within a factor of 2. Within a factor of 3 the measured counts are chimpanzee (6.5 billion) and African elephant (5.6 billion); the two species within a factor 2 in the table are gorillas by rule prediction only. Across 29 species the rules predict a median of 1.13 times the measured count (10-90% range 0.76-1.86), and the primate rule over-predicts humans by 30-50%. Under these rules a non-primate would need a brain of 23-48 kg to reach the human count, against 8.2 kg for the largest brain in the dataset, so that route is closed and no waiting time is given for it. Stereology disagrees: 12.8 billion for the minke whale against 3.2 billion by the fractionator, and 15 and 37 billion for the harbour porpoise and pilot whale. The largest bird count is 1.9 billion pallial neurons (a macaw).
Through time. Maximum EQ of non-hominin mammals by bin: Paleocene 0.34, Eocene 1.23, Oligocene 1.37, Miocene 3.46, Plio-Pleistocene 4.50, Recent 5.52. The slope is 0.042 per Myr in ln EQ (bootstrap 0.038-0.048), a doubling every 16 Myr, and 0.037 (0.027-0.047) with every bin rarefied to 10 specimens. The record-holder changes clade at most steps (a multituberculate, a primate, two toothed whales, a dwarf island elephant, a dolphin), and the bins are small and clade-targeted, so this is an average over a stepped series and should not be extrapolated. The first fossil within a factor 3 of human EQ is at 18 Ma and within a factor 2 at 16 Ma (both the dolphin relative Kentriodon). Fossil cetacean maxima are flat from 16 Ma (3.46) to 4 Ma (3.56); the data cannot distinguish a slow rise from a plateau since about 15 Ma. Hominin EQ rose at 0.25 +/- 0.02 per Myr, about six times the envelope slope. Homo heidelbergensis (5.67) exceeds every living dolphin record; H. habilis (4.90) and H. erectus (5.10) exceed every dolphin with at least three brains measured.
Rates and waiting times. The plain Brownian rate of ln EQ is 0.0059 per Myr. With a measurement-noise term it is 0.0022 (0.0020-0.0025), with fitted noise of 0.15 in ln EQ per species; sister-species pairs give 0.0009. Simulated data with the fitted rate and noise return 0.0049-0.0062 for the plain estimator, so the plain rate is inflated about 2.7-fold by noise. The observed sister-pair value is below its simulated range (0.0014-0.0025), which means one Brownian rate plus noise does not describe the data at all time depths. I keep both corrected rates as bounds.
| Median wait in Myr (10-90% range) | Plain rate | Noise-corrected | Sister pairs |
|---|---|---|---|
| Any mammal reaches human EQ, all records | 1.1 (0.4-2.4) | 1.5 (0.5-3.5) | 22 (8-50) |
| Same, species with at least 3 brains | 3.4 (1.3-9.0) | 4.7 (1.8-15) | 63 (27-135) |
| Land mammals only | 10 (6-17) | 46 (25-72) | 97 (53-154) |
| Land mammals, at least 3 brains | 14 (7-23) | 59 (30-99) | 127 (62-211) |
| Another primate reaches a 942 g brain | 18 (7-40) | 21 (9-46) | 34 (14-75) |
| Another primate reaches human brain mass | 32 (14-58) | 37 (16-67) | 61 (27-110) |
(942 g is the brain mass at which the primate rule predicts the human neuron count.) The waits run from a few Myr to about 200 Myr, all well below 1 Gyr. They are for a second lineage in a biosphere that already has large-brained mammals. The model has no ceiling and no drift, and the short waits are reached mainly by small dolphins whose EQ is high partly because they are small. Run from the Paleocene, the same model gives a probability of 0.003 (plain rate) or 2e-12 (noise-corrected) that any of 5,000 lineages reaches half the human EQ in 61 Myr, yet several did. A model that fails backward has no standing as a forecast.
Technology. A hand-coded table of large-brained lineages gives 65 lineage-Myr without technology, hence a 95% upper limit of 0.046 per lineage per Myr on the hazard, and no lower limit. Under log-uniform priors the mean probability of technology within 1 Gyr is 0.22-0.78, set entirely by where the prior's floor is put.
Figures
Reproducibility
python3 code/run_all.py downloads missing files and
rebuilds everything; --offline skips downloads (about 85 s,
single thread). The headline numbers are also written to
data/headline_numbers.csv. A fresh download of all 19
sources into an empty directory reproduced every derived table byte for
byte; that run preceded two last small edits (wording of the headline
table and the summary keys of the step scan), after which the pipeline
was rerun offline. Europe PMC was very slow at the time, and in that
test two pipeline runs shared the empty directory, so between them every
file came from the network but no single run fetched all 19.
Response to referee
| Point | Verdict | What I did |
|---|---|---|
| M1 juvenile dolphin record | Accepted | Checked adult mass independently (180-300 kg), flagged and excluded the record, reran. Headline now 0.73-0.86 (0.68-0.80 with a 1,350 g human brain). Counts for species with at least 3 brains reported beside all-record counts (2 and 8 species, 4 families within a factor 2), matching the referee's. |
| M2 base rate | Accepted | Removed from headline, key numbers and Fermi implications. Kept in the body as an illustration with the range across cuts and collapses and the statement that the true value is 0 to 1. Posterior on the number of hard steps deleted. |
| M3 step claim | Accepted, with corrected numbers | Reworded as the referee asked. Added the sensitivities without the oldest rows and with collapsed clusters, the scan of cut positions, and the note on Vermeij's 14 against the table's 15. Two of the referee's specific figures are not what the code gives (see rejected points). |
| M4 recurrence limits | Accepted | "The same thing" replaced by "cannot be distinguished; the limits lie above the hard-step regime by construction". "Does not support" replaced by "cannot test". Added the caveat on rates for old repeated innovations. |
| M5 waiting times | Accepted, one part differs in size | Added a noise-corrected rate (joint fit) and a sister-pair rate, with a simulation check. Deleted the non-primate neuron wait, the claim that the waits are conservative, and the 0.7 Myr figure. Range restated as a few Myr to about 200 Myr, conditional, with the failed hindcast. Added the fall of EQ with body mass among dolphins. |
| M6 integrator outputs | Accepted | Both outputs reworded as the referee specified; 0.9 and the 0.1 lower bound dropped; conditioning stated. |
| m1 origin counts | Accepted | Lineages separate for 10, 20 and 30 Myr now lead; parsimony ranges moved to a robustness note. |
| m2 plateau | Accepted | Wording changed; crown-fossil test added (n = 4, p = 0.26); Fig. 3 retitled. |
| m3 neuron counts | Accepted | Measured counts now substituted in the code; rule check reported; "no measured count within a factor 2" stated. |
| m4 endocast conversion | Partly | Conversion made taxon-specific; the 8% figure does not apply to hominins (see rejected points). |
| m5 clade-targeted bins | Accepted | Bin composition tabulated and stated; median comparison across bins labelled as not like-for-like. |
| m6 extended list | Accepted | Homo rows counted once in a new test; agriculture and large-brain rows annotated; list labelled a sensitivity check. |
| m7 Upham tree | Accepted, premise corrected | Checked the DNA-only tree: it shows the same anomaly. Remark removed from the novelty list. |
| m8 Vermeij source | Accepted | Provenance note added to fetch_data.py. |
| Citations | Accepted | "Mussini (accepted 2023)" removed (not found). Bains & Schulze-Makuch 2016 and Rospars 2013 confirmed and added; Schwartzman & Middendorf 2011 confirmed to exist, journal details not confirmed. Novelty claim lowered. |
Required changes 1-15 map onto these rows: 1 = m9; 2-3 = M1; 4 = m1; 5 = M2; 6 = M3; 7 = M4; 8 = M5; 9 = envelope (the "3 Myr ahead" statement and the 3-5 Myr envelope wait are deleted, clade switching and the island dwarf are stated); 10 = m2; 11 = m3; 12-13 = M6; 14 = citations; 15 = m4, m7, m8.
Does the headline survive? The soft version does: singular innovations are concentrated early and singularity alone is weak evidence of improbability; three textbook steps are repeated; near-human relative brain size arose in three or four mammal lineages; the data say nothing about the step from brain to technology. The quantitative first-pass headline does not.
Closest prior work and what is new
Closest prior work. Part 1: Vermeij 2006 (PNAS 103:1804), whose age test this study replicates; Bains & Schulze-Makuch 2016 (Life 6:25), who already sort key innovations by whether they arose once or many times and conclude most are many-paths; Mills, Macalady, Frank & Wright 2025 (Sci. Adv. 11:eads5698), who argue against hard steps using information loss and incumbency. Part 2: Russell 1983, Marino, McShea & Uhen 2004, Lineweaver 2008, Bogonovich 2011, Schwartzman & Middendorf 2011 and Rospars 2013 on encephalization trends and the repeatability of intelligence; van Schaik et al. 2021 (bioRxiv 2021.02.15.431238) on EQ falling with body size within orders; Avelino-de-Souza et al. 2025 (J. Comp. Neurol.) on the gap between fractionator and stereology neuron counts in whales.
What is new. The broad conclusions are not new. What I did not find in a limited web search is (a) a reanalysis of Vermeij's own tables showing that his age effect depends on counting co-inherited stem-lineage traits as independent rows (odds ratio 3.2 falls to 1.4, interval including 1, when three trait clusters are counted once) and that no trend is detectable within either eon; (b) counts of lineages near human relative brain size that are filtered by record quality (at least three brains measured) and by lineage age, set beside measured rather than rule-predicted neuron counts; (c) a Brownian rate of relative brain size with an explicit measurement-noise term, checked by simulation, together with a hindcast showing that drift-free diffusion cannot reproduce the Cenozoic rise. The remark about the Upham et al. tree files is a data-quality note, not a finding.
Confidence that it is new: medium
Limitations
- Code, data tables and figures on disk are final and mutually consistent. This is the only reason the status is 'partial'.
- Vermeij's list is one author's selection. Its Phanerozoic rows are mostly minor morphological traits and its Precambrian rows are major transitions, and 'singular' often means 'defines a clade'. How to group co-inherited traits is a judgement; I report three groupings and the result depends on which is used (Fisher p = 0.008 for two of them, 0.125 for the third at 543 Ma, 0.040 for the third at 1 Ga).
- The Vermeij tables cannot be re-downloaded by script; they were transcribed once from the PMC page and are committed as a CSV (the referee checked the transcription row by row). The extended list of 39 innovations was chosen by me and 18 rows were written from memory without a fetched source.
- Recurrence-rate limits are uninformative about hard steps by construction, and rates for repeated ancient innovations assume the second origin had the whole interval available.
- EQ is not brain hardware. It is a body-size-corrected ratio; among living dolphins and porpoises it falls with body mass (slope -0.18, p = 2e-5), so a lineage can raise EQ by getting smaller, and the highest fossil value before humans is a dwarf island elephant.
- Extant brain data are mostly single records: only 459 of 1,547 species have at least three brains measured, and maxima of noisy single records are biased upward. The human reference record (1,250 g) is on the low side of commonly used values.
- Cortical neuron counts exist for about 30 mammal species. All other counts in the lineage table are scaling-rule predictions (10-90% range of predicted over measured: 0.76-1.86), and the two counting methods disagree by a factor of 4 for the one whale measured both ways.
- Fossil time bins are small and clade-targeted (Miocene: 34 of 35 specimens are cetaceans; Plio-Pleistocene: 5 cetaceans and 9 proboscideans; no Oligocene-Miocene primates and no Mesozoic taxa). Fossil body masses are estimated from skeletons. The data cannot distinguish a slow rise in cetacean EQ from a plateau since about 15 Ma.
- Hominin EQs rest on assumed body masses (10 hand-entered values) and on an endocast-to-brain-mass conversion; switching conversion changes them by 1-8%.
- The waiting-time model is a caricature: no drift, no ceiling, one rate per clade, and it fails its hindcast. The noise-corrected and sister-pair rates differ by a factor of 2.4 and simulation shows this is not estimator scatter alone, so the Brownian-plus-noise model is itself misspecified. All waits are conditional on a biosphere that already contains large-brained mammals.
- The technology hazard limit comes from a hand-coded table of five lineages with rounded exposure times. It is a judgement, not a measurement, and it gives no lower limit.
- All large-brained candidates share one mammalian brain plan and one 66-Myr window (Lineweaver's objection); the bird data (maximum 1.9 billion pallial neurons, a macaw) are a second but much smaller sample.
- A clean re-download of all 19 scripted sources reproduced every derived table byte for byte, but that run preceded two last small edits (wording of the headline table; summary keys of the step scan). The files on disk come from an offline rerun after those edits.
What it means for the Fermi question
Two outputs for the integrator, both stated as what the data allow rather than as measurements.
(i) Number of hard steps. The convergence record removes primary plastid acquisition, complex multicellularity and colonisation of land from the list of hard steps: each has arisen more than once. Abiogenesis, oxygenic photosynthesis, eukaryogenesis and human-level cognition or language each have one known origin, and recurrence data cannot test any of the four, because a one-off event 2-4 billion years old gives the same weak upper limit whether its true rate is 1 or 0.001 per billion years. The compatible range is therefore 0 to 4 (0 to 5 if animal-grade multicellularity is counted as its own step). Being singular and ancient is weak evidence of improbability: in Vermeij's list the excess of old singular innovations largely disappears when traits inherited together from one stem lineage are counted once. My judgement, labelled as judgement and not derived from these data, is 1 to 2 hard steps, with eukaryogenesis the best supported. The first-pass statement 'about 1 real hard step among 4, P(3 or more) = 0.06' is withdrawn.
(ii) Probability that a biosphere with complex animals produces a technological species within about a billion years. Not constrained by these data. Enlargement of relative brain size within mammals looks repeatable: three or four long-separate lineages are within a factor of 2 of humans, the maximum outside hominins rose about 15-fold over the Cenozoic, and every model run gives waits of a few million to about 200 million years for another lineage to reach the human value. That holds for relative brain size, less clearly for neuron number (no measured non-human count within a factor of 2), and only given that large-brained mammals already exist, which is not the conditioning the Fermi question needs. It is likely, as a judgement, that brain hardware of the human grade would recur on Earth within some hundreds of millions of years; I no longer attach a number such as 0.9 to that. The step from large brain to technology has an upper limit on its hazard and no lower limit. A prior centred near 0.5 is my choice; the data are equally compatible with values well below 0.1. On the question as posed, Earth supplies one number: about 540-600 million years from the first animals to technology, with no mammal within a factor of 3 of human relative brain size in this dataset before 18 million years ago.
Changes made after the referee report
- Flagged and excluded the white-beaked dolphin record (body mass 67.5 kg against an adult range of 180-300 kg, verified independently); the headline ratio to the human EQ is now 0.73 (species with at least 3 brains) to 0.86 (single record), not 0.88.
- Added a record-quality column (at least 3 brains measured) and report every species, family and lineage count both for all records and for well-sampled species.
- Replaced species-level 'independent origins' with counts of lineages separate for 10, 20 and 30 Myr (tree cut at those depths); parsimony origin ranges kept as a robustness note only.
- Withdrew the base-rate estimate (23%, 11-46%) and the posterior on the number of hard steps; the ratio is kept in the body as a labelled illustration with its range across cuts and collapses (0.21-0.47).
- Added three collapses of co-inherited traits in Vermeij's list (body-plan rows; stem-lineage clusters; LUCA, LECA and body plan each once), profile-likelihood intervals, the test without rows dated 3.5 Ga or older, the Phanerozoic test without human language, and a scan of every step position against the gradient, including after collapsing.
- Reworded the step claim: association concentrated in rows dated 550 Ma or older; no trend detectable within either eon but not excluded; noted that Vermeij's text gives 14 where his table gives 15.
- Reworded the recurrence-rate conclusion: old singular and old repeated innovations cannot be distinguished, and the limits cannot test hard-step models; added a column marking limits that lie above the hard-step regime.
- Extended list: the four Homo-lineage rows are counted once in a new test; agriculture and large-brain rows annotated.
- Neuron counts: measured counts now replace rule predictions in the lineage table wherever they exist; added the rule check (median predicted/measured 1.13) and the statement that no non-human species has a measured count within a factor 2.
- Endocast volumes are now converted to brain mass by taxon (Ruff et al. 1997 for hominins; 1.0 g/cm3 for Paleogene placentals) with 0.92 g/cm3 as a sensitivity case.
- Rates: added a Brownian rate with a jointly fitted measurement-noise term, a sister-species-pair rate, and a simulation check of all estimators; waiting times are reported under four rates and for well-sampled species only.
- Deleted the non-primate neuron waiting time (the route needs a 23-48 kg brain), the envelope-extrapolation waits, the '3 Myr ahead of trend' statement, the 0.7 Myr figure and the claim that the diffusion waits are conservative.
- Waiting-time range restated as a few Myr to about 200 Myr (medians 1.1-127 Myr), conditional on existing large-brained mammals, with the failed hindcast stated beside it.
- Added the test showing EQ falls with body mass among living dolphins and porpoises, the joint EQ-and-brain-mass criterion, the composition of each fossil bin, a rarefied envelope slope, and a crown-fossil-only plateau test; plateau wording changed.
- Technology: probability sketch extended over prior floors to show the answer (0.22-0.78) is set by the prior; the 0.1 lower bound and the 0.9 hardware figure are dropped.
- Checked the Upham et al. DNA-only tree for the cetacean anomaly (present there too) and removed the remark from the novelty list; added a provenance note that Vermeij's tables are not fetched by script.
- Removed the unverifiable 'Mussini (accepted 2023)' citation; added Bains & Schulze-Makuch 2016, Rospars 2013 and Schwartzman & Middendorf 2011 as prior work; lowered the novelty claim.
- All five figures regenerated with new titles and annotations (hollow markers for co-inherited rows in Fig. 1; 'limits cannot test hard steps' note in Fig. 2; clade-switching and small-bin caveat in Fig. 3; lineage counts by record quality in Fig. 4; noise-corrected curves and hindcast caveat in Fig. 5).
- Added data/headline_numbers.csv (every headline number, written by run_all.py) and data/upham_tree_check.json; reran the whole pipeline so that all 26 data files and 5 figures match the final code.
- Both integrator outputs rewritten as the referee specified: hard-step range 0-4 with 1-2 labelled as judgement; probability of technology stated as not constrained by these data.
Referee points not accepted
- m4, in part: the referee says fossil hominin EQs were about 8% too high because endocast volume was entered as grams. The 0.92 g/cm3 ratio he cites is the one used for proboscideans and cetaceans. For hominins the Ruff, Trinkaus & Holliday (1997) formula (brain mass = 1.147 x volume^0.976) gives 0.97-0.99 g/cm3 over the range 386-1,175 cm3, so the first-pass hominin EQs were 1-3% high, not 8%. I adopted the taxon-specific conversion and report 0.92 as a sensitivity case (hominin EQs 8% lower, envelope slope 0.044 instead of 0.042).
- Required change 6, two specific figures: (a) the referee writes that counting the seven animal body-plan rows as one event gives 5 of 14 against 8 of 53, p = 0.12. Collapsing only those seven rows gives 9 of 18 Precambrian rows singular against 8 of 53, Fisher p = 0.008, odds ratio 2.94 (1.05-9.29). His table needs the LUCA and LECA rows collapsed as well; I report all three collapses. (b) He writes that a step beats the gradient only for cuts between about 530 and 560 Ma. My scan of every cut position gives a higher step log-likelihood for cuts from 390 Ma to 2.7 Ga, by more than 1 unit for 430-600 Ma and by more than 3 units for 520-600 Ma. His own value at 610 Ma (-43.5) agrees with mine, so the difference is in the stated interval, not the arithmetic. The substance of his point stands: the step belongs to the body-plan rows.
- m7, premise: the referee attributes the misplaced cetaceans to the 'completed' Upham et al. tree, which includes species placed without DNA, and suggests the DNA-only tree as the check. The DNA-only MCC file shows the same thing: baleen-toothed whale split at 16.6 Ma (17.7 Ma in the completed file, 33.6 Ma in the primary tree) and the northern right whale dolphin joined to the blue whale at 3.7 Ma. I still removed the remark from the novelty list, as he asked, because it is a property of two distributed files and not a finding about brains.
- M5, size of the noise correction: the referee's sister-pair estimate implies rates 2-5 times too high (0.0012 against 0.0059 for all mammals, about 0.006 against 0.020 for cetaceans from 11 pairs). A joint fit of rate and measurement noise on the whole tree gives 0.0022 (0.0020-0.0025) for mammals, a 2.7-fold correction, and 0.014 (0.009-0.024) for cetaceans, a 1.4-fold correction. In simulation the whole-tree estimator recovers the true rate (0.0020-0.0024 for a true 0.0022) while the sister-pair estimator scatters (0.0014-0.0025). I therefore use the whole-tree value as the main corrected rate and keep the sister-pair rate (0.0009 by my calculation) as the slow bound. This is not a full rejection: the observed sister-pair value lies below its simulated range, so the referee is right that recent divergences show less change than the whole-tree rate implies, and the report says so.
Code
Every number above is produced by these scripts from public data. The data tables themselves are not hosted here; the scripts download them.
build_innovations.py build_transcribed.py extract_data.py fetch_data.py part1_innovations.py part2_brains.py phylo.py plotstyle.py run_all.py
Referee report
A second, separate analysis re-ran the code, recomputed the main numbers by its own route and tried to break the result. Like the first, it was run by Claude for this project; it is not an outside expert. In its report “the analyst” is the first analysis, which wrote the paper, and file names that are not linked on this page are its own working files. The paper above is the version revised in response.
Verdict: sound with fixes. Results reproduced: yes.
Ran run_all.py in a scratch copy twice: offline against the analyst's raw files (76 s) and from a fresh download of all 18 scripted sources into an empty directory (57 s, no download failures). Both runs gave all 23 generated data tables byte-identical to the analyst's, and the four printed headline numbers match. Figures regenerate (PNG bytes differ; not chased). The Vermeij transcription matches the saved PMC tables row for row. Independent recomputation by my own scripts: Firth odds ratio 3.20 with profile-likelihood CI 1.20-9.82 (analyst: Wald 1.12-9.16); Fisher p 0.0048 and 0.00008; step vs gradient log-likelihood -38.4 vs -43.9; human EQ 6.41, top non-human 5.64, 9/25/100 species within x1.5/x2/x3 from the raw Burger CSV; envelope slope 0.0422 per Myr (0.037 rarefied to n=10 per epoch); land-mammal diffusion waits 10.5 and 28.6 Myr; Upham tree crown Cetacea 17.69 Ma confirmed with a second parser.
Strongest objection
Both quantitative results come from treating things as interchangeable that are not. Part 1 uses the singular fraction among minor Phanerozoic traits as the base rate for the major Precambrian transitions and counts co-inherited stem-lineage traits as independent trials. Part 2 uses EQ, a body-size-corrected ratio that small dolphins and monkeys reach partly by being small, as 'hominin-level brain hardware', and counts noisy species inside one family as independent origins; on neuron number no independent lineage is within a factor 2 of humans, and all candidates share one mammalian brain plan and one 66-Myr window (Lineweaver's point). The soft conclusion survives: singular innovations are concentrated early so singularity alone is weak evidence of improbability; plastid acquisition, complex multicellularity and land colonisation are repeated; large relative brains arose in three or four mammalian lineages; the data say nothing about the step to technology. The quantitative version does not survive: the 23% base rate, 'about 1 hard step among 4', '88%', '7-9 origins', '1-100 Myr', 'P(hardware) >= 0.9' and the lower bound of 0.1.
Errors found
- major. The record behind 'a living dolphin reaches
88% of the human EQ' is not an adult animal. Lagenorhynchus albirostris
enters with brain 1,126 g and body 67.5 kg (single record, no sample
size).
- Evidence: Adult white-beaked dolphins weigh about 180-350 kg (ASCOBANS review, Duke SEAMAP, Kahaku); calves about 40 kg. At 180-300 kg the same brain gives EQ 2.1-2.9, i.e. 0.33-0.46 of human. Without the record the top is Lissodelphis borealis 5.52 (0.86, also a single record); among species with >=3 brains the top is L. obliquidens 4.71 (0.73), with 2 species within x1.5 and 8 species in 4 families within x2. Burger's human record is 1,250 g; with 1,350 g all ratios drop 8%. 12 of the top 25 non-human records have no sample size.
- Fix: Flag and exclude the record in extract_data.py FLAGS, re-run, and state the top non-human EQ as about 0.73 (well-sampled species) to 0.86 (single records) of human. Report counts for n>=3 records beside the full counts.
- major. The base-rate figure, P(genuinely unique |
singular and Precambrian) = 0.23 (0.11-0.46), is arithmetic under an
exchangeability assumption the list violates, and its interval is
binomial error only.
- Evidence: Phanerozoic rows are mostly minor morphological traits (labral tooth, crab heterochely, sand-dollar eccentricity) whose 7 singular members are clade-defined structures; Precambrian rows are the major transitions, and 13 of the 15 singular ones are co-inherited traits of three stem lineages (4 LUCA, 2 LECA, 7 animal body-plan characters at 550-600 Ma). The ratio moves 0.21-0.38 with cut and collapsing; the real uncertainty is the assumption (0 to 1).
- Fix: Remove the 23% figure, the P(k) values and 'about 1 real hard step among 4' from headline, key numbers and Fermi implications. If kept, present as an illustration under an explicit untested assumption, with the 0.21-0.38 range and a statement that the true value could be anywhere from 0 to 1.
- major. 'A step at the Proterozoic-Phanerozoic
boundary, absent within either eon' overstates the evidence.
- Evidence: The step beats the gradient only for cuts between about 530 and 560 Ma (cut at 610 Ma: -43.5 vs gradient -43.9); the 543 Ma cut falls between Vermeij's round '550 Ma' and '540 Ma' rows. The Phanerozoic OR of 0.49 is produced by one point (human language, 1 Ma); without it OR 1.9, profile CI 0.22-41. Precambrian-only CI 0.18-16. Both include the pooled 3.2. Dropping the seven rows dated >=3.5 Ga gives OR 1.9 (0.55-6.6), p=0.22 (computed by the analyst, not reported in the text). Counting the seven animal body-plan rows as one event gives 5/14 vs 8/53, Fisher p=0.12.
- Fix: Reword to: the association is concentrated in rows dated 550 Ma or older; no trend is detectable within either eon but the intervals do not exclude one. Report the two sensitivities above. Note that Vermeij's text says 14 singular before 543 Ma while his table gives 15.
- major. Recurrence-rate limits are read as showing
ancient unique and ancient repeated innovations are 'statistically the
same thing' and that the record 'does not support' four or five hard
steps.
- Evidence: A 95% upper limit of 3/age is 0.75 per Gyr at 4 Ga whatever the true rate; a step with rate 0.001 per Gyr gives the same limit. The limits lie above the hard-step regime (<0.2 per Gyr) by construction, so they cannot test it.
- Fix: Replace with 'cannot be distinguished' and 'cannot test such models'.
- major. The waiting-time models do not support
'every model gives 1-100 Myr'. Brownian rates are inflated by
measurement noise, one row has a physically impossible target, the model
fails its own hindcast yet is called conservative, and EQ can rise by
body shrinkage.
- Evidence: Among 402 sister pairs the rms difference in ln EQ is 0.23 at <2 Myr of branch length and 0.28 at 20-200 Myr, implying tip noise of about 0.15 and a noise-corrected rate near 0.0012 per Myr against the analyst's 0.0059 and 0.0024 (waits 2-5x longer). The 0.7 Myr wait rises to 1.8 Myr without the three top single-record dolphins. Under the IF rules a non-primate needs a 23-48 kg brain (largest known is under 10 kg) yet gets a 32-44 Myr wait. Hindcast P=0.003. Within living delphinoids ln EQ falls with ln body mass (slope -0.18, p<0.0001).
- Fix: Add a noise-corrected rate; delete the non-primate IF-neuron wait and say that route is effectively closed under those rules; delete 'the diffusion waits are conservative'; restate as 'a few Myr to a few hundred Myr for a second lineage in a biosphere that already has large-brained mammals, from models with no ceiling that fail a hindcast'.
- major. The two integrator outputs are judgements
with unsupported bounds. The upper bound of 3 hard steps comes from the
base-rate calculation; the lower bound of 0.1 on P(technology) has no
empirical basis; P(hardware) >= 0.9 rests on EQ only; the
conditioning is 'given large-brained mammals already exist', not 'given
complex animals'.
- Evidence: The study's own exposure table gives only an upper limit on the technology hazard and 'no lower bound', so there is no lower bound on the probability. Four candidates remain singular and unrefuted (abiogenesis, oxygenic photosynthesis, eukaryogenesis, human-level cognition/language). On IF neuron number no independent lineage is within x2 of humans.
- Fix: (i) State: convergence removes plastid acquisition, complex multicellularity and land colonisation from the hard-step list; 0-4 candidates remain open; 1-2 is the analyst's judgement. (ii) State: not constrained by these data; a prior near 0.5 is a choice and values well below 0.1 are equally compatible; drop the 0.9 figure and state the conditioning.
- minor. Species-level parsimony counts of
'independent origins' are noise inside families: the 4-5 origins within
x1.5 are all in Delphinidae.
- Evidence: All 9 species within x1.5 are delphinids; within x2 the families are Delphinidae, Phocoenidae, Atelidae, Cebidae, Cercopithecidae.
- Fix: Lead with deep lineages: 1 within x1.5; 3-4 within x2 (delphinoids, one or two platyrrhine lineages, macaques), plus the extinct dwarf elephant.
- minor. 'No plateau detected' in delphinoids is
weak.
- Evidence: Fossil cetacean maxima are flat from 16 Ma (3.46) to 4 Ma (3.56). The slope (p=0.03-0.04) compares 8 fossils with skeletal mass estimates against 25 weighed living species and vanishes with crown-group fossils only (n=4, p=0.23). Marino et al. 2004 describe two step increases, the second by 15 Ma.
- Fix: Say the data cannot distinguish a slow rise from a plateau since about 15 Ma; drop the Fig. 3 title claim that hominins passed the dolphin level only in the last ~1 Myr.
- minor. Text and code disagree on neuron counts: the
text says measured values are used where they exist, but lineage_counts
uses rule predictions for every species.
- Evidence: The primate rule predicts 21-24 billion for humans against 16.3 measured and 8.2 for the chimpanzee against 6-7 measured. The '2 species within x2' are two gorilla species by prediction; no non-human has a measured count within x2.
- Fix: Substitute measured counts or correct the text, and state that no non-human species has a measured count within x2.
- minor. Endocranial volume is entered as brain mass
1:1 for hominins and Paleogene endocasts, while cetacean and
proboscidean tables use converted brain masses (about 0.92 g per cm3).
- Evidence: Benoit Table 1: 1,800 cm3 -> 1,652 g. Du and Bertrand volumes used as grams in load_fossils.
- Fix: Convert consistently; fossil hominin EQs are about 8% high relative to the living-human record.
- minor. Fossil epoch bins are clade-targeted and the
extended innovation list has pseudo-replicates and memory-quoted rows.
- Evidence: Miocene bin: 34 of 35 are cetaceans; Plio-Pleistocene: 5 cetaceans, 9 proboscideans; their medians exceed the Recent median. 18 of 39 extended rows are flagged L; the four human-lineage rows that cancel the association are one lineage counted four times; 'agriculture' counts 7 human centres.
- Fix: State these in the limitations next to the affected numbers; do not quote the 'median drift' as a like-for-like trend.
- minor.
- Evidence: 'Mussini (Int. J. Astrobiol., accepted 2023)' not found in three web searches or an arXiv author search. Bains & Schulze-Makuch 2016 (Life 6:25), Rospars 2013 (IJA) and Schwartzman & Middendorf 2011 are not cited. fetch_data.py does not fetch the Vermeij source (provenance note only; the committed CSV is correct).
- Fix:
Overclaims
- 'A living dolphin reaches 88% of the human EQ': rests on a record with a body mass a quarter to a third of adult mass; defensible range 0.73-0.86 (0.68-0.80 with a 1,350 g human brain).
- 'A base-rate argument implies only about 23% (11-46%) of ancient singularities need be genuine, i.e. roughly 1 real hard step among the four ancient candidates': assumption-driven arithmetic with a binomial-only interval.
- 'The effect is a step at the Proterozoic-Phanerozoic boundary, absent within either eon': the step depends on a cut between Vermeij's 550 and 540 Ma rows, and the within-eon intervals (0.2-41, 0.2-16) include the pooled slope.
- 'Ancient unique and ancient repeated are statistically the same thing' and 'the convergence record does not support models with four or five hard steps': upper limits cannot show sameness and cannot test hard steps.
- '25 within a factor 2 (7-9 independent origins)': 3-4 deep lineages.
- 'Every waiting-time model for a second lineage with hominin-level brain hardware gives 1-100 Myr': noise-inflated rates, one physically impossible target, a model that fails its hindcast, and EQ is not hardware.
- 'The diffusion waits are conservative': a model falsified by its hindcast has no standing forward.
- 'The human value is about 3 Myr ahead of the non-hominin trend' and the 3-5 Myr envelope wait: extrapolation of a six-point, clade-switching series across a gap set by one suspect record.
- 'No plateau is detected in delphinoids': fossil maxima are flat from 16 to 4 Ma; the data cannot distinguish a slow rise from a plateau.
- 'P(hardware recurs within 1 Gyr) roughly 0.9 or higher': judgement resting on EQ only and conditioned on large-brained mammals already existing.
- 'P(technological intelligence within 1 Gyr | complex animals) is 0.1-0.9, central ~0.5': a prior; the lower bound of 0.1 has no empirical support.
- 'Evidence-based range: 0-3 genuine hard steps': the upper bound comes from the base-rate calculation; the convergence evidence leaves 0-4 open.
- Novelty item: 'the Upham et al. MCC tree dates crown Cetacea at 17.7 Ma' presented as a data-quality finding without checking the DNA-only tree.
Novelty check
Novel: partly. The age test and both cuts are Vermeij's (2006); the re-run with exact and penalised statistics is a clean replication and should be reported as one. The step-versus-gradient comparison, within-eon tests, recurrence-rate limits and base-rate calculation were not found in the literature, but two do not survive as findings and one is uninformative by construction. Classifying candidate steps by number of origins overlaps Bains & Schulze-Makuch (2016), which the analyst did not cite. Arguing from encephalization trends to repeatability overlaps Russell (1983), Rospars (2013) and Schwartzman & Middendorf (2011). Useful new elements in Part 2: the explicit split between EQ and neuron number with the factor-of-4 method disagreement, lineage counts by threshold, and the hindcast showing drift-free diffusion fails. The Upham-tree remark is confirmed for the 'completed' 5,911-species file only and should not be listed as a finding without checking the DNA-only tree.
- Vermeij 2006, PNAS 103:1804 (the age test, both cuts)
- Mills, Macalady, Frank & Wright 2025, Sci. Adv. 11:eads5698 (information loss and incumbency alternatives; cites Vermeij without re-testing)
- Bains & Schulze-Makuch 2016, 'The Cosmic Zoo', Life 6:25 (classifies key innovations by single vs repeated origin; not cited by the analyst)
- Rospars 2013, Int. J. Astrobiol., 'Trends in the evolution of life, brains and intelligence' (not cited by the analyst)
- Schwartzman & Middendorf 2011, 'Multiple paths to encephalization and technical civilizations' (not cited by the analyst)
- Marino, McShea & Uhen 2004, Anat. Rec. 281A:1247 (two step increases in cetacean encephalization, second by 15 Ma)
- Lineweaver 2008, 'Paleontological tests: human-like intelligence is not a convergent feature of evolution'
- Bogonovich 2011, Int. J. Astrobiol., 'Intelligence's likelihood and evolutionary time frame'
- Russell 1983, Adv. Space Res. (maximum encephalization against time)
- Avelino-de-Souza et al. 2025, J. Comp. Neurol. (isotropic-fractionator minke whale count, 3.2 billion cortical neurons)
Required changes
- Flag and exclude the Lagenorhynchus albirostris record (body 67.5 kg against an adult range of 180-350 kg) in extract_data.py FLAGS and re-run. Replace '88% of the human EQ' with 'about 0.73 (species with three or more brains measured) to 0.86 (single records) of the human EQ; 0.68-0.80 with a 1,350 g human brain'.
- Report EQ counts for records with n>=3 beside the full counts: 2 species within x1.5 and 8 species in 4 families within x2, against 8 and 24 for all records after the fix.
- Replace '7-9 independent origins' in the headline with deep-lineage counts (1 within x1.5; 3-4 within x2) and move species-level parsimony ranges to a robustness note.
- Remove the base-rate result (23%, 11-46%; P(0)=0.35 ... P(>=3)=0.06; 'about 1 hard step among 4') from the headline, key numbers and Fermi implications. If kept in the body, label it an illustration under an untested exchangeability assumption, give the 0.21-0.38 range across cuts and collapses, and say the true value could be anywhere from 0 to 1.
- Reword the step claim: 'The association is concentrated in rows dated 550 Ma or older. A step fits better than a log-age gradient only for cuts between about 530 and 560 Ma. No trend is detectable within either eon, but the intervals (0.2-41 and 0.2-16) do not exclude one.' Add the two sensitivities: without the seven rows dated >=3.5 Ga the trend is OR 1.9 (0.55-6.6); with the seven animal body-plan rows counted as one event the 543 Ma contrast is 5/14 against 8/53, p=0.12. Note Vermeij's 14 against the table's 15.
- Replace 'statistically the same thing' with 'cannot be distinguished: the limits lie above the hard-step regime by construction', and 'does not support models with four or five hard steps' with 'cannot test such models'.
- Waiting times: add a noise-corrected Brownian rate and report waits under it; delete the 'IF neurons, non-primate' wait and state that under those rules a non-primate needs a 23-48 kg brain so the route is effectively closed; delete 'the diffusion waits are conservative'; replace 'every model gives 1-100 Myr' with 'a few Myr to a few hundred Myr, for a second lineage in a biosphere that already has large-brained mammals; the models have no ceiling and fail a hindcast'.
- Envelope: keep '0.042 per Myr (0.037 rarefied)'; delete 'the human value is about 3 Myr ahead of the non-hominin trend' and the 3-5 Myr envelope wait; state that the series switches clade at every step and ends on an island dwarf elephant.
- Replace 'no plateau detected' with 'the data cannot distinguish a slow rise from a plateau since about 15 Ma' and change the Fig. 3 title.
- Neuron counts: either substitute measured counts where they exist, as the text says, or correct the text to say all lineage-table counts are rule predictions and the primate rule over-predicts humans by 30-50%. State that no non-human species has a measured count within x2.
- Integrator output (i): change to 'The convergence record removes plastid acquisition, complex multicellularity and land colonisation from the list of hard steps. Abiogenesis, oxygenic photosynthesis, eukaryogenesis and human-level cognition or language remain singular; recurrence data cannot test any of the four. Compatible range 0-4. The analyst's judgement is 1-2, with eukaryogenesis the best supported.'
- Integrator output (ii): change to 'Not constrained by these data. Brain enlargement within mammals looks repeatable on timescales of Myr to hundreds of Myr on relative brain size, less clearly on neuron number. The step to technology has an upper limit on its hazard and no lower limit. A prior centred near 0.5 is the analyst's choice; the data are equally compatible with values well below 0.1.' Drop the 0.9 figure for P(hardware) and state the conditioning (given mammals with large brains already exist).
- Remove or supply a DOI for 'Mussini (accepted 2023)'. Add Bains & Schulze-Makuch (2016), Rospars (2013) and Schwartzman & Middendorf (2011) to prior work and lower the novelty claim for the hard-step classification.
- Smaller fixes: convert endocast volumes to brain mass consistently; drop the Upham-tree remark from the novelty list or check it against the DNA-only tree; note in fetch_data.py that the Vermeij source is not fetched; state next to the affected numbers that fossil bins are clade-targeted and that 18 of 39 extended rows are unverified.