Where is everybody? · Working papers
Sun-like stars that are too dim for their type
Revised after a second, separate analysis run for this project tried to break it. Neither analysis is an outside expert.
Underluminous stars: a limit on grey Dyson swarms from spectroscopic versus parallax luminosities
Revised after refereeing. Every number comes from the final code. Changes are listed under "Response to referee" at the end.
Result. A swarm of large ("grey") collectors that blocks a fraction f of a star's light makes the star fainter than its temperature, colour, metallicity and parallax allow, whatever happens to the absorbed energy. I searched for such stars among 790,783 FGK stars within 1 kpc (950,640 under the looser astrometric cuts I declared first). No star is consistent with 90% dimming. The 95% upper limits on the fraction of stars dimmed by f are:
| f | 95% upper limit | Stars it applies to |
|---|---|---|
| 0.25 | 5.3×10⁻⁴ to 1.9×10⁻³ | K and G dwarfs |
| 0.5 | 1.1×10⁻⁴ to 2.1×10⁻⁴ | FGK main-sequence stars (log g ≥ 4.1) |
| 0.75 | below 3.6×10⁻⁵ (3.0–4.1×10⁻⁵ over selection-model variants) | FGK dwarfs; subgiants alone 1.8×10⁻⁴ |
| 0.9 | below 3.9×10⁻⁵ (3.0–4.8×10⁻⁵) | FGK dwarfs; subgiants alone 2.2×10⁻⁴ |
The ranges at f ≤ 0.5 span two sets of astrometric cuts. The low end needs cuts that I tightened after seeing the faint tail, so the high end is the safe number. The main caveats are:
- The f ≤ 0.5 limits are set by 39 unexplained stars (136 under the looser cuts) that are 0.2–1.2 mag fainter than predicted. None was followed up and all are counted, so these limits measure the catalogue-error floor.
- Only grey swarms are covered, with waste heat cooler than about 400–600 K, around stars within 1 kpc at mostly |b| > 17°.
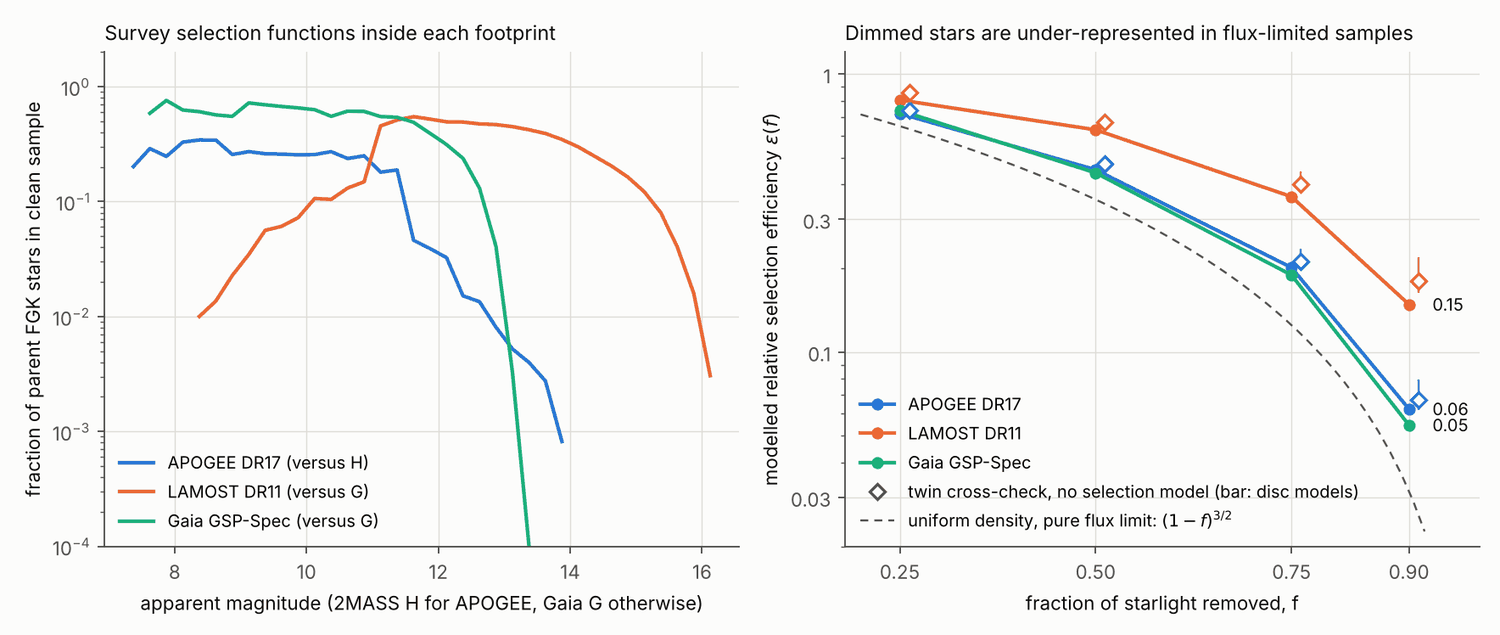
- The population limits use a modelled selection efficiency for dimmed stars (0.79 falling to 0.12). A cross-check that does not use the model gives values 3–22% higher, so the model is on the conservative side.
- At f = 0.9 the limit is weaker than the published infrared limit for 300 K swarms within 100 pc (2×10⁻⁵). What it adds is independence from the waste-heat temperature.
Data
All inputs are public and are fetched by
code/download_data.py.
- Spectroscopic parameters: APOGEE DR17 allStar (VizieR III/286), the LAMOST DR11 low-resolution A/F/G/K catalogue (VizieR V/162) and Gaia DR3 GSP-Spec (ESA archive). The spectra are independent, but all three share the same Gaia parallaxes and G/Ks photometry, so astrometric or photometric false positives are common to all.
- Astrometry and photometry: Gaia DR3, matched on each survey's own Gaia identifier, and 2MASS (unique match within 1″).
- Parent population: a 2% random sample of Gaia DR3 (612,690 stars with parallax > 1 mas).
- For candidates only: AllWISE, GALEX, Gaia DR2 parallaxes, GALAH DR3, RAVE DR6 and SIMBAD.
| Cut, applied in this order | APOGEE | LAMOST | GSP-Spec |
|---|---|---|---|
| Unique stars downloaded | 218,091 | 2,383,826 | 1,886,542 |
| Survey quality (a) | 184,018 | 2,327,343 | 868,552 |
| FGK box: 4000–6500 K, log g ≥ 3.5, −1 ≤ [Fe/H] ≤ 0.6 | 172,109 | 2,046,442 | 742,451 |
| Gaia 5/6-parameter solution, G/BP/RP present, not duplicated | 165,672 | 2,000,639 | 711,153 |
| Parallax > 1 mas and parallax/error ≥ 50 [≥ 20] | 138,725 [151,624] | 990,961 [1,212,051] | 665,039 [702,114] |
| E(B−V)_SFD < 0.1 | 108,972 [118,836] | 678,700 [835,694] | 381,038 [402,365] |
| RUWE < 1.2 [< 1.4] | 83,812 [94,374] | 578,792 [723,855] | 280,073 [315,630] |
| Clean image and photometry (b) | 79,995 [89,506] | 552,376 [686,400] | 271,170 [304,795] |
| 2MASS Ks quality A/B, unique match, error < 0.1 mag | 79,873 [89,373] | 548,841 [682,106] | 268,587 [301,862] |
| Populated parameter space (c) | 79,071 [88,525] | 548,373 [681,641] | 267,629 [300,931] |
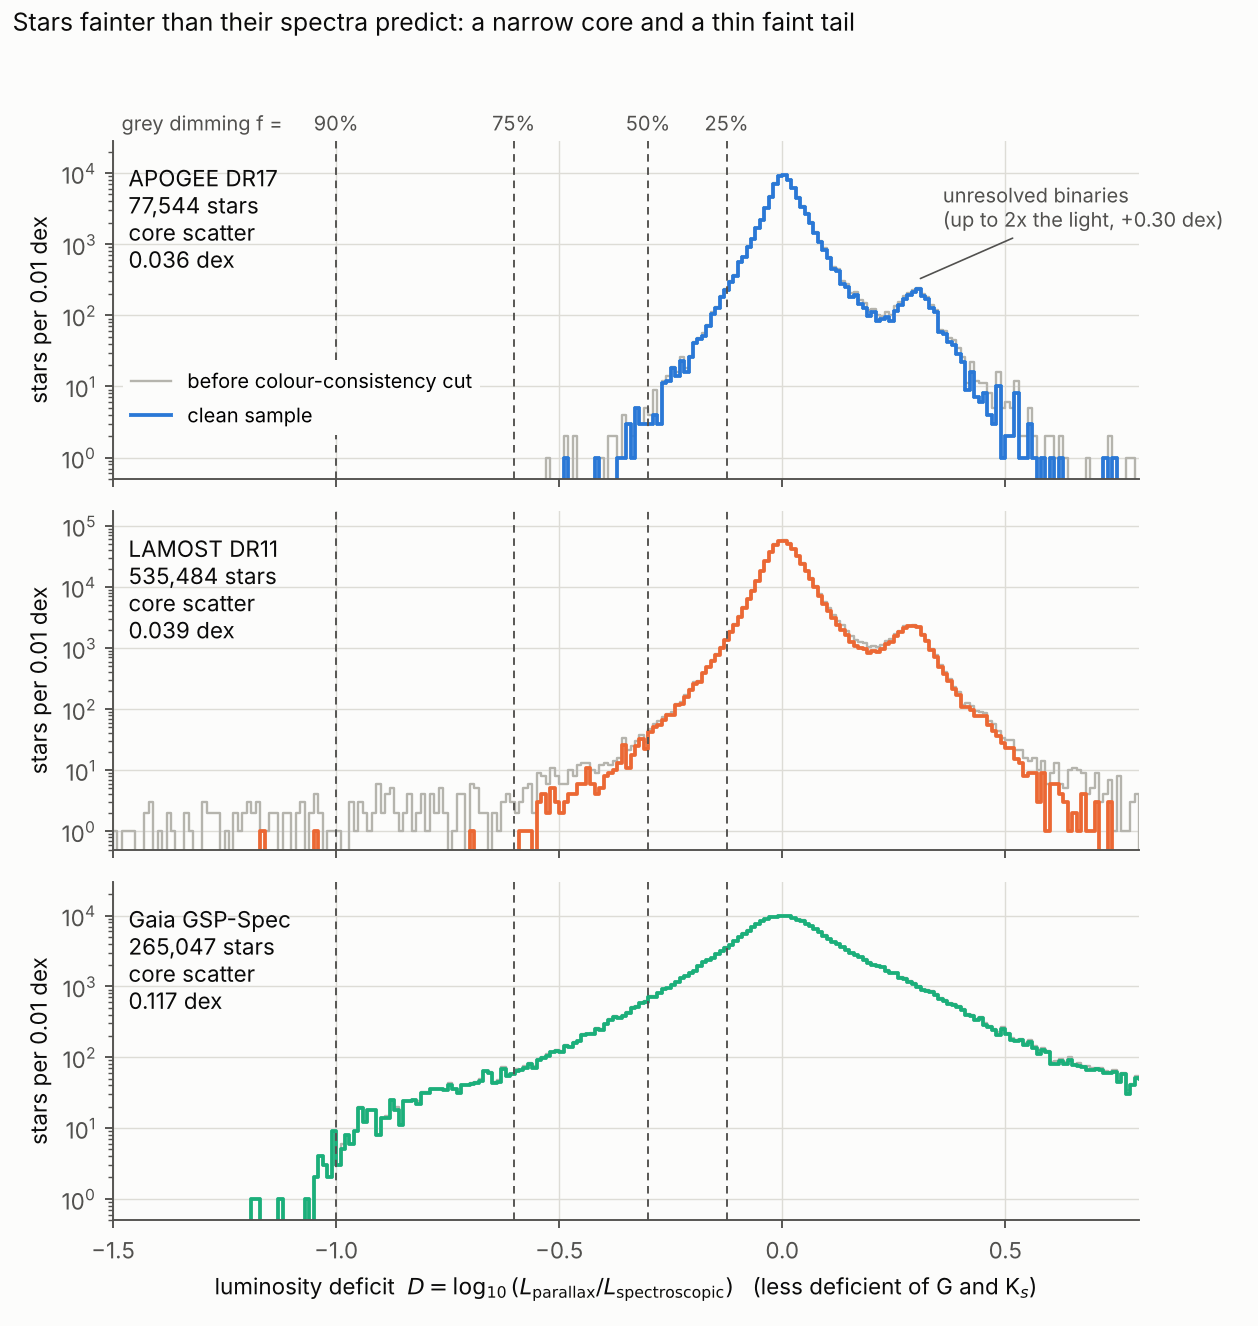
| Colours consistent with Teff (d): clean sample | 77,544 [86,681] | 535,484 [664,791] | 265,047 [298,098] |
Square brackets give the pre-declared cut set. (a) APOGEE: S/N ≥ 50, no bad STARFLAG/ASPCAPFLAG bits, one CCF component. LAMOST: g-band S/N ≥ 30, no fibre offset, σ(Teff) < 150 K, σ(log g) < 0.25. GSP-Spec: quality-flag characters 1–7 ≤ 1 and 8–13 = 0. (b) ipd_frac_multi_peak ≤ 2, ipd_gof_harmonic_amplitude < 0.1, corrected BP/RP excess within 5σ. These remove blends. (c) 50th nearest neighbour within 2.5 scaled units, so that a local calibration exists. (d) BP−RP and G−Ks within 4 local σ of the value predicted from the spectroscopic parameters. A grey absorber leaves colours unchanged, so a star that fails has a wrong Teff or a wrong match.
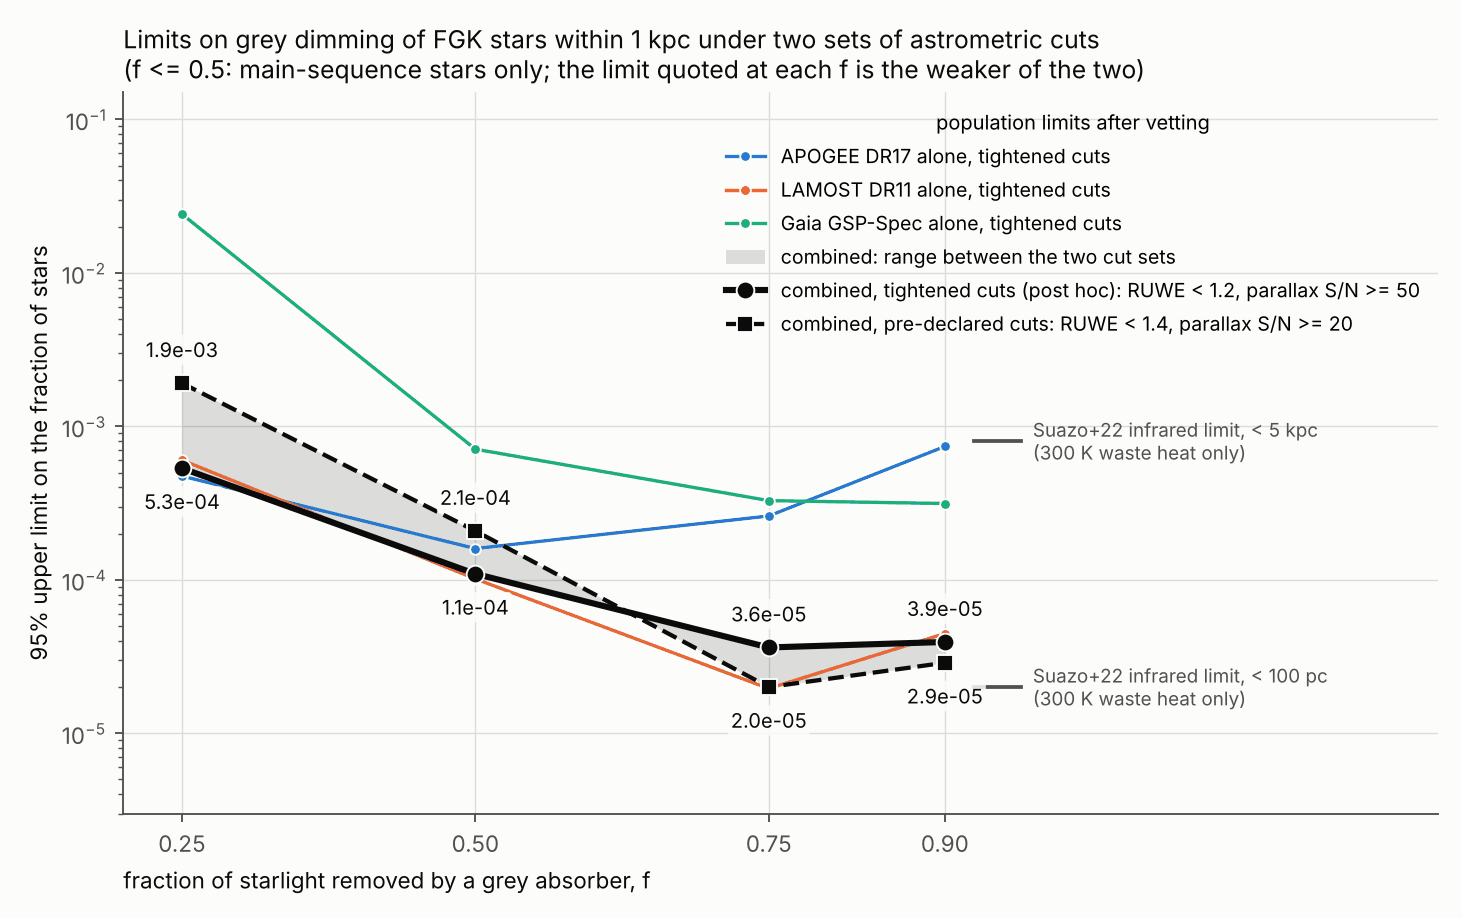
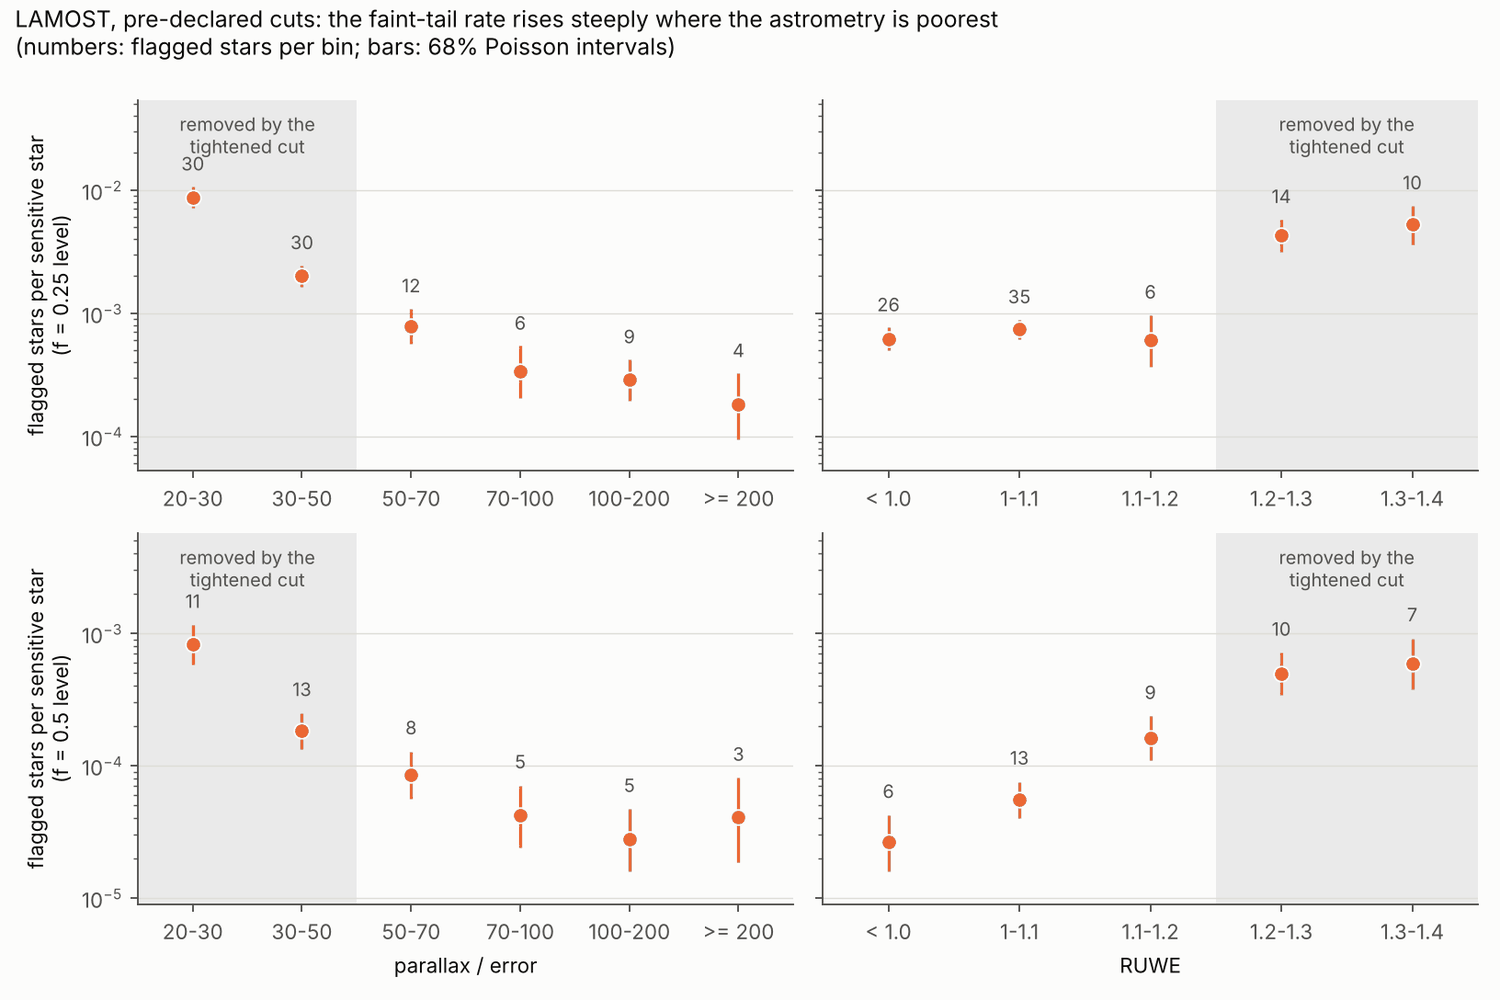
Two astrometric cut sets. The pre-declared set (RUWE < 1.4, parallax/error ≥ 20) was fixed before any deficit was computed. The tightened set (RUWE < 1.2, parallax/error ≥ 50) was chosen after I saw that the faint tail tracked astrometric quality. The whole pipeline now runs under both.
Extinction. Only sightlines with E(B−V)_SFD < 0.1 are used, and each star is dereddened by SFD × (1 − exp(−|z|/100 pc)). Residual dust dims G seven times more than Ks and reddens the star, so it cannot pass as grey. The parallax zero point is +0.017 mas.
Combined sample (tightened cuts). 790,783 unique stars; 74% have log g ≥ 4.1; K/G/F = 21/57/22%; distances 152–882 pc (5–95%, median 467 pc); 95% lie at |b| > 17°; G = 10.4–14.8.
Method
- Spectroscopic luminosity. In each survey separately, M_G, M_Ks and both colours are predicted from (Teff, log g, [Fe/H]) alone: a cubic polynomial plus the median residual of the 50 nearest stars in parameter space, leave-one-out.
- Statistic. D = log10(L_parallax/L_spectroscopic) in G and in Ks; the less deficient band is kept. Grey dimming shifts D by log10(1−f) = −0.125, −0.301, −0.602, −1.0.
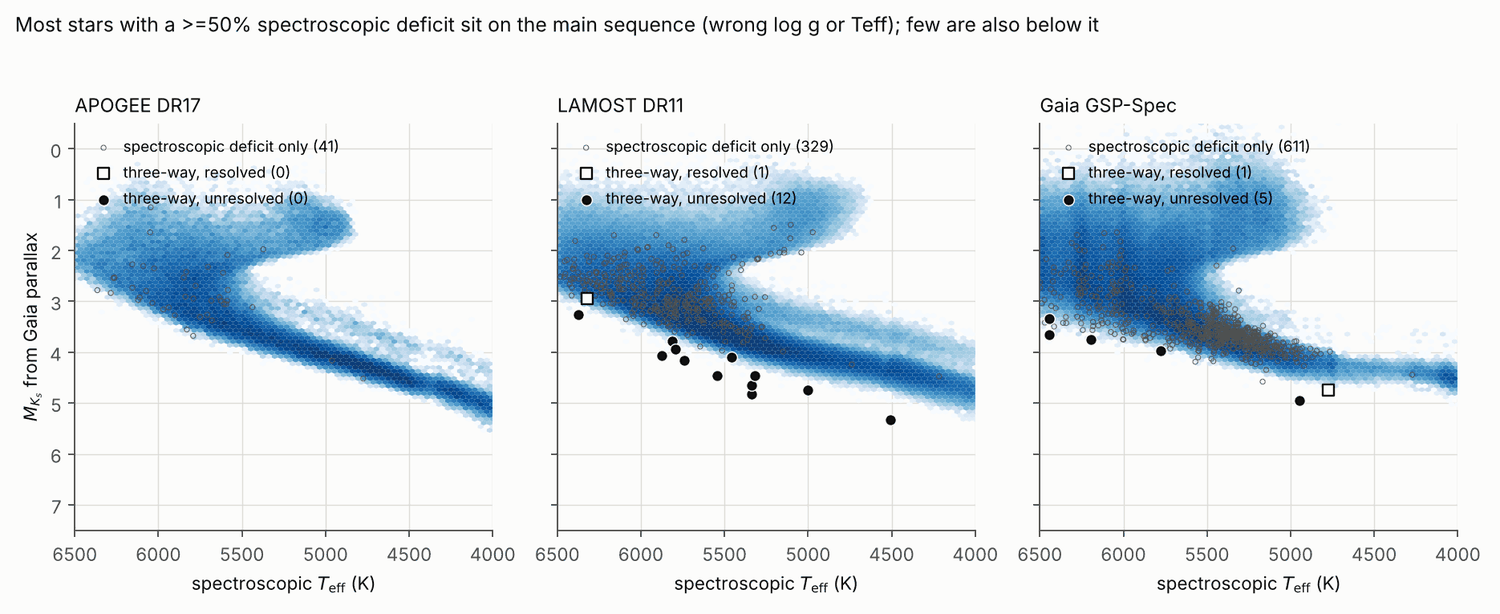
- Flagging at level f (three-way). σ_i is the faint-side scatter of D among the star's 50 neighbours. A star is sensitive if σ_i ≤ |log10(1−f)|/5. It is flagged if D < log10(1−f) + 2σ_i, and it lies below the faint floor of the main sequence at its (Teff, [Fe/H]) with log g not used, and below that floor at its (BP−RP, [Fe/H]) with Teff not used.
- What the test then is. The spectroscopic deficit alone is dominated by dwarfs with underestimated log g (Fig. 2). After the two extra conditions the test is in effect "below the main-sequence floor at fixed Teff, colour and [Fe/H]". Spectroscopic log g no longer contributes, subgiants have no recovery at f ≤ 0.5, and spectroscopy supplies mainly the metallicity.
- Recovery R and correction C. The shift log10(1−f) is added to all three statistics of every sensitive star and the flag re-applied; this gives R. Separately, 0.2% of the stars are dimmed in the catalogue itself, the whole calibration is redone, and C = (recovered end to end)/(recovered analytically). C is measured on the tightened-cut samples and applied to both cut sets.
- Selection efficiency ε (modelled). The ratio of clean survey stars to Gaia parent stars gives the survey selection against apparent magnitude in three colour classes. Each parent star is dimmed, and ε(f) is the mean chance that it is still selected and still passes the parallax-S/N and 2MASS cuts, relative to no dimming (Fig. 3).
- Vetting. A flagged star is resolved only on positive evidence: the deficit is absent with a second survey's parameters or in repeat LAMOST spectra; a brighter Gaia neighbour lies at the fibre; or the DR2 parallax differs by more than 3σ and removes the deficit. V is the measured chance that a real dimmed star survives this.
- Limit. p95(f) = PoissonUL95(n_unresolved) / Σ N_sens·R·C·ε·V. The combined sample uses, for each star, the survey with the smallest σ_i.
Results
Core and tail (Fig. 1). The robust scatter of D is 0.036 dex (APOGEE), 0.039 dex (LAMOST) and 0.117 dex (GSP-Spec). Stars with D < −0.301 number 19, 248 and 8,254; most have log g < 4.1 yet sit on the main sequence.
Combined limits under both cut sets (Fig. 4). Bold marks the weaker value at each f, which is the one I quote.
| f | Cut set | Sensitive stars | R | C | ε | Flagged / unresolved | 95% UL, stars as observed | 95% UL, population (ε variants) |
|---|---|---|---|---|---|---|---|---|
| 0.25 | tightened | 133,335 | 0.62 | 0.97 | 0.79 | 23 / 23 | 4.2×10⁻⁴ | 5.3×10⁻⁴ (5.2–5.4) |
| 0.25 | pre-declared | 129,176 | 0.60 | 0.97 | 0.80 | 96 / 92 | 1.5×10⁻³ | 1.9×10⁻³ (1.8–2.0) |
| 0.5 | tightened | 512,730 | 0.71 | 1.00 | 0.60 | 16 / 15 | 6.5×10⁻⁵ | 1.09×10⁻⁴ (1.00–1.16) |
| 0.5 | pre-declared | 626,809 | 0.72 | 1.00 | 0.64 | 51 / 45 | 1.3×10⁻⁴ | 2.1×10⁻⁴ (1.9–2.2) |
| 0.75 | tightened | 687,212 | 0.81 | 0.99 | 0.32 | 2 / 2 | 1.2×10⁻⁵ | 3.6×10⁻⁵ (3.0–4.1) |
| 0.75 | pre-declared | 832,294 | 0.81 | 0.99 | 0.36 | 2 / 1 | 7.3×10⁻⁶ | 2.0×10⁻⁵ (1.7–2.3) |
| 0.9 | tightened | 751,740 | 0.86 | 0.99 | 0.12 | 0 / 0 | 4.8×10⁻⁶ | 3.9×10⁻⁵ (3.0–4.8) |
| 0.9 | pre-declared | 907,630 | 0.85 | 0.99 | 0.14 | 0 / 0 | 4.0×10⁻⁶ | 2.9×10⁻⁵ (2.2–3.6) |
V = 0.97 throughout. The pre-declared cuts give limits 3.6 and 1.9 times weaker at f = 0.25 and 0.5. At f = 0.75 and 0.9 they give somewhat stronger limits, because the sample is larger and the candidate count does not grow.
Who is constrained (tightened cuts; share of the exposure Σ N_sens·R·C·ε·V).
| f | K dwarfs | G dwarfs | F dwarfs | Subgiants (log g < 4.1) | Limit from subgiants alone |
|---|---|---|---|---|---|
| 0.25 | 65.5% | 32.4% | 2.1% | 0.01% | none |
| 0.5 | 28.5% | 53.6% | 17.5% | 0.4% | 3.7×10⁻³ |
| 0.75 | 16.7% | 48.6% | 25.0% | 9.7% | 1.8×10⁻⁴ |
| 0.9 | 12.7% | 44.0% | 25.5% | 17.8% | 2.2×10⁻⁴ |
At f = 0.25 only 17% of the stars are sensitive. LAMOST carries 79–88% of the exposure at every f.
Per-survey population limits (unresolved candidates in brackets; tightened / pre-declared).
| f | APOGEE | LAMOST | GSP-Spec |
|---|---|---|---|
| 0.25 | 4.7×10⁻⁴ (2) / 7.5×10⁻⁴ (5) | 6.0×10⁻⁴ (21) / 2.3×10⁻³ (87) | 2.4×10⁻² (0) / 1.6×10⁻² (0) |
| 0.5 | 1.6×10⁻⁴ (0) / 2.3×10⁻⁴ (1) | 1.0×10⁻⁴ (12) / 2.0×10⁻⁴ (39) | 7.1×10⁻⁴ (3) / 9.0×10⁻⁴ (5) |
| 0.75 | 2.6×10⁻⁴ (0) / 2.3×10⁻⁴ (0) | 2.0×10⁻⁵ (0) / 1.4×10⁻⁵ (0) | 3.3×10⁻⁴ (2) / 2.3×10⁻⁴ (1) |
| 0.9 | 7.4×10⁻⁴ (0) / 6.8×10⁻⁴ (0) | 4.5×10⁻⁵ (0) / 3.2×10⁻⁵ (0) | 3.1×10⁻⁴ (0) / 3.0×10⁻⁴ (0) |
Colour-magnitude test without Teff or log g
(code/cmd_check.py). Stars lying more than a given
amount below the main-sequence ridge in both G and Ks:
| Sample | Stars | > 0.75 mag | > 1.0 mag | > 1.25 mag | > 2.0 mag |
|---|---|---|---|---|---|
| LAMOST clean, ridge at fixed colour and [Fe/H] | 515,055 | 23 | 2 | 0 | 0 |
| LAMOST clean, ridge at fixed colour only | 515,055 | 51 | 6 | 0 | 0 |
| Gaia parent sample, same cuts, no spectroscopy | 66,617 | 179 | 43 | 1 | 0 |
The zero count at f ≥ 0.75 therefore does not depend on Teff or log g. Without spectroscopy the region 0.75–1.25 mag below the ridge fills with halo subdwarfs (median tangential velocity 221 km/s against 40 km/s), which the [Fe/H] ≥ −1 cut removes. Before the colour-consistency cut, 17 LAMOST stars lie more than 1.5 mag below the ridge; all have BP−RP of 1.8–3.1, the colour of M dwarfs, with catalogued Teff in the FGK range. A grey screen cannot produce that mismatch.
Vetting (tightened cuts). Two stars flagged at f = 0.5 were resolved, one by a repeat LAMOST spectrum and one by a second survey. Nothing was resolved at f = 0.25. For the 39 distinct unresolved stars (32 LAMOST, 5 GSP-Spec, 2 APOGEE):
- None has an AllWISE W3 or W4 excess (35 have photometry good enough to test), and none has a W4 detection above S/N 3.
- None is flagged non-single by Gaia; 6 are flagged variable. DR2/DR3 parallax ratios are 0.95–1.04.
- None of the 29 with GALEX far-UV exposure is detected.
- Median tangential velocity is 29 km/s (maximum 163), so they are not halo subdwarfs.
- 30 are fainter than G = 13.4, the LAMOST median.
- Legacy Survey DR9/DR10 images of the 17 stars at f ≥ 0.5 show point
sources with no visible neighbour within about 10″. TYC 8384-108-1 lies
in a crowded field, and the brightest stars are saturated. This
inspection was by eye and is not part of the pipeline
(
code/cutouts.pyonly fetches the images).
Under the pre-declared cuts 136 distinct stars stay unresolved, 124 of them from LAMOST. Their DR2/DR3 parallax ratios span 0.80–1.26 and 72% have parallax/error below 70. IRSA was unavailable for most of them during the revision (28 have IRSA rows); the CDS AllWISE copy shows no excess among the 118 with usable photometry.
GALAH DR3 log g is computed from the parallax luminosity, so the disappearance of the deficit with GALAH parameters is circular and is not used.
Best unresolved candidates (full lists:
data/candidates_unresolved.csv,
data/origcuts/candidates_unresolved.csv).
| Gaia DR3 source | Survey, level | G, distance | Teff / log g / [Fe/H] | Deficit G / Ks | Remarks |
|---|---|---|---|---|---|
| 1072261129731168256 | GSP-Spec, 0.75 | 12.2, 258 pc | 6442 / 4.36 / +0.39 | 70% / 64% | colours 2.9–3.7σ too red for its Teff |
| 6811936642489247872 | GSP-Spec, 0.75 | 12.6, 316 pc | 6195 / 4.24 / +0.15 | 68% / 62% | colours 1.3–1.8σ too red |
| 3945396269943001216 | LAMOST, 0.5 | 14.5, 735 pc | 5812 / 4.16 / −0.02 | 64% / 65% | parallax/error 53, RUWE 1.16: at the edge of both cuts |
| 3966264313442458112 | LAMOST, 0.5 | 13.8, 287 pc | 5336 / 4.49 / −0.11 | 63% / 65% | 0.3 dex below both floors; colours 2.4σ bluer than Teff |
| 6658793364439792000 (TYC 8384-108-1) | GSP-Spec, 0.5 | 11.3, 218 pc | 6442 / 4.23 / −0.17 | 62% / 56% | RAVE DR6: 5320 K / 3.99 / −0.98, with which there is no deficit |
| 817780125554614912 (TYC 2990-957-1) | LAMOST, 0.5 | 11.2, 146 pc | 5874 / 4.47 / −0.18 | 46% / 46% | spectrum S/N 230; parallax/error 366; SIMBAD type Em*, G4 |
| 1459674395375158400 | LAMOST, 0.5 | 14.7, 274 pc | 4509 / 4.72 / −0.44 | 44% / 49% | same deficit in 3 more LAMOST spectra; colours 3.9σ bluer than Teff |
| 4819203273209176576 (TYC 7588-1810-1) | APOGEE, 0.25 | 11.8, 94 pc | 4724 / 4.60 / +0.14 | 30% / 33% | reproduced with GSP-Spec parameters; parallax/error 1133 |
The two GSP-Spec stars at the 0.75 level have deficits of 62–70%. GSP-Spec scatter of about 0.1 dex puts the 2σ threshold at D < −0.40, so 75% dimming cannot be excluded for them at 2σ. The first looks like a Teff overestimate from its colours; for the second the colour evidence is weak.
Follow-up that would settle them: one spectrum at R ≳ 20,000 per star; Gaia DR4 astrometry; for survivors, a density test (a grey screen makes the radius from L and Teff too small by √(1−f) while the asteroseismic density stays normal); far-infrared photometry; TESS light curves to test starspots.
Robustness checks
LAMOST dominates, so its values are shown (unresolved candidates in
brackets; tightened cuts unless stated). All variants are in
data/robustness.csv.
| Variant | f = 0.25 | f = 0.5 | f = 0.75 | f = 0.9 |
|---|---|---|---|---|
| Baseline | 6.0×10⁻⁴ (21) | 1.0×10⁻⁴ (12) | 2.0×10⁻⁵ (0) | 4.5×10⁻⁵ (0) |
| Flag threshold 1σ / 3σ | 6.2 / 8.9×10⁻⁴ | 0.9 / 1.2×10⁻⁴ | 2.3 / 1.9×10⁻⁵ | 5.2 / 4.3×10⁻⁵ |
| Ks only / G only | 6.2 / 6.8×10⁻⁴ | 1.1 / 0.9×10⁻⁴ | 1.9 / 1.9×10⁻⁵ | 4.4 / 4.4×10⁻⁵ |
| 25 / 100 neighbours | 6.9 / 5.8×10⁻⁴ | 1.2 / 0.9×10⁻⁴ | 2.0 / 1.9×10⁻⁵ | 4.5 / 4.4×10⁻⁵ |
| Floor multiplier 1.0 / 2.5 | 5.7 / 7.3×10⁻⁴ | 1.0 / 0.9×10⁻⁴ | 1.9 / 2.0×10⁻⁵ | 4.5 / 4.5×10⁻⁵ |
| Parallax/error ≥ 100 | 4.0×10⁻⁴ (7) | 8.3×10⁻⁵ (4) | 3.6×10⁻⁵ (0) | 8.5×10⁻⁵ (0) |
| E(B−V)_SFD < 0.05 | 6.4×10⁻⁴ (14) | 1.3×10⁻⁴ (10) | 3.0×10⁻⁵ (0) | 6.9×10⁻⁵ (0) |
| Brighter half / fainter half | 3.0 (1) / 8.5 (20) ×10⁻⁴ | 0.6 (1) / 1.6 (11) ×10⁻⁴ | 3.8 / 4.1×10⁻⁵ | 0.8 / 1.0×10⁻⁴ |
| Pre-declared cuts | 2.3×10⁻³ (87) | 2.0×10⁻⁴ (39) | 1.4×10⁻⁵ (0) | 3.2×10⁻⁵ (0) |
| Pre-declared, plus parallax/error ≥ 50 only | 1.1×10⁻³ (31) | 1.3×10⁻⁴ (17) | 1.8×10⁻⁵ (0) | 4.2×10⁻⁵ (0) |
| Pre-declared, plus RUWE < 1.2 only | 1.8×10⁻³ (65) | 1.5×10⁻⁴ (26) | 1.5×10⁻⁵ (0) | 3.3×10⁻⁵ (0) |
| No colour-consistency cut | 8.7×10⁻⁴ (33) | 2.1×10⁻⁴ (30) | 1.4×10⁻⁴ (14) | 1.7×10⁻⁴ (6) |
| Spectroscopic criterion only | 2.8×10⁻³ (177) | 1.3×10⁻³ (271) | 2.5×10⁻⁴ (31) | 9.2×10⁻⁵ (2) |
- The tail removed by the tightened cuts tracks astrometric quality (Fig. 5). Under the pre-declared cuts the LAMOST f = 0.25 rate of flagged stars per sensitive star falls from 8.7×10⁻³ at parallax/error 20–30 to 2–3×10⁻⁴ above 100. It is 6–7×10⁻⁴ below RUWE 1.2 and 4–5×10⁻³ at RUWE 1.2–1.4. Each effect is about a factor of ten with the other held fixed. Real dimming cannot track RUWE. The choice was still made after seeing the data, which is why both results are quoted.
- Inside the tightened cuts there is no significant RUWE trend. LAMOST, f = 0.5: 4 of 195,804 sensitive stars are flagged at RUWE < 1.0 against 1 of 48,533 at RUWE 1.1–1.2 (ratio 1.0). At f = 0.25: 6 of 47,573 against 3 of 11,192 (ratio 2.1, not significant).
- The remaining candidates concentrate at faint magnitude and low parallax S/N. In LAMOST, 20 of 21 flagged stars at f = 0.25 and 11 of 13 at f = 0.5 are in the fainter half (f = 0.25 rates: 2.6×10⁻⁴ against 2.9×10⁻⁵). The f = 0.25 rate is 3.9×10⁻⁴ at parallax/error 50–70 against 1.0×10⁻⁴ above 100. Real dimming of 0.3–0.75 mag would shift stars towards the faint half only slightly. This points to measurement error, but it is not shown star by star.
- End-to-end injection. For a single dimmed star the end-to-end and analytic recoveries agree exactly, because every reference is leave-one-out. A shortfall appears only when injected stars contaminate each other's reference sets, and it grows with the injected fraction. At f = 0.25, C is 1.00 (APOGEE, 149 of 149) and 0.96 ± 0.02 (LAMOST, 146 of 152) with 0.2% injected, 0.95 and 0.86 with 0.8%, and 0.88 (APOGEE) with 2%. I apply the 0.2% values, which weakens the limits by 3% at f = 0.25 and under 1% elsewhere.
- Selection efficiency cross-check. A star dimmed by f at distance d looks like an undimmed twin at d/√(1−f). Summing real survey stars at the larger distance, weighted by volume and a disc density ratio, gives ε without the parent sample. LAMOST: 0.86 / 0.67 / 0.40 / 0.18 (0.85–0.88 / 0.65–0.71 / 0.37–0.45 / 0.16–0.22 over seven disc models) against the modelled 0.81 / 0.63 / 0.36 / 0.15. APOGEE: 0.74 / 0.47 / 0.21 / 0.067 against 0.72 / 0.45 / 0.20 / 0.062. With the twin values the combined limits would be 5.2×10⁻⁴, 1.04×10⁻⁴, 3.3×10⁻⁵ and 3.3×10⁻⁵. I keep the modelled, more conservative values.
- GSP-Spec is unstable. Its candidate count at f = 0.75 runs from 0 to 10 across variants.
Limitations
- Grey only. A swarm of small particles reddens the star, fails the colour cut and looks like a dusty star.
- No near-infrared re-emission. Waste heat brightens Ks by 0.1 mag at about 600, 520, 470 and 420 K for f = 0.25, 0.5, 0.75 and 0.9 around a Sun-like star (blackbody estimate). The limits hold below those temperatures.
- Post-hoc cuts. The f ≤ 0.5 limits differ by factors of 3.6 and 1.9 between the two cut sets.
- Unexplained candidates. The method has its own confusion: 39 to 136 stars that I cannot explain and did not observe.
- Scope. Main-sequence stars at f ≤ 0.5; K and G dwarfs at f = 0.25. FGK only, [Fe/H] ≥ −1, within 1 kpc, mostly |b| > 17°, low extinction. No M dwarfs.
- Evaluated at dimming equal to f. ε is already 0.12 at f = 0.9; swarms with f above roughly 0.97 are essentially unconstrained.
- Rare populations only. The calibration is empirical, so a dimmed population above about 1% of stars would be absorbed into it, and C assumes a density of at most 0.2%.
Closest prior work and what is new
The idea is from Zackrisson, Korn, Wehrhahn and Reiter 2018 (ApJ 862, 21; arXiv:1804.08351). They compared Gaia DR1 parallaxes with RAVE DR5 spectrophotometric distances for 8,441 stars, listed a few outliers with covering fraction above 0.7, followed up one (TYC 6111-1162-1) and derived no population limit. My arXiv searches found no later study of this type.
New here: (1) a sample about 90 times larger, with DR3 parallaxes and three sets of spectra; (2) quantitative upper limits with injection-recovery, a selection model for dimmed stars and a vetting efficiency; (3) the three-way criterion; (4) the finding that the part of the faint tail removed by tighter astrometric cuts tracks astrometric quality. Not new: the idea, and the emptiness of the region more than 1.5 mag below the main sequence for disc stars of near-solar metallicity, which is what the f ≥ 0.75 result amounts to.
Relation to the infrared limits. Suazo et al. 2022 (MNRAS 512, 2988) limit 300 K, 90%-complete spheres to below about 2×10⁻⁵ of stars within 100 pc and 8×10⁻⁴ within 5 kpc; their limits reach covering fractions down to about 10%. Suazo et al. 2024 (MNRAS 531, 695) reported 7 candidates, all M dwarfs, among about 5 million stars, and Contardo and Hogg 2024 (arXiv:2403.18941) 53 mid-infrared excess sources. Follow-up points largely to background contamination. Archival diagnostics find it in candidates B and C, with suggestive or marginal evidence in five more (Ren, Garrett and Siemion 2024, arXiv:2405.14921; Ren et al. 2026, arXiv:2607.03619). JWST/MIRI shows that candidates D and E are background galaxies (Zackrisson et al. 2026, arXiv:2607.09460). Korn et al. 2026 (arXiv:2607.25701) find normal stellar parameters and no clear explanation from the stars themselves. Blain 2024 (arXiv:2409.11447) makes the galaxy-confusion argument and notes that a Dyson structure could instead make its star anomalously faint in a stellar catalogue, which is the signature tested here.
My limits need no infrared detection, so background galaxies cannot create candidates, but the method has its own unresolved confusion in the unexplained stars. My f = 0.9 limit (3.9×10⁻⁵) is weaker than the infrared one within 100 pc and about 20 times stronger than the one within 5 kpc. It applies at any waste-heat temperature below about 400–600 K.
Implications for the Fermi paradox
Among FGK main-sequence stars within 1 kpc, fewer than 1 in about 5,000 can be hidden behind a grey swarm covering half of the star (1 in 9,000 with the tightened cuts). Fewer than 1 in about 25,000 can be behind one covering 75–90%. At 25% covering the limit is only 5×10⁻⁴ to 2×10⁻³, for K and G dwarfs. The data are consistent with none.
This narrows, and does not close, the "cold or non-radiating swarm" loophole in the infrared null results. It narrows it for grey swarms covering half or more of an FGK main-sequence star, at the 10⁻⁴ level. Extrapolated to roughly 10¹⁰ Galactic FGK stars, which assumes the local high-latitude sample is representative, the limits still allow from a few times 10⁵ systems (f ≥ 0.75) to about 2×10⁶ (f = 0.5), so this constrains frequency and not existence. It says nothing about civilisations using under a quarter of their star's light, dust-like or optically re-emitting swarms, nearly complete spheres, M-dwarf hosts or stars beyond 1 kpc.
Reproducing
python3 code/run_all.py downloads the data (about 2 h,
cached under raw/) and runs both cut sets;
--no-download takes about 1 h. Outputs for the tightened
cuts are in data/, for the pre-declared cuts in
data/origcuts/. Every number quoted here is printed to
data/report_numbers.txt. Figures:
fig1_deficit_distributions.png,
fig2_hr_flagged.png,
fig3_selection_efficiency.png,
fig4_limits.png,
fig5_tail_vs_astrometry.png.
For this revision the stages were run one at a time, in dependency
order, by a shell loop that calls the same scripts with the same
environment as run_all.py; run_all.py itself
was run from make_figures onward. A second run of the
vetting and limits stages reproduced the candidate tables and limits
exactly.
Response to referee
- Limits at f ≤ 0.5 depend on post-hoc cuts. Accepted. The pipeline now runs under both cut sets. Combined limits under the pre-declared cuts are 1.9×10⁻³, 2.1×10⁻⁴, 2.0×10⁻⁵ and 2.9×10⁻⁵, and ranges are quoted everywhere. The referee's upper end at f = 0.5 (2.4×10⁻⁴, LAMOST, unvetted) becomes 2.1×10⁻⁴ for the vetted combined sample.
- "Six times higher at RUWE 1.1–1.2" does not
reproduce. Accepted and withdrawn; the number came from the
pre-declared sample. The diagnostic is now also computed inside the
tightened cuts (
data/astrometry_diagnostic_final.csv), the faint-half and parallax-S/N concentration is reported instead, novelty item 4 is restricted, and Fig. 5 is replaced. - GALAH check is circular. Accepted; the claim is removed. GSP-Phot Teff is no longer cited. Remarks use colour residuals, which are weak for the second GSP-Spec star.
- Scope wording. Accepted; a scope table is added and "near the Sun" is replaced.
- "Measured" selection efficiency. Now "modelled".
The distance-shift estimate is implemented in
selection.pyand matches the referee's values within about 0.01. - Apply the end-to-end factor. Accepted in substance; the value 0.92 is rejected. It was an artefact of injecting 0.2–1.5% of the sample at once. The shortfall scales with injected density and vanishes for one star. C is now measured at a density of 0.2%, at or above every quoted limit, and applied.
- "Closes the loophole". Now "narrows", and the f = 0.9 comparison with the infrared limit is in the first paragraph.
- Parallax ratios. Corrected to 0.95–1.04.
- The two "75%" stars. Described as 62–70% deficits not excludable as 75% at 2σ.
- APOGEE 2MASS flags; hand lookups. Fixed, not
footnoted. APOGEE now gets real 2MASS flags from a cross-match (clean
sample 77,595 → 77,544; combined 790,829 → 790,783). SIMBAD and RAVE DR6
lookups are scripted in
vet_candidates.py. The image inspection remains manual and is marked so. - Prior work. Reworded to "down to about 10%". The 2026 references are added, with their findings taken from the arXiv abstracts.
- What the test is. Stated in the Method, with a colour-magnitude test added. One clarification: the zero count beyond 1.5 mag holds after the colour-consistency cut; before it, 17 LAMOST stars with M-dwarf colours lie there.
- Overclaims. "Three independent surveys" and "immune to background-galaxy confusion" are reworded as asked.
Does the headline survive? At f ≥ 0.75, yes. At f ≤ 0.5 only as a conservative range; the single values of the first pass (5.2×10⁻⁴ and 1.1×10⁻⁴) are withdrawn.
Key numbers
| Quantity | Value | Uncertainty | Note |
|---|---|---|---|
| Clean sample, unique stars (combined) | 790,783 (tightened cuts); 950,640 (pre-declared cuts) | Tightened: APOGEE 77,544, LAMOST 535,484, GSP-Spec 265,047 before removing overlaps; 74% log g >= 4.1; distances 152-882 pc (5-95%), median 467 pc; 95% at |b| > 17 deg | |
| 95% upper limit on fraction of stars with grey dimming f = 0.25 | 5.3e-4 to 1.9e-3 | range spans the two astrometric cut sets; selection-model variants add 5.2-5.4e-4 and 1.8-2.0e-3 within each | K and G dwarfs only (98% of exposure). Tightened cuts: 23 unresolved, 133,335 sensitive stars; pre-declared cuts: 92 unresolved, 129,176 sensitive. The upper end is the safe number |
| 95% upper limit, f = 0.5 | 1.1e-4 to 2.1e-4 | range spans the two cut sets; selection-model variants 1.00-1.16e-4 and 1.9-2.2e-4 | Main-sequence stars only (log g >= 4.1; 99.6% of exposure). Tightened: 15 unresolved, 512,730 sensitive; pre-declared: 45 unresolved, 626,809 sensitive |
| 95% upper limit, f = 0.75 | < 3.6e-5 | 3.0e-5 to 4.1e-5 from selection-model variants | Tightened cuts, 2 unresolved (both GSP-Spec, deficits 62-70%), 687,212 sensitive. Pre-declared cuts give 2.0e-5 (1 unresolved). Subgiants alone: 1.8e-4 |
| 95% upper limit, f = 0.9 | < 3.9e-5 | 3.0e-5 to 4.8e-5 from selection-model variants | Zero candidates under both cut sets; 751,740 sensitive stars. Pre-declared cuts give 2.9e-5. Subgiants alone: 2.2e-4. Weaker than the infrared limit for 300 K swarms within 100 pc (2e-5) |
| 95% upper limits as a fraction of the stars actually observed (no selection model), f = 0.25/0.5/0.75/0.9 | 4.2e-4, 6.5e-5, 1.2e-5, 4.8e-6 (tightened); 1.5e-3, 1.3e-4, 7.3e-6, 4.0e-6 (pre-declared) | Do not depend on the modelled selection efficiency | |
| Three-way flagged / unresolved stars, combined sample, f = 0.25/0.5/0.75/0.9 | 23/23, 16/15, 2/2, 0/0 (tightened); 96/92, 51/45, 2/1, 0/0 (pre-declared) | 39 distinct unresolved stars under the tightened cuts (32 LAMOST, 5 GSP-Spec, 2 APOGEE); 136 under the pre-declared cuts (124 LAMOST) | |
| Core scatter of D = log10(L_parallax/L_spectroscopic) | 0.036 dex (APOGEE), 0.039 dex (LAMOST), 0.117 dex (GSP-Spec) | robust sigma of the clean samples; APOGEE K dwarfs 0.022 dex | |
| Injection recovery R (combined, three-way) and end-to-end correction C | R = 0.62, 0.71, 0.81, 0.86; C = 0.969, 0.997, 0.994, 0.994 | C at f = 0.25: LAMOST 0.96 +/- 0.02 (146 of 152), APOGEE 1.00 (149 of 149) | C measured with 0.2% of stars dimmed at once; it falls to 0.86-0.95 at 0.8% and 0.88 at 2% injected, and is exactly 1 for a single star |
| Selection efficiency eps of a dimmed star (combined mean), modelled versus model-free twin estimate | modelled 0.79, 0.60, 0.32, 0.12; twin 0.82, 0.63, 0.35, 0.14 | LAMOST twin range over seven disc models: 0.85-0.88, 0.65-0.71, 0.37-0.45, 0.16-0.22 | Twin estimate for LAMOST and APOGEE only; model is 3-22% lower (conservative). With twin values the limits would be 5.2e-4, 1.04e-4, 3.3e-5, 3.3e-5 |
| Vetting survival probability V | 0.97 | second-survey rule falsely dismisses 3.9-6.1% on overlaps of 22,412-46,861 stars | |
| Share of exposure by class at f = 0.25 / 0.5 / 0.75 / 0.9 (tightened cuts) | subgiants (log g < 4.1): 0.01% / 0.4% / 9.7% / 17.8%; at f = 0.25: K dwarfs 65.5%, G dwarfs 32.4%, F dwarfs 2.1% | LAMOST subgiant recovery 0.000, 0.006, 0.42, 0.79; LAMOST carries 79-88% of the exposure | |
| Colour-magnitude test without Teff or log g: stars more than 0.75 / 1.0 / 1.25 / 2.0 mag below the main-sequence ridge | LAMOST clean with [Fe/H]: 23 / 2 / 0 / 0 of 515,055; colour only: 51 / 6 / 0 / 0; Gaia parent sample without spectroscopy: 179 / 43 / 1 / 0 of 66,617 | Parent-sample stars 0.75-1.25 mag below are halo subdwarfs (median v_tan 221 km/s). Before the colour-consistency cut 17 LAMOST stars lie more than 1.5 mag below; all have M-dwarf colours | |
| LAMOST f = 0.25 flagged rate versus astrometric quality, pre-declared cuts | 8.7e-3 at parallax/error 20-30 falling to 1.8-2.9e-4 above 100; 6-7e-4 at RUWE < 1.2 against 4.3-5.2e-3 at RUWE 1.2-1.4 | Each effect is about a factor of ten with the other held fixed. Inside the tightened cuts there is no significant RUWE trend (f = 0.5: 4/195,804 at RUWE < 1.0 against 1/48,533 at 1.1-1.2) | |
| Concentration of remaining LAMOST candidates in the fainter half (tightened cuts) | 20 of 21 flagged at f = 0.25; 11 of 13 at f = 0.5 | f = 0.25 rate 2.6e-4 (fainter half) against 2.9e-5 (brighter half); 3.9e-4 at parallax/error 50-70 against 1.0e-4 above 100 | |
| Unresolved candidates with AllWISE W3/W4 excess | 0 of 39 (tightened); 0 of 136 (pre-declared) | 35 and 118 have photometry good enough to test; no W4 detection above S/N 3 in IRSA rows (39 of 39 and 28 of 136 retrieved; IRSA TAP was down during the revision). GALEX: 0 far-UV detections among 29 covered (tightened) | |
| Limits from the spectroscopic criterion alone (combined, tightened), f = 0.25/0.5/0.75/0.9 | 2.7e-3, 1.5e-3, 1.2e-3, 3.2e-3 | 236 / 408 / 203 / 223 flagged, mostly dwarfs with underestimated log g; the three-way criterion is necessary | |
| Warmest waste heat for which the Ks band stays grey (Sun-like star) | about 600 K (f = 0.25), 520 K (0.5), 470 K (0.75), 420 K (0.9) | blackbody estimate, Ks brightening of 0.1 mag |
Changes made after the referee report
- Whole pipeline (calibration, selection model, vetting, limits) now runs under both astrometric cut sets via DIM_STARS_CUTSET; outputs in data/ (tightened) and data/origcuts/ (pre-declared). Combined-sample limits under the pre-declared cuts computed for the first time: 1.9e-3, 2.1e-4, 2.0e-5, 2.9e-5.
- Headline, first paragraph, key numbers, tables and Fig. 4 now quote the f = 0.25 and 0.5 limits as ranges (5.3e-4 to 1.9e-3; 1.1e-4 to 2.1e-4) and the weaker of the two cut sets at f = 0.75 and 0.9 (3.6e-5, 3.9e-5). The first-pass single values at f <= 0.5 are withdrawn.
- Withdrew the wrong statement that the candidate rate is six times higher at RUWE 1.1-1.2 inside the final cuts. Added a diagnostic computed inside the tightened cuts (data/astrometry_diagnostic_final.csv): no significant RUWE trend; candidates concentrate in the fainter half (20 of 21, 11 of 13) and at parallax/error 50-70. Novelty item 4 restricted to the tail removed by the cuts. Old Fig. 5 replaced by fig5_tail_vs_astrometry.png.
- Removed the GALAH DR3 'deficit vanishes' claim (GALAH log g is parallax-based, so the test is circular) and the GALAH remark in the candidate table; added a log-g-free GALAH check for information. GSP-Phot Teff no longer cited as evidence; candidate remarks use colour residuals (2.9-3.7 sigma for the first GSP-Spec star, only 1.3-1.8 sigma for the second).
- Scope wording changed throughout: f <= 0.5 limits are for main-sequence stars (log g >= 4.1), f = 0.25 for K and G dwarfs; 'near the Sun' replaced by 'within 1 kpc at mostly |b| > 17 deg'. New scope table (share of exposure by class and survey, data/limits_scope.csv) and subgiant-only limits.
- Selection efficiency now called 'modelled'. Added the model-free twin (distance-shift) estimate to selection.py (data/selection_eff_twin.csv) for LAMOST and APOGEE over seven disc models; it reproduces the referee's values within about 0.01 and is shown in Fig. 3 and as alternative limits.
- New stage injection.py: end-to-end injection at an injected density of 0.2%, with density-scaling runs at 0.8% and 2%. The resulting correction C (0.969, 0.997, 0.994, 0.994 combined) is now applied in the limits; the f = 0.25 limit weakens by 3%.
- Implications softened from 'closes the loophole' to 'narrows'; stated that the f = 0.9 limit (3.9e-5) is weaker than the infrared limit for 300 K swarms within 100 pc (2e-5); stated the method's own confusion (39 to 136 unexplained stars) next to the background-galaxy remark; 'three independent surveys' reworded (shared Gaia parallaxes and photometry).
- Corrected the DR2/DR3 parallax-ratio range to 0.95-1.04 (0.80-1.26 under the pre-declared cuts).
- The two GSP-Spec stars at the 0.75 level are now described as 62-70% deficits that cannot be excluded as 75% dimming at 2 sigma.
- APOGEE now gets real 2MASS quality and uniqueness flags from a CDS XMatch instead of hard-coded values (clean sample 77,595 to 77,544; combined 790,829 to 790,783). SIMBAD and RAVE DR6 lookups are scripted in vet_candidates.py and cached.
- Prior-work section: 'covering fractions of a few per cent' changed to 'down to about 10%'; added Ren et al. 2026 (arXiv:2607.03619), Korn et al. 2026 (arXiv:2607.25701), Zackrisson et al. 2026 (arXiv:2607.09460) and Blain 2024 (arXiv:2409.11447), each checked against its arXiv abstract.
- Method section now states that after the three-way criterion the test is 'below the main-sequence floor at fixed Teff, colour and [Fe/H]'. New stage cmd_check.py: colour-magnitude test with [Fe/H], without it, and on the Gaia parent sample without spectroscopy.
- Vetting now also run under the pre-declared cuts (4 of 96 resolved at f = 0.25, 6 of 51 at f = 0.5), so those limits are vetted rather than raw counts.
- run_all.py rewritten for the two passes and new stages; report_numbers.py prints every quoted number for both cut sets; robustness.py adds one-cut-at-a-time subsets of the pre-declared sample and faint-half counts; Fig. 4 shows both cut sets with the range shaded.
- Added a 'Response to referee' section to the report.
Referee points not accepted
- Partly rejected: 'apply the end-to-end recovery factor 0.92 at f = 0.25 (0.98 at f = 0.5)'. A correction is now applied, but not that value. The 0.92 shortfall was an artefact of injecting 0.2-1.5% of each sample at once: injected stars contaminate each other's leave-one-out reference sets. Evidence from new runs (data/injection_end_to_end.csv): at f = 0.25 the ratio of end-to-end to analytic recovery is 1.00 (APOGEE, 149 of 149) and 0.96 +/- 0.02 (LAMOST, 146 of 152) with 0.2% injected, 0.95 and 0.86 with 0.8%, and 0.88 with 2%; for a single star the two routes agree exactly by construction. The 0.2% value, which is at or above every quoted limit, is applied (combined C = 0.969 at f = 0.25).
- Clarified rather than adopted verbatim: 'none of 520,000 LAMOST stars lies more than 1.5 mag below the ridge, and the same holds before the colour-consistency cut'. After the colour-consistency cut I confirm zero beyond 1.25 mag. Before that cut, my colour-and-[Fe/H] ridge test finds 17 LAMOST stars more than 1.5 mag below (5 beyond 2.0 mag); all have BP-RP of 1.8-3.1 (M-dwarf colours) with FGK catalogue temperatures, outside the colour range where a binned FGK ridge exists, which is probably why the referee's test did not count them. They are excluded by the colour-consistency cut, as a grey screen cannot change colour.
- Not taken up as worded: 'state in a footnote that the 2MASS cut is not applied to APOGEE'. Instead the cut is now really applied (real 2MASS flags attached by cross-match), which changes the APOGEE clean sample by 51 stars and no limit by more than rounding.
- Minor numerical difference, not a rejection: the referee's upper ends of the ranges (2e-3 and 2.4e-4) were LAMOST-only and unvetted; the vetted combined-sample values under the pre-declared cuts are 1.9e-3 and 2.1e-4.
Figures
Code
Every number above is produced by these scripts from public data. The data tables themselves are not hosted here; the scripts download them.
analysis.py build_samples.py cmd_check.py common.py cutouts.py dimlib.py download_data.py injection.py limits.py make_figures.py report_numbers.py robustness.py run_all.py selection.py vet_candidates.py
Referee report
A second, separate analysis re-ran the code, recomputed the main numbers by its own route and tried to break the result. Like the first, it was run by Claude for this project; it is not an outside expert. In its report “the analyst” is the first analysis, which wrote the paper, and file names that are not linked on this page are its own working files. The paper above is the version revised in response.
Verdict: sound with fixes. Results reproduced: yes.
I did not redo the 2-hour download or build_samples.py; I started from the analyst's built per-star tables and spot-checked those against the archives.
- Analyst pipeline, rerun with the analyst's own code.
- Cuts + calibration + deficits (dimlib) for all three surveys: clean samples 77,595 / 535,484 / 265,047; D, sigma_i, m_ms, m_cmd identical to the analyst's tables to 1e-12; sensitive counts, flagged counts and recovery R identical at every f (e.g. LAMOST 21/13/0/0 three-way flagged, R = 0.604/0.719/0.818/0.871).
- selection.py and limits.py rerun: selection_eff.csv, vetting_efficiency.csv and limits.csv identical (max relative difference 0). Combined limits 5.17e-4, 1.09e-4, 3.61e-5, 3.92e-5 confirmed.
- Original-cuts variant (RUWE < 1.4, parallax/error >= 20) for LAMOST: 91 / 45 flagged (44 unresolved) / 1 / 0 confirmed.
- I did not rerun vet_candidates.py (it rewrites caches in the analyst's raw directory); vetting removes only 2 of 17 stars at f = 0.5, so it cannot move a limit by more than about 10%.
- Independent recomputation A: candidate counts by a different route (LAMOST). Binned-median calibration (100 K x 0.1 dex x 0.1 dex cells) plus offset below the main-sequence ridge at fixed colour and [Fe/H], no per-star sigma.
- Of 520,429 clean LAMOST stars, none lies more than 1.5 mag below the ridge in both G and Ks; only 2 lie more than 1.0 mag below (Gaia DR3 817780125554614912 and 3966264313442458112, both already in the analyst's list). The same holds before the colour-consistency cut (532,610 stars).
| f | my flagged | my R | my 95% UL (stars as observed) | analyst LAMOST (as observed) |
|---|---|---|---|---|
| 0.9 | 0 | 0.887 | 6.5e-6 | 6.7e-6 |
| 0.75 | 1 | 0.851 | 1.07e-5 | 7.1e-6 |
| 0.5 | 28 (11 of the analyst's 13) | 0.711 | 1.04e-4 | 6.3e-5 |
The one f = 0.75 star (3363973456023915776, log g 3.98, D = -0.59) sits on the main sequence; the analyst's log-g-free floor rejects it. My crude criterion is not usable at f = 0.25 (722 flagged), so that level is confirmed only by the rerun, not independently.
- Independent recomputation B: selection efficiency eps for LAMOST, the factor that matters most (it is 0.12-0.15 at f = 0.9).
- Own 2-D (colour, G) re-implementation on the Gaia parent sample: 0.85 / 0.65 / 0.37 / 0.15.
- A route that does not use the parent sample at all: a star dimmed by f at distance d has the same apparent magnitude and colour as an undimmed twin at d/sqrt(1-f), so its survey selection is that of real LAMOST stars at the larger distance. Summing over 1,042,941 LAMOST stars with the parallax cuts relaxed, weighted by the volume factor and an exponential-disc density ratio: 0.85 / 0.66 / 0.39 / 0.17 (0.84-0.87 / 0.63-0.69 / 0.36-0.43 / 0.15-0.21 over five disc models).
- Analyst: 0.81 / 0.63 / 0.36 / 0.15. Agreement within about 15%, with the analyst on the conservative side.
- Resulting independent LAMOST population limit at f = 0.9: 3.0 / (535,359 x 0.871 x 0.169 x 0.965) = 3.9e-5 (analyst: 4.45e-5 LAMOST alone, 3.9e-5 combined).
- Catalogue and code spot checks, all passed.
- Gaia archive values (parallax, G, GSP-Spec and GSP-Phot parameters) for 10 listed candidates match the report table.
- The LAMOST DR11 VizieR row for 3966264313442458112 matches (5335.8 K / 4.485 / -0.108).
- The analyst's SFD lookup agrees exactly with APOGEE's own SFD column for 79,941 stars.
- Poisson limits, parallax zero-point sign, HEALPix-from-source_id and the Ks blackbody formula (0.09 mag at 420 K, f = 0.9) are correct. Joins keep one row per star (2,383,826 LAMOST rows = unique ids).
- Recovery does not degrade at the faint end, where dimmed stars would sit (LAMOST G = 15-15.5: R = 0.70 / 0.88 / 0.88 / 0.88).
- Citation checks.
- Zackrisson et al. 2018: 8,441 stars, TYC 6111-1162-1, parallax 8.72 mas (DR1) to 5.75 mas (DR2), explicitly no population limit: all as the report states.
- Suazo et al. 2022: under about 2e-5 within 100 pc and about 8e-4 within 5 kpc for 300 K, 90% spheres: as stated.
- Suazo 2024 (7 candidates) and Contardo and Hogg 2024 (53 candidates): confirmed from secondary summaries.
- Background-galaxy attribution is now stronger than the report says: JWST/MIRI shows candidates D and E are background galaxies (arXiv:2607.09460).
- What did not reproduce.
- The sentence that inside the final cuts the candidate rate is six times higher at RUWE 1.1-1.2 than below 1.0. In the final LAMOST sample I get 1/48,533 against 4/195,804 at f = 0.5 (ratio 1.0) and 3/11,192 against 6/47,573 at f = 0.25 (ratio 2.1, not significant). The factor six comes from the original-cut sample, which still contains parallax/error 20-50 stars.
- The quoted DR2/DR3 parallax-ratio range (0.98-1.04); the table gives 0.948-1.035.
Strongest objection
Once the three-way criterion is applied, the test is no longer 'spectroscopic versus parallax luminosity'. It is 'does the star lie below the lower edge of the main sequence at its Teff, colour and [Fe/H]'. Spectroscopic log g contributes nothing: stars with log g < 4.1 have zero recovery at f <= 0.5. An expert would then say two things.
The f = 0.25 and 0.5 'limits' measure the catalogue-error floor, not Dyson swarms. They are set by about 35 unexplained stars lying 0.3-1.1 mag below the main sequence. Their number changes by factors of 2-4 with astrometric cuts chosen after looking at the data, and nobody has established what they are. From the analyst's tables, they are not halo subdwarfs: the median tangential velocity is 29 km/s. My own checks found no excess of LAMOST-versus-Gaia radial-velocity discrepancies among the 23 with Gaia velocities (2 beyond 2 sigma, in line with the control rate), and the two deepest (TYC 2990-957-1 and Gaia DR3 3966264313442458112) are isolated point sources in Legacy Survey images. They concentrate at faint magnitudes and low parallax S/N, which points to measurement error, but that is not shown star by star.
The f >= 0.75 limits rest on a selection efficiency of 0.12-0.32 that is modelled, not measured.
Does the conclusion survive? At f >= 0.75, yes, robustly. A colour-magnitude check that uses no Teff or log g finds no LAMOST star among 520,000 more than 1.5 mag below the main-sequence ridge, and an independent selection-efficiency estimate that does not use the Gaia parent sample agrees within 15% (0.17 against 0.15 at f = 0.9). The limits of 2-4e-5 stand. At f <= 0.5 the conclusion survives only as a conservative order-of-magnitude statement, because every unexplained star is counted: about 1e-4 to 2.4e-4 at f = 0.5 and 5e-4 to 2e-3 at f = 0.25, for main-sequence stars. These must be quoted as ranges, not as 1.1e-4 and 5.2e-4.
Errors found
- major. The headline limits at f = 0.25 and 0.5
depend on astrometric cuts (RUWE < 1.2, parallax/error >= 50)
chosen after looking at the faint tail. With the pre-declared cuts the
LAMOST limits are 2.3e-3 and 2.4e-4, that is 4 and 2.3 times weaker. The
report discloses this, but the answer line and key numbers still quote
5.2e-4 and 1.1e-4 as single values, and no combined-sample limit under
the original cuts is given.
- Evidence: My rerun of the original-cut variant for LAMOST gives 91 / 44 unresolved / 1 / 0 candidates against 21 / 12 / 0 / 0 with the final cuts. The tightening is physically reasonable: under the original cuts the f = 0.25 rate is about 2.5e-3 at parallax/error 20-50 against 2.3e-4 to 2.9e-4 at >= 50, and 1.9e-3 to 2.5e-3 at RUWE 1.2-1.4 against about 2.5e-4 below 1.2. Real dimming cannot track RUWE. But the choice was made after seeing the data.
- Fix: Quote the f = 0.25 and 0.5 limits as ranges spanning both cut sets (about 5e-4 to 2e-3 and 1e-4 to 2.4e-4) wherever they appear, and compute the combined-sample values under the original cuts. The f = 0.75 and 0.9 limits can stay as single numbers.
- major. Robustness bullet 'Astrometry still matters
inside the final cuts. The rate is six times higher at RUWE 1.1-1.2 than
below 1.0' does not reproduce, and novelty item 4 ('the remaining tail
at f <= 0.5 tracks astrometric quality') rests on it. The factor six
is from data/astrometry_diagnostic.csv, which is computed on the
original-cut sample including parallax/error 20-50 stars.
- Evidence: Final clean LAMOST sample, f = 0.5: 1 flagged of 48,533 sensitive stars at RUWE 1.1-1.2 against 4 of 195,804 below 1.0 (ratio 1.0). f = 0.25: 3/11,192 against 6/47,573 (ratio 2.1, not significant). What does show up inside the final cuts: 20 of 21 f = 0.25 candidates and 11 of 12 f = 0.5 candidates are in the fainter half of the sample (robustness.csv), and the f = 0.25 rate is 3.9e-4 at parallax/error 50-70 against about 1e-4 above 100.
- Fix: Delete or rewrite the bullet. Restrict novelty item 4 to the tail that the tightened cuts removed. Report what the final sample does show: a concentration of candidates at faint apparent magnitude and low parallax S/N, with no significant RUWE trend.
- minor. The GALAH DR3 cross-check is circular. GALAH
DR3 surface gravities are computed from parallax-based luminosities, not
from the spectrum alone, so a genuinely dimmed star would also get a
high GALAH log g and a vanishing deficit. 'With them the deficit
vanishes in all 67' therefore cannot distinguish a parameter error from
real dimming. The same caution applies to GSP-Phot Teff, which is fitted
with parallax and apparent magnitude.
- Evidence: For the 67 flagged stars with GALAH values, GALAH log g is on average 0.57 dex higher than the survey log g (4.41 against 3.84), which is exactly what a parallax-informed log g does for a star below its spectroscopic luminosity. GALAH was not used to resolve any candidate, so no limit changes.
- Fix: Remove the GALAH sentence and the GALAH remark on TYC 7208-1115-1 in the candidate table, or state that GALAH log g is parallax-based and the test is uninformative. For the two f = 0.75 stars, rest the 'Teff overestimate' reading on the colour residuals (2.9-3.7 sigma too red), not on GSP-Phot.
- minor. 'Fraction of FGK stars' overstates the
population constrained at f <= 0.5. Stars with log g < 4.1 (26% of
the sample) contribute essentially no exposure there, and at f = 0.25
the exposure is almost all K and G dwarfs.
- Evidence: Three-way recovery for LAMOST subgiants is 0.000 at f = 0.25, 0.006 at f = 0.5, 0.42 at f = 0.75 and 0.79 at f = 0.9 (limits_raw_lamost.csv). At f = 0.25 the LAMOST sensitive stars are 60,242 K, 47,410 G and 3,712 F. The exposure sum handles this numerically; only the wording is wrong.
- Fix: State that the f = 0.25 and 0.5 limits apply to main-sequence stars only (log g >= 4.1), that the f = 0.25 limit is for K and G dwarfs, and that subgiants are constrained only at f >= 0.75.
- minor. The selection efficiency is described as
'measured' (headline) but is a model: it assumes survey inclusion
depends only on apparent magnitude and three colour classes, averaged
over the sky.
- Evidence: My two independent estimates for LAMOST give 0.85 / 0.66 / 0.39 / 0.17 against the analyst's 0.81 / 0.63 / 0.36 / 0.15, so the numbers are supported and slightly conservative.
- Fix: Call it modelled. Add an independent cross-check such as the distance-shift estimate (twins at larger distance, no parent sample needed), which removes most of the worry.
- minor. The end-to-end injection shortfall (0.92 of
the analytic recovery at f = 0.25, 0.98 at f = 0.5) is reported but not
applied to the headline limits.
- Evidence: injection_end_to_end.csv: LAMOST 0.55 against 0.60, APOGEE 0.685 against 0.741 at f = 0.25.
- Fix: Apply it: about 5.6e-4 at f = 0.25 and 1.11e-4 at f = 0.5, or state that the quoted limits are 2-8% optimistic. Note that the correction is measured on only 60-108 sensitive injected stars at f = 0.25.
- minor. 'DR2/DR3 parallax ratios are 0.98-1.04' is
wrong.
- Evidence: candidates_unresolved.csv: plx_ratio_dr2 ranges from 0.948 to 1.035 for the 39 stars.
- Fix: Change to 0.95-1.04.
- minor. For APOGEE the '2MASS Ks quality A/B, unique
match' cut is vacuous: build_samples.py hard-codes qfl = 'AAA', n2m = 1,
d2m = 0, so only the Ks error cut acts. The cut table lists it as if
applied.
- Evidence: build_apogee() in code/build_samples.py; the cut removes only 54 APOGEE stars. No effect on the combined limits, which LAMOST dominates.
- Fix: Say so in footnote (a), or attach real 2MASS flags for APOGEE.
- minor. Several candidate remarks come from hand
lookups outside the pipeline (SIMBAD emission-line class, RAVE DR6
values) and cannot be regenerated by run_all.py. Separately, the 'f =
0.75 candidates' have Ks deficits of only 62-64%; they are flagged at
0.75 because GSP-Spec scatter of about 0.1 dex puts the threshold at D
< -0.40.
- Evidence: I confirmed the SIMBAD entry for TYC 2990-957-1 (Em*, G4) but did not check the RAVE values. D = -0.449 and -0.422 for the two GSP-Spec stars.
- Fix: Script the lookups or mark them as manual and unverified. In the headline, say '2 stars with 62-70% deficits that cannot be excluded as 75% dimming at 2 sigma'.
- minor. The infrared comparison is slightly out of
date and loosely worded: 'reach covering fractions of a few per cent' is
not what Suazo et al. 2022 give (their grid is 0.1-0.9), and the
background-galaxy attribution now has direct confirmation.
- Evidence: arXiv abstracts retrieved 2026-10-12: JWST/MIRI shows candidates D and E are background galaxies; archival work finds contamination in B and C and suggestive or marginal evidence for A, E, F, H, J.
- Fix: Change to 'covering fractions down to about 10%'. Cite Ren, Garrett and Siemion (arXiv:2405.14921, with 2026 follow-up arXiv:2607.03619), Korn et al. 2026 (arXiv:2607.25701) and Zackrisson et al. 2026 (arXiv:2607.09460).
Overclaims
- '5.2e-4 (f = 0.25), 1.1e-4 (0.5)' quoted as single values: they hold only with astrometric cuts tightened after seeing the tail; the defensible statement is about 5e-4 to 2e-3 and 1e-4 to 2.4e-4.
- 'fraction of FGK stars': at f <= 0.5 only main-sequence stars are constrained (subgiant recovery is zero), and at f = 0.25 only the 17% best-calibrated stars, almost all K and G dwarfs.
- 'measured survey-selection efficiency': it is a model; it survives an independent check but should be called a model.
- 'This closes the cold or non-radiating swarm loophole... at the 1e-4 level': true only for grey swarms with f >= 0.5 around FGK main-sequence stars within 1 kpc at high latitude; at f = 0.25 the limit is 5e-4 to 2e-3, and M dwarfs, non-grey swarms and f > 0.97 are untouched. 'Narrows' is the supportable word.
- 'Evidence that the remaining tail at f <= 0.5 tracks astrometric quality' and 'the rate is six times higher at RUWE 1.1-1.2 than below 1.0 inside the final cuts': not reproduced in the final sample.
- 'With GALAH DR3 parameters the deficit vanishes in all 67': circular, because GALAH log g is derived from the parallax luminosity.
- 'three independent spectroscopic surveys': the spectra are independent, but all three share the same Gaia parallaxes and G/Ks photometry, so astrometric or photometric false positives are common to all.
- '2 unresolved candidates at 75%': the stars have 62-70% deficits and are flagged at the 0.75 level only because GSP-Spec scatter is about 0.1 dex.
- 'It is also immune to the background-galaxy confusion that undid the 2024 infrared candidates': true, but the method has its own unresolved confusion (39 unexplained stars), which should be said in the same sentence.
Novelty check
Novel: partly. The method is Zackrisson et al. 2018, as the analyst says. They used 8,441 Gaia DR1 + RAVE DR5 stars and explicitly declined to derive a population limit. I found no later paper that turns spectroscopic-versus-parallax luminosities into a limit on the fraction of dimmed stars. arXiv API searches (Dyson with spectrophotometric, parallax + spectroscopic, underluminous, subluminous, LAMOST, Gaia DR3, dimming, upper limit, Hephaistos) return only infrared work up to August 2026. So the quantitative limits, with injection-recovery and a selection model, appear to be new. Two qualifications. First, at f >= 0.75 the result is in substance the long-known emptiness of the region 1.5-2.5 mag below the main sequence for near-solar-metallicity disc stars; my colour-magnitude check reproduces the zero count without using Teff or log g, so spectroscopy contributes mainly the metallicity. Second, the claimed finding that the remaining tail tracks astrometric quality holds only for the tail removed by the tightened cuts. The f = 0.9 limit (3.9e-5) is weaker than the published infrared limit for 300 K swarms within 100 pc (2e-5); what is new is that it does not depend on waste-heat temperature.
- Zackrisson, Korn, Wehrhahn & Reiter 2018, ApJ 862, 21 (arXiv:1804.08351): the method; 8,441 stars; 6 outliers above 0.7 covering fraction; no population limit
- Suazo et al. 2022, MNRAS 512, 2988 (arXiv:2201.11123): infrared limits, under 2e-5 within 100 pc for 300 K, 90% spheres
- Suazo et al. 2024, MNRAS 531, 695 (arXiv:2405.02927): 7 infrared candidates among about 5 million stars
- Contardo & Hogg 2024 (arXiv:2403.18941): 53 mid-infrared excess candidates among about 5 million FGK stars
- Ren, Garrett & Siemion 2024 (arXiv:2405.14921) and Ren et al. 2026 (arXiv:2607.03619): background contamination of the Hephaistos candidates
- Blain 2024 (arXiv:2409.11447): 'Did WISE detect Dyson Spheres/Structures around Gaia-2MASS-selected stars?'
- Korn et al. 2026, Project Hephaistos III (arXiv:2607.25701)
- Zackrisson et al. 2026, Project Hephaistos IV (arXiv:2607.09460): JWST shows candidates D and E are background galaxies
Required changes
- Answer line, headline and key numbers: replace the single values at f = 0.25 and 0.5 with ranges that span the pre-declared and the tightened astrometric cuts (about 5e-4 to 2e-3 and 1e-4 to 2.4e-4), and add combined-sample limits under the original cuts to the robustness table. Keep 3.6e-5 and 3.9e-5 at f = 0.75 and 0.9.
- Robustness section: delete or rewrite the bullet 'Astrometry still matters inside the final cuts... six times higher at RUWE 1.1-1.2'. Inside the final LAMOST sample the rates are 1/48,533 against 4/195,804 at f = 0.5. State instead that candidates concentrate in the fainter half (20 of 21 and 11 of 12) and at parallax/error 50-70. Restrict novelty item 4 to the tail removed by the cuts.
- Vetting section and candidate table: remove the GALAH DR3 'deficit vanishes in all 67' statement and the GALAH remark on TYC 7208-1115-1, or state that GALAH log g is parallax-based so the test is circular. Do not use GSP-Phot Teff as independent evidence; cite the colour residuals.
- Scope wording throughout (answer, limitations, implications): the f = 0.25 and 0.5 limits apply to main-sequence stars with log g >= 4.1 (subgiant recovery 0.000 and 0.006); the f = 0.25 limit is for K and G dwarfs (3,712 F stars sensitive in LAMOST). Replace 'near the Sun' with 'within 1 kpc at mostly |b| > 17 deg'.
- Headline: change 'measured survey-selection efficiency' to 'modelled'. Add an independent cross-check of the efficiency to the robustness section (the distance-shift estimate gives 0.85 / 0.66 / 0.39 / 0.17 for LAMOST).
- Apply the end-to-end recovery factors (0.92 at f = 0.25, 0.98 at f = 0.5) to the quoted limits, or state that they are 2-8% optimistic.
- Implications section: soften 'closes the cold or non-radiating swarm loophole' to 'narrows it for grey swarms covering half or more of an FGK main-sequence star, at the 1e-4 level; at 25% covering the limit is 5e-4 to 2e-3'. Note that the f = 0.9 limit (3.9e-5) is weaker than the infrared limit for 300 K swarms within 100 pc (2e-5).
- Correct 'DR2/DR3 parallax ratios are 0.98-1.04' to 0.95-1.04.
- Headline and results: describe the two GSP-Spec stars as having 62-70% deficits that cannot be excluded as 75% dimming at 2 sigma, not as '75% candidates'.
- Cut-table footnote: state that the 2MASS quality and uniqueness cut is not applied to APOGEE (flags are hard-coded). Mark the SIMBAD and RAVE DR6 remarks as manual lookups, or script them.
- Prior-work section: change 'reach covering fractions of a few per cent' to 'down to about 10%' and add the 2025-2026 references on the Hephaistos candidates (arXiv:2607.03619, 2607.25701, 2607.09460).
- Method section: add one sentence saying that after the three-way criterion the test is 'below the main-sequence floor at fixed Teff, colour and [Fe/H]', and that at f >= 0.75 a colour-magnitude test with a metallicity estimate gives the same zero count (none of 520,000 LAMOST stars more than 1.5 mag below the ridge).