Where is everybody? · Working papers
Partial Dyson spheres among stars within 100 parsecs
Revised after a second, separate analysis run for this project tried to break it. Neither analysis is an outside expert.
A completeness-corrected infrared-excess census of main-sequence stars within 100 pc: limits on partial Dyson swarms
Revised after refereeing. Every number is regenerated by
code/run_all.py.
1. Question and answer
What fraction of nearby stars can host a partial Dyson swarm, meaning a structure that intercepts a fraction f of the stellar luminosity and re-radiates it as a blackbody at 100-600 K? The answer is wanted per (f, T) and per spectral class, with the search completeness measured by injection-recovery.
Answer. Of 273,856 main-sequence stars within 100 pc, 149,005 (54%) have AllWISE photometry clean enough to search, and 307 of those show a ≥ 5σ excess at 12 or 22 µm. Counting every one of the 307 as a possible swarm, whatever it has been identified as, the 95% upper limit on the fraction of stars hosting a 300 K swarm is 7.0e-4 at f = 1% (3.9e-4 to 1.0e-3 across 100-600 K and a model tolerance of 20-50%) and 8.2e-5 at f = 10% (8.2e-5 to 4.8e-4). This limit uses no identifications and is the headline. If the identifications are accepted, 37 stars remain unexplained and the limits tighten to 1.4e-4 (0.7e-4 to 2.0e-4) at 1% and 2.2e-5 (2.2e-5 to 1.5e-4) at 10%. The main caveats:
- WISE photometry cannot tell a 0.2-8% warm swarm from a debris disc, or from a dusty galaxy within about 1 arcsec of the star. No star requires an artificial explanation, but these data alone exclude none.
- The 10% value sits beside a steep step: at f = 0.05 the limits are 3.5e-4 (every excess) and 1.2e-4 (identifications accepted).
- The pooled limits assume the same swarm rate in every spectral class. Per class at 1%: FGK 1.9e-4, M 1.0e-3. The M value applies to M0-M4.5; later M dwarfs (24% of M dwarfs) are essentially unconstrained at 1%.
- 46% of stars are not searchable, and only single-temperature swarms at 100-600 K are tested.
2. Data
| Source | Use | Rows |
|---|---|---|
| Gaia Catalogue of Nearby Stars (VizieR J/A+A/649/A6 table1c; includes 2MASS) | parent sample | 331,312 |
| AllWISE Source Catalog (IRSA TAP), 12 arcsec cones at the Gaia position moved to epoch 2010.5 | W1-W4 fluxes, flags, neighbours | 260,663 stars matched within 3 arcsec |
| AllWISE, 6 arcsec cones 90 arcsec north of every star | chance-alignment rate | 331,312 positions |
| SIMBAD and CDS XMatch: 12 positional catalogues, 7 excess and young-star catalogues, SIMBAD's object list for Sgro & Song 2021 | vetting | 307 excess and 3,070 comparison stars |
| CDS hips2fits cutouts (AllWISE; PS1, Legacy DR10 or DSS2) | image check | about 3,600 |
Also used: the SFD dust map, the Mamajek dwarf table and the WISE response curves.
Parent sample. Median distance ≤ 100 pc (300,567); G and RP present (294,748); main sequence (273,856) after removing 16,638 white dwarfs and subluminous objects, 3,214 evolved stars and 1,040 objects fainter than M_G = 16.6. Classes are defined by absolute G magnitude alone, not spectroscopy. "A" (M_G < 2.51; 1,678 stars) contains B9.5-F0 stars and at least one giant. "FGK" (60,518) contains over-luminous pre-main-sequence K and M stars such as TW Hya and AU Mic. "M" has 211,660.
Searchability cuts were chosen from contamination arguments and from the negative tail of the significance distribution only:
| Cut | Stars remaining |
|---|---|
| AllWISE match within 3 arcsec | 260,663 |
| 2MASS Ks with an uncertainty and positive W1 flux | 257,163 |
| WISE source not shared with a brighter GCNS star | 253,442 |
| Separation ≤ 0.4 arcsec + 0.35 × proper motion | 244,297 |
| SFD E(B-V) < 0.15 | 171,606 |
| Not blended (nb = 1, na = 0), ext_flg ≤ 1 | 164,353 |
| W1 contamination flag clear | 150,029 |
| Per band: flag clear, rchi2 < 3 + (0.04 S/N)², no AllWISE neighbour within 12 arcsec above 3σ | W3 145,963; W4 148,736; either 149,005 |
3. Method
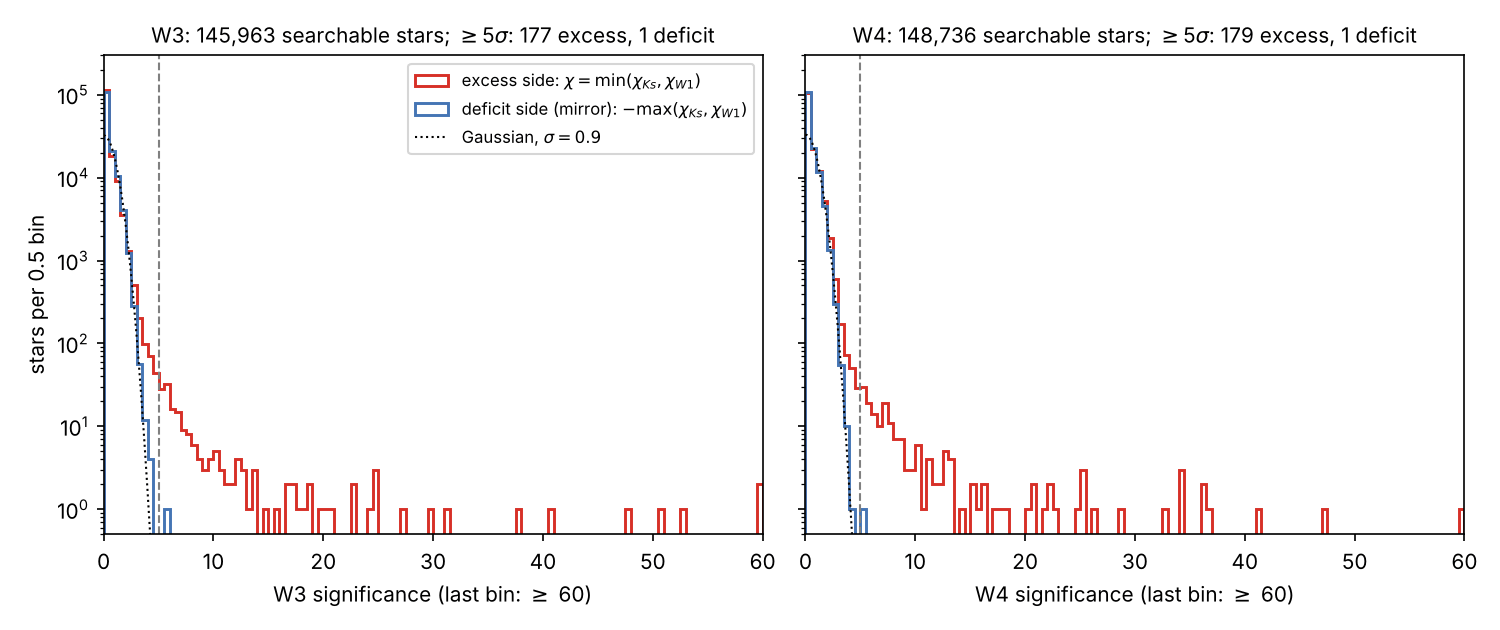
Photosphere and significance. W3 and W4 photospheric fluxes are predicted from two anchors (Ks; saturation-corrected W1) with empirical colour loci in M_G and G-RP and fitted error floors. Profile-fit fluxes are used as forced photometry, negatives included. The significance is χ = min(χ_Ks, χ_W1); its mirror measures the noise tail.
Swarm model. F_ν = f F_bol πB_ν(T)/(σT⁴) through the WISE response curves, with the host dimmed by (1 - f). F_bol comes from Ks and a Mamajek bolometric correction.
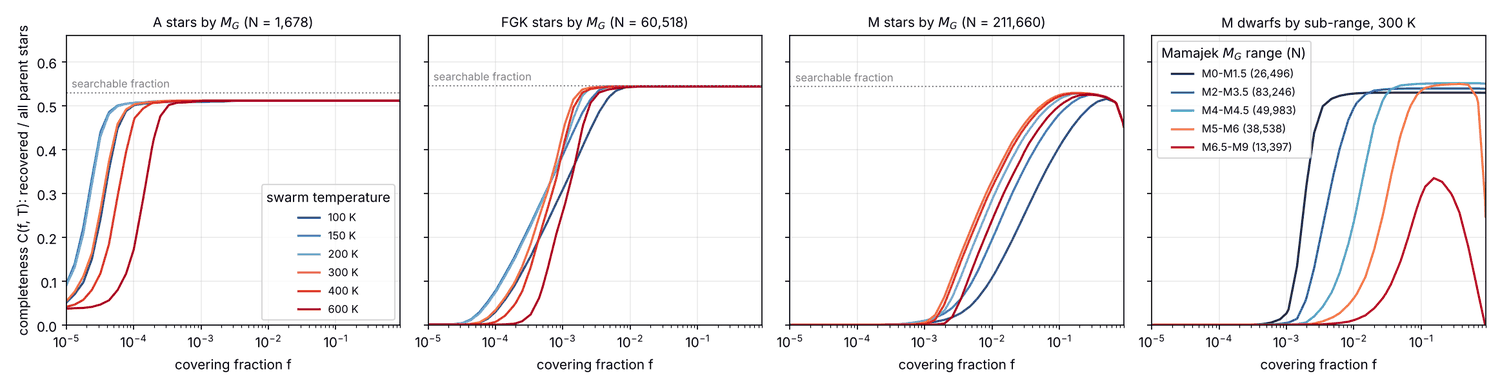
Injection-recovery. For 57 values of f from 1e-5 to 0.9 and six temperatures, the swarm is added to each star's actual measurements and the pipeline is rerun. A star is recovered if the dimmed host would still be in the sample and passes the 5σ threshold in a searchable band. C(f, T) is the recovered fraction of all parent stars.
Chance alignments. Each AllWISE source at a control position is superposed on the star that owns that position. Two estimators are used: an analytic Gaussian-beam trigger area capped at the blending radius (6 arcsec in W3, 8 arcsec in W4), and a direct count of control sources at their actual offsets for caps of 3, 4 and 6 arcsec.
Vetting, in priority order:
- Independent youth evidence: SIMBAD young-star type or young-association membership.
- Published infrared-excess catalogue only. This is an identification, not an explanation, because a swarm host would earn the same entry.
- Other known type (CVs).
- Catalogued background galaxy, AGN, radio source or extended optical source in the beam.
- Image offset: the W3 or W4 centroid is displaced from the star by more than the 99th percentile of non-excess stars of equal S/N.
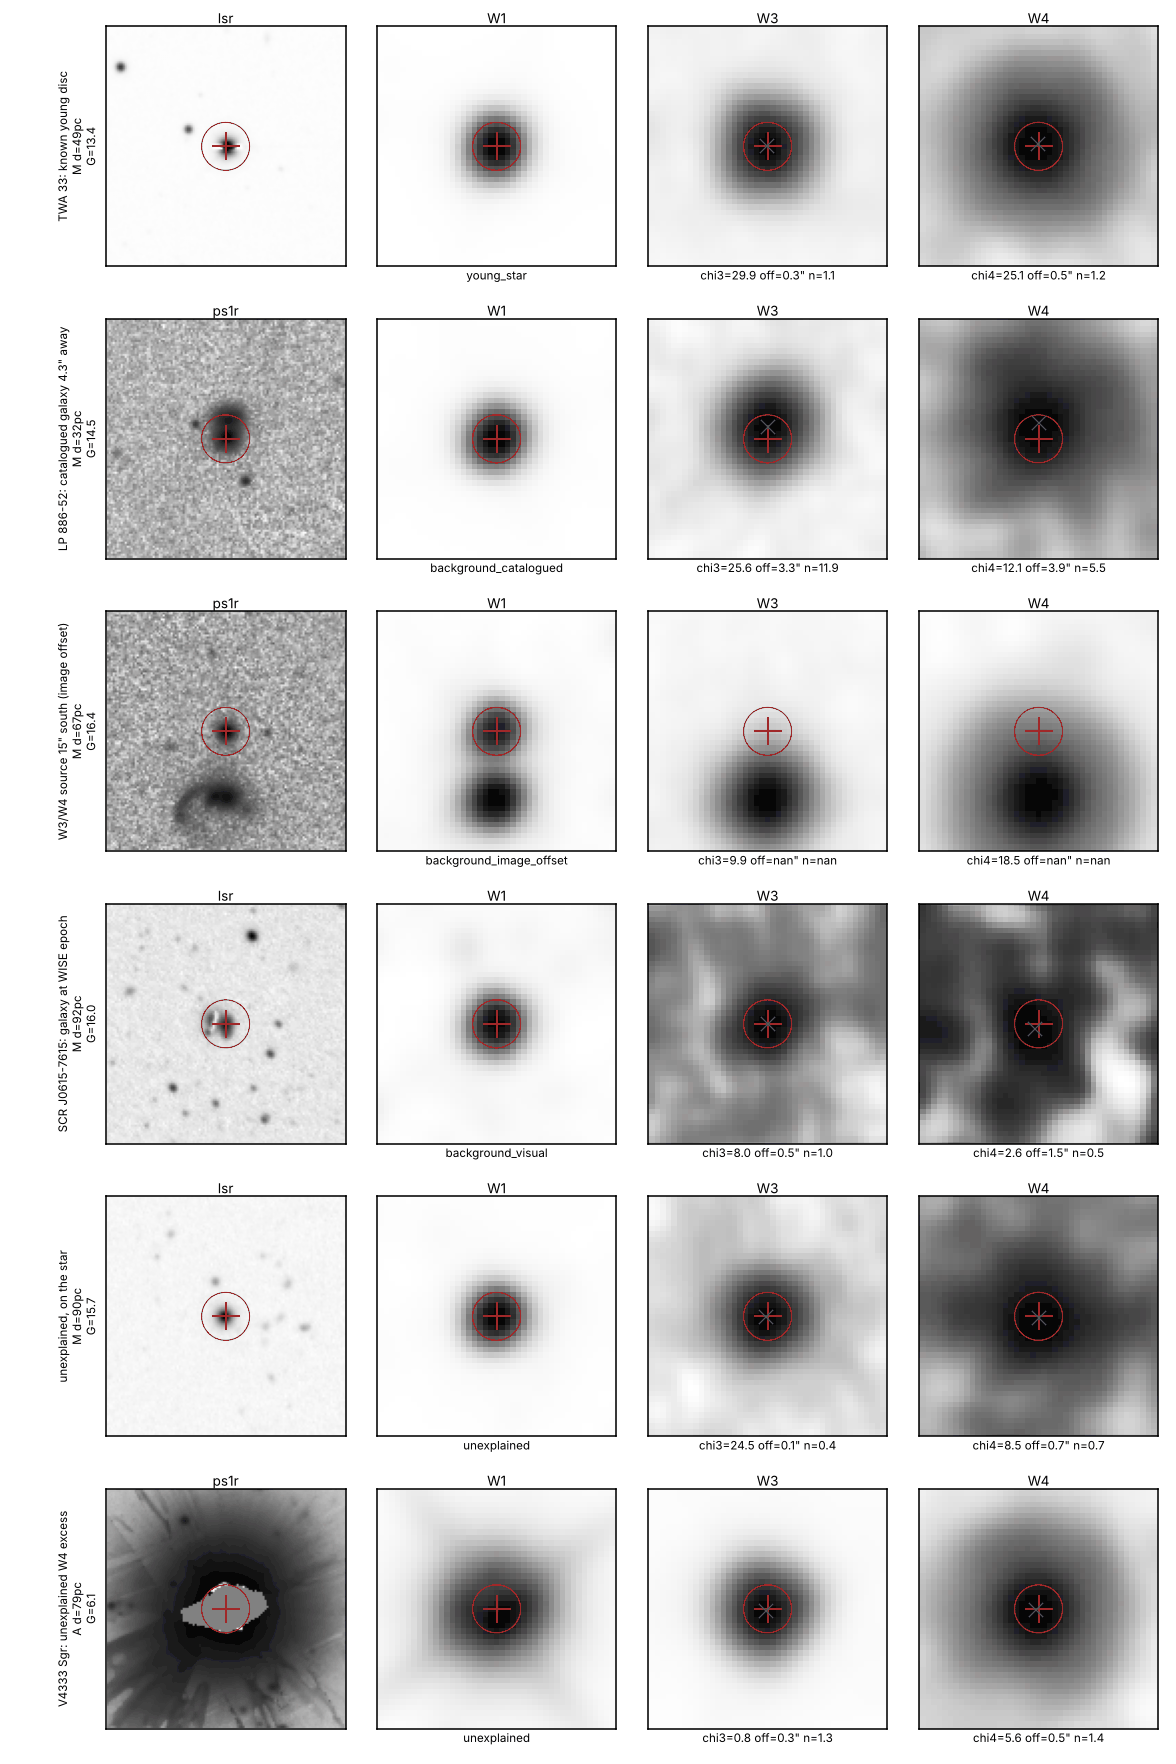
- Manual inspection of cutouts (six stars,
data/visual_vetting.csv). - Co-moving Gaia companion in the beam.
W1-W2, J-Ks, GCNS probability, Gaia blending flags and Gaia neighbours are recorded for every unexplained star but are not used to classify, so the unexplained count is conservative.
Limits. N_rec is the number of stars in which the injected swarm is recovered. k counts excess stars in which that swarm would be detectable and whose observed excess is at least (1 - tol) × model - 2σ in every searchable band (tol = 0.2). The test is one-sided, so a star with more excess than the model is counted. The limit is the one-sided 95% Clopper-Pearson bound on k/N_rec, in three versions:
- every excess: all excess stars, no labels used;
- strict: unexplained stars plus catalogue-only identifications;
- identifications accepted: unexplained stars only.
The last two are divided by 0.94 ± 0.02, the probability that an on-star source survives the background vetting. Quoted ranges span the six temperatures and tol = 0.2 and 0.5.
4. Results
Noise. At ≥ 5σ there are 177 W3 and 179 W4 excesses (307 stars) against 1 + 1 on the mirror side (Fig. 1).
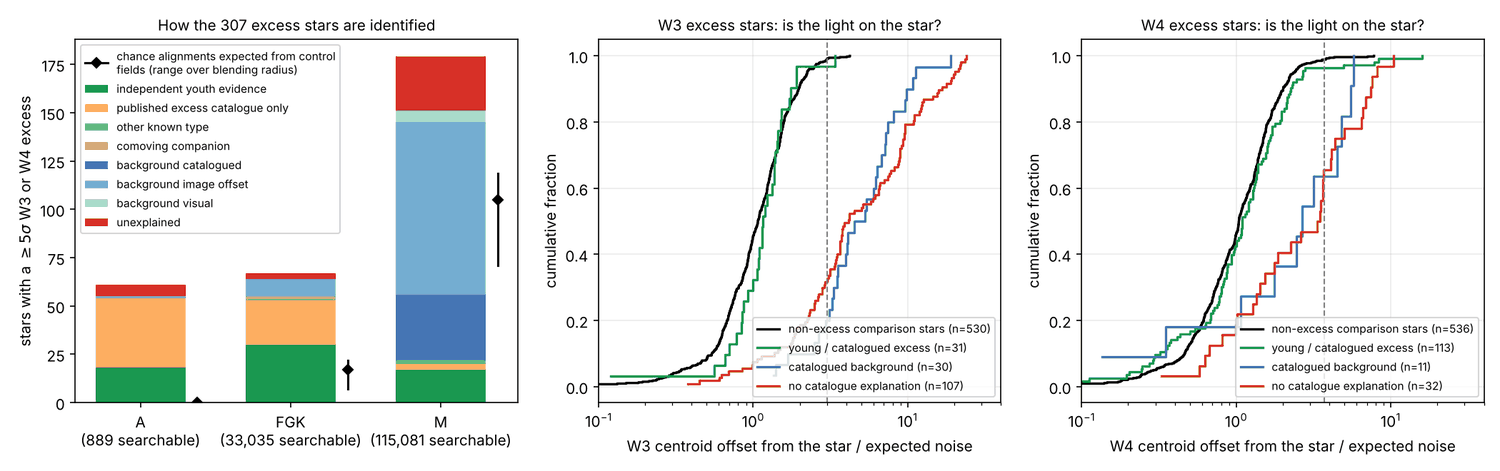
Accounting (Fig. 4, Fig. 5):
| A | FGK | M | all | |
|---|---|---|---|---|
| searchable stars | 889 | 33,035 | 115,081 | 149,005 |
| excess stars | 61 | 67 | 179 | 307 |
| independent youth evidence | 18 | 30 | 17 | 65 |
| published excess catalogue only | 36 | 23 | 3 | 62 |
| CV | 0 | 0 | 2 | 2 |
| background, catalogued | 0 | 0 | 34 | 34 |
| background, image offset | 1 | 9 | 89 | 99 |
| background, manual inspection | 0 | 0 | 6 | 6 |
| co-moving companion in beam | 0 | 2 | 0 | 2 |
| unexplained | 6 | 3 | 28 | 37 |
| excess stars without youth or catalogue identification | 7 | 14 | 157 | 178 |
| chance alignments expected, analytic (caps 6 / 8 arcsec) | 0 | 22 | 119 | 140 |
| chance alignments expected, direct count ≤ 6 arcsec | 0 | 17 | 105 | 122 |
| chance alignments expected, direct count ≤ 4 arcsec | 0 | 7 | 71 | 78 |
About 120-140 chance alignments are expected (statistical ± 9 to 11) for a blending radius of 6-8 arcsec, and 78 if only sources within 4 arcsec merge. A neighbour census supports the larger radius. W3-detected, galaxy-coloured sources are catalogued separately next to M-dwarf targets at 0% (0-2 arcsec), 0.4% (2-4 arcsec) and 7.6% (4-6 arcsec) of their density at control positions, so inside 6 arcsec they are almost always merged into the star. For FGK stars 17-22 are expected; 14 non-young excesses plus 5 offset-flagged young or catalogued stars are seen.
Two further lines of evidence, not independent of each other, say most M-dwarf excesses are background sources:
- The catalogue background criteria fire on 21.7% (34/157) of M excess stars without a youth or catalogue identification, and on 1.3% (23/1,790) of matched non-excess M dwarfs.
- The centroid test flags 79% (27/34) of catalogued-background stars, the set on which its efficiency is calibrated, and 4.7% (6/127) of young or catalogued-excess stars.
The unexplained stars
(data/unexplained.csv).
- Six A-class stars have W4-only excesses of 25-40% of the photosphere, centred on the star. That is ordinary debris-disc level.
- Three K stars have on-star W3 and W4 excesses equivalent to 160-330 K and f = 0.2-0.6%. SIMBAD attaches two of them to Sgro & Song (2021).
- Of the 28 M dwarfs, the 18 with both bands measured are equivalent
to 166-299 K and f = 0.2-8.4%, the same appearance as the Suazo et al.
(2024) candidates. The secondary indicators say:
- Ten have a Gaia source within 4 arcsec that is not shown to be co-moving, against 5.1% (92/1,790) of comparison stars. That is about nine more than chance.
- The 79 ± 7% centroid efficiency implies, roughly, that 10-17 unrecognised background sources remain among the 28.
- Four of the 24 with clean Gaia photometry lie more than 1 mag above the main sequence, against 5.6% of clean searchable M dwarfs and 11 of 16 known young M dwarfs. Three of the four also have W1-W2 above the 99th percentile of non-excess M dwarfs and are in the Sgro & Song list (Gaia DR3 4936999799344230400, 4655994623337799808, 6103605585151491840). They are probably unrecognised young discs.
- Three other apparently over-luminous stars have blended or flagged Gaia photometry, so their height above the main sequence is an artefact. One, Gaia DR3 6886178038419703168, is a 0.5 arcsec pair that SIMBAD types as an emission-line star.
- Gaia DR3 6202851314311763072 has GCNS probability 0.38, J-Ks = 3.2 and W1-W2 = 1.6, so it is not a normal M dwarf.
- SCR J0615-7615, unexplained in the first pass, is now classed as background. The Legacy DR10 image shows an extended object within about 1 arcsec of where this fast-moving star stood in 2010.
Completeness (Fig. 2). The median minimum detectable f at 300 K among searchable stars is 4e-5 (A), 6e-4 (FGK) and 8e-3 (M). M dwarfs by sub-range (Mamajek M_G boundaries) at 300 K, with k in brackets:
| Sub-range | Stars | C (f = 0.01) | every excess, f = 0.01 | accepted, f = 0.01 | C (f = 0.1) | every excess, f = 0.1 |
|---|---|---|---|---|---|---|
| M0-M1.5 | 26,496 | 0.53 | 4.5e-4 [2] | 2.3e-4 [0] | 0.53 | 2.1e-4 |
| M2-M3.5 | 83,246 | 0.50 | 1.0e-3 [32] | 2.4e-4 [4] | 0.54 | 6.7e-5 |
| M4-M4.5 | 49,983 | 0.24 | 2.5e-3 [20] | 7.0e-4 [3] | 0.55 | 1.1e-4 |
| M5-M6 | 38,538 | 0.062 | 2.6e-3 [2] | 1.3e-3 [0] | 0.53 | 3.1e-4 |
| M6.5-M9 | 13,397 | 0.011 | 1.9e-2 [0] | 2.0e-2 [0] | 0.30 | 2.3e-3 |
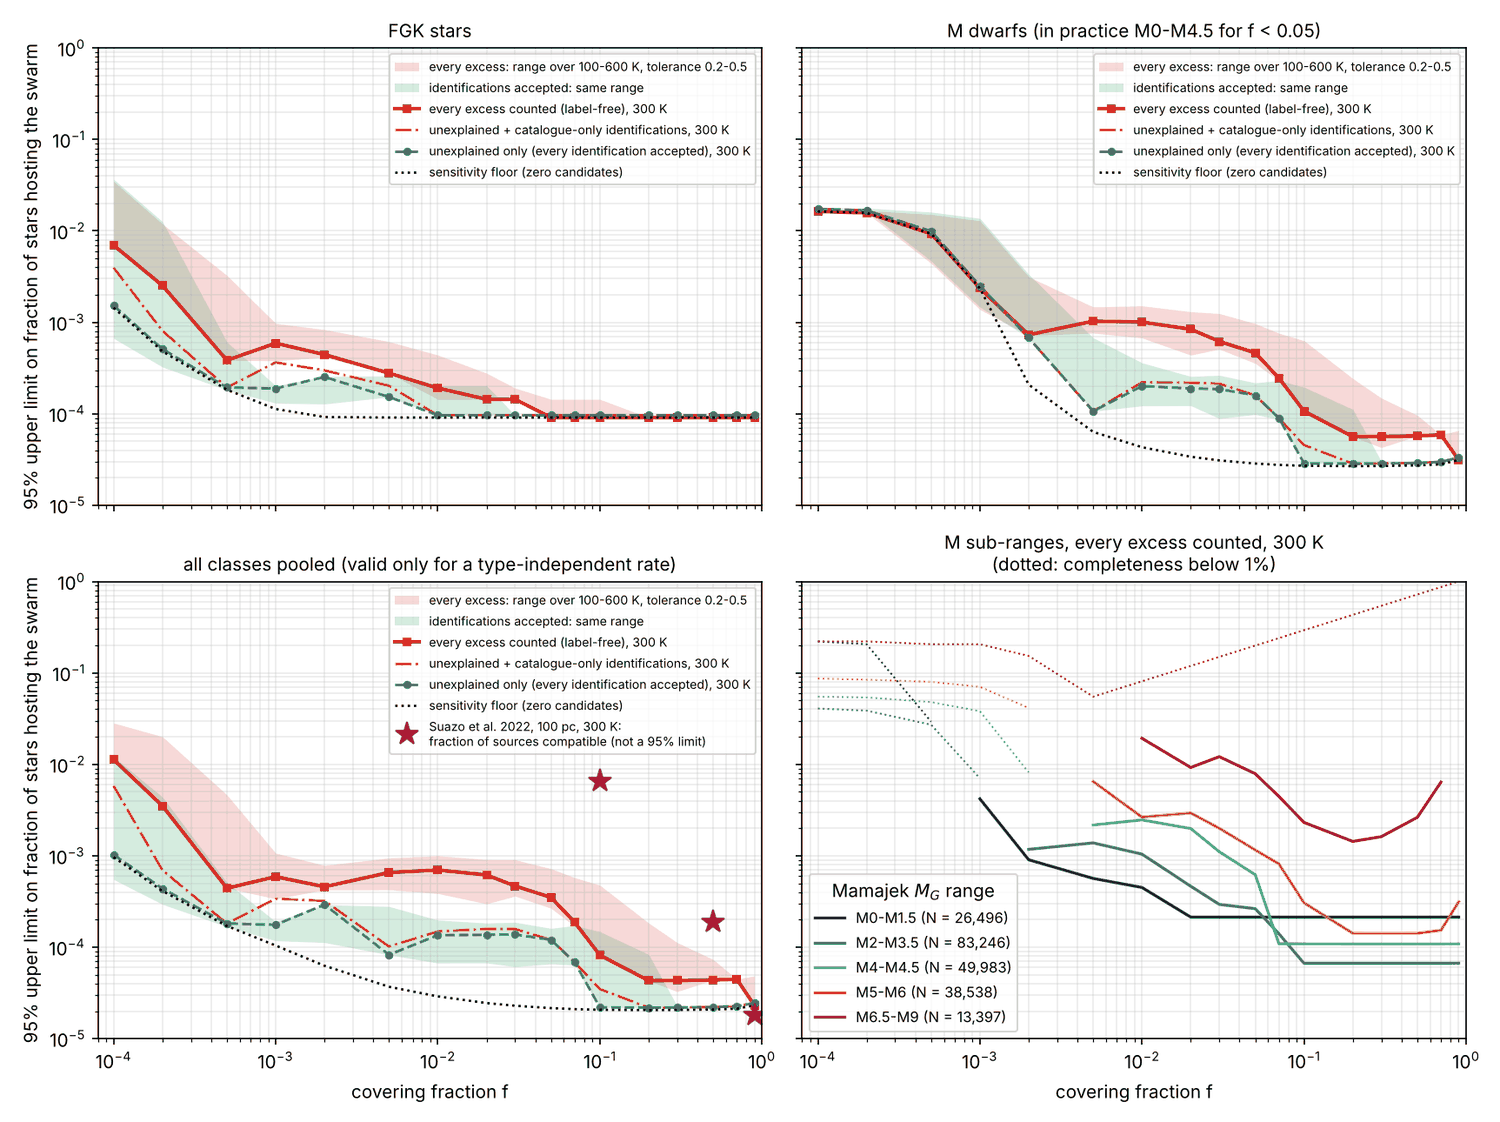
Limits at 300 K (Fig. 3). Each cell gives every excess / strict / identifications accepted, with k in brackets. With k = 0 the label-dependent limits sit 6% above the every-excess limit because of the vetting correction.
| f | C (FGK) | FGK | C (M) | M | all classes pooled |
|---|---|---|---|---|---|
| 1e-3 | 0.44 | 5.9e-4 / 3.7e-4 / 1.9e-4 [9/4/1] | 0.006 | no sensitivity | 5.9e-4 / 3.4e-4 / 1.8e-4 [10/4/1] |
| 0.01 | 0.54 | 1.9e-4 / 9.6e-5 / 9.6e-5 [2/0/0] | 0.33 | 1.0e-3 / 2.2e-4 / 2.0e-4 [56/8/7] | 7.0e-4 / 1.5e-4 / 1.4e-4 [58/8/7] |
| 0.02 | 0.54 | 1.4e-4 / 9.6e-5 / 9.6e-5 [1/0/0] | 0.42 | 8.4e-4 / 2.2e-4 / 1.9e-4 [60/11/9] | 6.2e-4 / 1.6e-4 / 1.4e-4 [61/11/9] |
| 0.05 | 0.54 | 9.1e-5 / 9.6e-5 / 9.6e-5 [0/0/0] | 0.50 | 4.6e-4 / 1.6e-4 / 1.6e-4 [37/9/9] | 3.5e-4 / 1.2e-4 / 1.2e-4 [37/9/9] |
| 0.1 | 0.54 | 9.1e-5 / 9.6e-5 / 9.6e-5 [0/0/0] | 0.52 | 1.1e-4 / 4.5e-5 / 2.9e-5 [6/1/0] | 8.2e-5 / 3.5e-5 / 2.2e-5 [6/1/0] |
| 0.5 | 0.54 | 9.1e-5 / 9.6e-5 / 9.6e-5 [0/0/0] | 0.52 | 5.7e-5 / 2.9e-5 / 2.9e-5 [2/0/0] | 4.4e-5 / 2.2e-5 / 2.2e-5 [2/0/0] |
| 0.9 | 0.54 | 9.1e-5 / 9.6e-5 / 9.6e-5 [0/0/0] | 0.45 | 3.1e-5 / 3.3e-5 / 3.3e-5 [0/0/0] | 2.3e-5 / 2.5e-5 / 2.5e-5 [0/0/0] |
Ranges over 100-600 K and tolerance 0.2-0.5
(data/limit_ranges.csv; per-temperature values are in
data/limits.csv):
| f | FGK, every excess | M, every excess | M, accepted | pooled, every excess | pooled, strict | pooled, accepted |
|---|---|---|---|---|---|---|
| 0.01 | 1.4e-4 to 4.4e-4 | 6.8e-4 to 1.5e-3 | 1.2e-4 to 3.6e-4 | 3.9e-4 to 1.0e-3 | 6.7e-5 to 2.2e-4 | 6.7e-5 to 2.0e-4 |
| 0.05 | 9.1e-5 to 1.4e-4 | 3.6e-4 to 9.7e-4 | 9.8e-5 to 2.2e-4 | 2.7e-4 to 7.2e-4 | 8.1e-5 to 1.8e-4 | 6.6e-5 to 1.6e-4 |
| 0.1 | 9.1e-5 to 1.4e-4 | 1.1e-4 to 6.3e-4 | 2.9e-5 to 2.0e-4 | 8.2e-5 to 4.8e-4 | 3.5e-5 to 1.7e-4 | 2.2e-5 to 1.5e-4 |
At f = 0.1 the 300 K, tol = 0.2 value is the bottom of the range, because the brightest unexplained M dwarfs are equivalent to f = 0.03-0.08, just below the tolerance. With tol = 0.5 the 300 K pooled limits are 2.3e-4 (every excess, k = 24) and 6.7e-5 (accepted, k = 4). The limits are weakest at 100 K and 600 K.
What sets the limit.
- A: natural discs for f ≤ 2e-4 to 5e-4. Above that, sensitivity (3.5e-3, from only 858 recoverable stars).
- FGK: excess sources for f ≤ 0.01 (0.02 at 600 K), sensitivity (9e-5) above. The FGK every-excess limit is in effect the bright end of the known warm-excess luminosity function re-expressed in covering fraction.
- M: no sensitivity below f ≈ 0.002 (completeness < 1%). For 0.002 ≤ f ≤ 0.7 the every-excess limit is set by excess sources, which for M dwarfs are mostly background galaxies.
Comparison with earlier work.
- Suazo et al. 2022 quote, for 265,724 sources within 100 pc at 300 K, the fraction of sources whose colours are compatible with a Dyson sphere: 6.6e-3, 1.9e-4 and 1.8e-5 at covering fraction 0.1, 0.5 and 0.9. Those are not 95% limits and involve no vetting or injection-recovery, so the comparison is not like for like. The every-excess 95% limits here are 8.2e-5, 4.4e-5 and 2.3e-5: about 80 times lower at 0.1 (28 times with tol = 0.5), 4 times lower at 0.5, and no better at 0.9. Their values are near unity below 0.01, where this work gives 5e-4 to 7e-4 at 300 K (below f ≈ 0.002 that is a limit on A and FGK stars only).
- Suazo et al. 2024 report seven M-dwarf candidates at 143-275 pc (covering fraction 0.03-0.16, 100-275 K). Radio imaging has since shown that candidate G is a background AGN (Ren et al. 2024, 2025), and JWST/MIRI that candidates D and E are background galaxies within about 1 arcsec (Zackrisson et al. 2026; see also Korn et al. 2026 and Blain 2024). Ren, Garrett & Zackrisson (2026) applied the same Gaia-to-AllWISE-epoch centroid comparison used here to nine candidates and found no sign of contamination in candidate D. A centroid test is therefore blind inside about 1 arcsec, and that applies equally to the 28 unexplained M dwarfs here.
- Sgro & Song 2021 searched Gaia DR2 K/M dwarfs within 100 pc for W3/W4 excess and reported 37 new candidates plus 12 known excess stars. There is no machine-readable table, so I use the 76 Gaia sources SIMBAD attaches to the paper: 71 are in the parent sample, 42 are searchable and 28 are excess stars here. Of those 28, 12 have independent youth evidence, 2 are catalogue-only, 8 are unexplained, 5 are classed here as background and 1 has a co-moving companion. The on-star M-dwarf census here (17 young, 3 catalogue-only, 28 unexplained) is similar in size to theirs.
- Contardo & Hogg 2024 find 53 W1/W2-excess objects among 4.9 million FGK stars (1.1e-5), a rate a 100 pc sample cannot reach.
- Debris discs. At 5σ I recover 48 of 140 Patel et al. (2014) hosts in the searchable sample (59% above 3σ) and 56 of 177 Cotten & Song (2016) Prime stars. The incidence of W3 excess ≥ 25% of the photosphere among FGK stars is 1.7e-4 (5/29,769; 68% interval 1.0e-4 to 2.8e-4), in line with about 1e-4 for the dustiest old Sun-like stars (Kennedy & Wyatt 2013).
5. Robustness checks
Pooled limits at 300 K (data/robustness.csv). The
label-dependent columns include the vetting correction.
| Variant | Excess / mirror negatives | Every excess, f = 0.01 | Accepted, f = 0.01 | Every excess, f = 0.1 | Accepted, f = 0.1 |
|---|---|---|---|---|---|
| baseline | 307 / 2 | 7.0e-4 | 1.4e-4 | 8.2e-5 | 2.2e-5 |
| threshold 4σ | 471 / 7 | 1.1e-3 | not vetted | 9.0e-5 | not vetted |
| threshold 6σ | 210 / 0 | 4.6e-4 | not vetted | 6.4e-5 | not vetted |
| E(B-V) < 0.10 | 256 / 1 | 7.0e-4 | not vetted | 8.3e-5 | not vetted |
| E(B-V) < 0.30 | 372 / 4 | 7.2e-4 | not vetted | 8.7e-5 | not vetted |
| tolerance 0 | 307 / 2 | 5.7e-4 | 1.2e-4 | 5.4e-5 | 2.2e-5 |
| tolerance 0.5 | 307 / 2 | 9.2e-4 | 1.5e-4 | 2.3e-4 | 6.7e-5 |
| catalogue-only identifications counted as unexplained | 307 / 2 | 7.0e-4 | 1.5e-4 | 8.2e-5 | 3.5e-5 |
| no manual inspection (43 unexplained) | 307 / 2 | 7.0e-4 | 1.6e-4 | 8.2e-5 | 2.2e-5 |
| catalogues only, no image information | 307 / 2 | 7.0e-4 | 5.4e-4 | 8.2e-5 | 3.5e-5 |
| parent sample with GCNS probability > 0.5 | 305 / 2 | 7.0e-4 | 1.4e-4 | 8.2e-5 | 2.2e-5 |
- Counting catalogue-only identifications as unexplained also gives 3.4e-4 at f = 1e-3 (1.8e-4 otherwise).
- A single anchor gives 358 excesses and 2 negatives (Ks only) or 364 and 58 (W1 only).
6. Limitations
- Only 54% of stars are searchable. Extending the limits to all stars assumes the rest are similar.
- The label-dependent limits are only as good as the labels: 62 identifications are catalogue entries, 99 are statistical centroid classifications and six are manual.
- The centroid test cannot see a contaminant within about 1 arcsec, and WISE data cannot resolve the unexplained M dwarfs individually.
- M dwarfs have no sensitivity below f ≈ 0.002, and M5 and later are essentially unconstrained at f = 0.01.
- The chance-alignment expectation depends on the blending radius (78 to 140 for 4 to 8 arcsec).
- The swarm is a single-temperature grey blackbody at 100-600 K. Colder waste heat (for example Garrett 2026) and non-thermal or beamed emission are unconstrained. F_bol is good to about 10%.
- SIMBAD and CDS content changes with time, so a rerun from an empty cache may move a few classifications.
7. Closest prior work and what is new
The closest work is Suazo et al. (2022). New here:
- A per-star injection-recovery completeness function C(f, T) for partial swarms in the volume-limited 100 pc main-sequence sample, by class and M sub-range. I found no earlier stellar search that publishes one. Curtis et al. (2026) use injection-recovery for galaxy-scale waste heat.
- Counted-star 95% limits, including the first non-trivial 100 pc limits at f = 1e-3 to 1e-2.
- A full accounting of every excess, with a measured chance-alignment rate (two estimators and a neighbour census) and a centroid test calibrated on a null sample.
- An explicit boundary, per class, between sensitivity-limited and confusion-limited regimes.
Not new: the f ≥ 0.5 limits (they reproduce Suazo et al. 2022); the centroid comparison as a method (Suazo et al. 2024; Ren et al. 2026); the conclusion that such M-dwarf excesses are mostly background galaxies (Ren et al., Blain, JWST); the FGK excess incidence (Kennedy & Wyatt 2013); and much of the M-dwarf candidate list (Sgro & Song 2021).
Confidence that items 1, 2 and 4 are new: medium.
8. Implications for the Fermi Paradox
If every settled system built a 300 K swarm, the 95% upper limit on the number of settled systems within 100 pc is as follows. Each value is the limit × the number of stars in the class, which extrapolates to the unsearchable stars. Brackets give the range over 100-600 K and tolerance.
| stars | 1% swarm, every excess | 1% swarm, accepted | 10% swarm, every excess | 10% swarm, accepted | |
|---|---|---|---|---|---|
| A | 1,678 | 5.8 | 6.2 | 5.8 | 6.2 |
| FGK | 60,518 | 11.6 (8.5-27) | 5.8 (5.8-12) | 5.5 (5.5-8.5) | 5.8 |
| M | 211,660 | 213 (143-321) | 43 (26-76) | 23 (23-133) | 6.1 (6.1-41) |
| sum of classes | 273,856 | 230 | 55 | 34 | 18 |
| pooled, if the rate is the same in every class | 273,856 | 191 | 37 | 22 | 6.0 |
A class with zero candidates and about 50% completeness cannot give fewer than about 6. The M row at 1% is in practice an M0-M4.5 limit. Summing the M sub-ranges separately gives 222 for M0-M4.5 and 360 for the 51,935 later M dwarfs, which is no real constraint on the latter.
This is a null result with a clear boundary. Large warm absorbers are rare or absent among solar-neighbourhood stars. Explanations of the Fermi paradox in which settlement is common and each settled system turns even 1% of its starlight into warm waste heat are limited to fewer than about one star in a thousand locally. The data say little about swarms below f ≈ 1e-3 around M dwarfs, about late-M hosts, about structures colder than 100 K, or about civilisations that build no star-scale absorbers. Deeper limits from WISE-class data are blocked by confusion with natural discs and background galaxies, not by sample size. Sub-arcsecond mid-infrared imaging of the 37 unexplained stars would remove most of the remaining ambiguity.
9. Response to referee
| Referee point | Action |
|---|---|
| The 10% headline sits on a cliff | Accepted. f = 0.03 and 0.07 were added to the grid. Every limit is computed for tolerance 0.2 and 0.5 and given with its range over temperature and tolerance, and the first paragraph states the f = 0.05 values. My ranges are wider than the referee's suggested ones because temperature and tolerance are varied jointly. |
| Pooled limits and system counts assume a class-independent rate | Accepted. Section 8 gives counts per class and their sum, and the pooled figure is labelled. The M sub-range table was added and the 1% M limit is stated to apply to M0-M4.5. |
| Literature out of date | Accepted. Verified through the arXiv API and Crossref and now cited: Zackrisson et al. 2026 (arXiv:2607.09460), Korn et al. 2026 (2607.25701), Ren, Garrett & Zackrisson 2026 (2607.03619), Ren et al. 2025 (2501.05152), Sgro & Song 2021 (MNRAS 508, 3084), Curtis et al. 2026 (2608.12458), Garrett 2026 (2608.31153). The centroid test is no longer claimed as a new method. A quantitative comparison with Sgro & Song was added. |
| Youth argument partly wrong | Accepted. The indicator now requires clean Gaia photometry, which gives 4 of 24 instead of 7 of 29. |
| Unexplained list holds identifiable objects | Accepted. unexplained.csv now carries W1-W2, J-Ks, GCNS
probability, blending flags, Gaia neighbours and a Sgro & Song flag.
SCR J0615-7615 was inspected and reclassified as background (the sixth
manual classification). The other flagged stars stay counted as
unexplained. |
| Chance-alignment precision overstated | Accepted. A direct-count estimator (122 within 6 arcsec, against the referee's 124) and the neighbour census were added. The text quotes about 120-140 and gives the 4 arcsec value. |
| Suazo et al. 2022 comparison not like for like | Accepted. The difference in definition is stated and "300 times" is removed. |
| Vetting-pass correction optimistic | Accepted. It is now 0.94 ± 0.02 (a flag in either band rejects; the
6/127 rate on young or catalogued stars is used), applied in
limits.csv and robustness.csv. |
| "Independent" lines of evidence; catalogue-only label circular | Accepted. Reworded. "Young or known disc" is split into 65 with independent youth evidence and 62 catalogue-only, and a strict limit that counts the latter as unexplained is given throughout. |
| Classes defined by M_G; lead with the every-excess limits | Accepted. Stated in Section 2; Sections 1 and 8 lead with the every-excess limits. |
| Optional: require GCNS probability > 0.5 | Not adopted as the baseline, because it would change a sample cut after looking at the positive tail. It is given as a robustness variant and changes no limit. |
| "A measurement of excess incidence with a Dyson label" | Partly rejected. For FGK stars the every-excess limit is indeed the known excess incidence re-expressed in f, and the report now says so. The completeness function in (f, T), the M-dwarf limits and the confusion boundary are not available from disc surveys. |
Figures and files
Figures in figures/: fig1_significance.png
(excess and mirror significance), fig2_completeness.png
(C(f, T) by class and M sub-range), fig3_limits.png (limits
in three versions with ranges), fig4_accounting.png
(identifications and centroid offsets), fig5_cutouts.png
(example cutouts). Tables are in data/; the entry point is
code/run_all.py.
Key numbers
| Quantity | Value | Uncertainty | Note |
|---|---|---|---|
| Parent sample: main-sequence stars within 100 pc (GCNS) | 273,856 (A 1,678; FGK 60,518; M 211,660) | exact count | Classes defined by absolute G magnitude only, not spectroscopy |
| Searchable stars (clean AllWISE W3 or W4 photometry) | 149,005 (54.4%) | exact count | W3 145,963; W4 148,736; 46% of stars are not searchable |
| Stars with >= 5 sigma W3 or W4 excess | 307 (A 61, FGK 67, M 179) | 2 mirror-side negatives (1 W3 + 1 W4) | 177 W3 and 179 W4 excesses |
| Unexplained excess stars after vetting | 37 (A 6, FGK 3, M 28) | 43 without the six manual classifications; about 10-17 of the 28 M dwarfs expected to be unrecognised background sources | Was 38 in the first pass; SCR J0615-7615 reclassified as background |
| Excess stars with independent youth evidence / published excess catalogue entry only | 65 / 62 | exact counts | Catalogue-only entries are identifications, not explanations; a strict limit counts them as unexplained |
| Excess stars classed as background (catalogued 34, image offset 99, manual 6) | 139 | centroid test efficiency 79 +/- 7% on catalogued background, false-flag rate 4.7% (6/127) | Mostly M dwarfs (129) |
| Chance alignments expected among searchable stars | about 120-140 (analytic 140; direct count 122 within 6 arcsec) | statistical +/- 9 to 11; 78 if only sources within 4 arcsec merge, 43 within 3 arcsec | Neighbour census supports a blending radius of at least 6 arcsec |
| 95% upper limit, pooled, 300 K, f = 0.01, every excess counted | 7.0e-4 | 3.9e-4 to 1.0e-3 over 100-600 K and tolerance 0.2-0.5 | k = 58, N_rec = 103,337; label-free headline |
| 95% upper limit, pooled, 300 K, f = 0.1, every excess counted | 8.2e-5 | 8.2e-5 to 4.8e-4 over 100-600 K and tolerance 0.2-0.5; 2.3e-4 at 300 K with tolerance 0.5 | k = 6, N_rec = 144,816; bottom of its range |
| 95% upper limit, pooled, 300 K, f = 0.05, every excess / identifications accepted | 3.5e-4 / 1.2e-4 | 2.7e-4 to 7.2e-4 / 6.6e-5 to 1.6e-4 | Shows the step between f = 0.05 and 0.1 |
| 95% upper limit, pooled, 300 K, f = 0.01, identifications accepted (strict) | 1.4e-4 (1.5e-4) | 6.7e-5 to 2.0e-4 (6.7e-5 to 2.2e-4) | k = 7 (8); includes vetting pass fraction 0.94 |
| 95% upper limit, pooled, 300 K, f = 0.1, identifications accepted (strict) | 2.2e-5 (3.5e-5) | 2.2e-5 to 1.5e-4 (3.5e-5 to 1.7e-4) | k = 0 (1); conditional on the labels |
| 95% upper limit, FGK, 300 K, every excess: f = 0.01 / f >= 0.05 | 1.9e-4 / 9.1e-5 | 1.4e-4 to 4.4e-4 / 9.1e-5 to 1.4e-4 | Sensitivity-limited above f = 0.01-0.02 (N_rec about 32,947) |
| 95% upper limit, M, 300 K, every excess: f = 0.01 / f = 0.1 | 1.0e-3 / 1.1e-4 | 6.8e-4 to 1.5e-3 / 1.1e-4 to 6.3e-4 | Applies to M0-M4.5; identifications accepted: 2.0e-4 / 2.9e-5 |
| M-dwarf completeness at f = 0.01, 300 K by sub-range (M0-M1.5, M2-M3.5, M4-M4.5, M5-M6, M6.5-M9) | 0.53, 0.50, 0.24, 0.062, 0.011 | binomial errors below 0.01 | M5 and later (51,935 stars, 24.5% of M dwarfs) essentially unconstrained at 1% |
| Median minimum detectable f at 300 K among searchable stars | A 4e-5; FGK 6e-4; M 8e-3 | about 10% from F_bol | M dwarfs have no sensitivity below f about 0.002 |
| Vetting pass fraction applied to label-dependent limits | 0.94 | +/- 0.02 | Probability that an on-star source survives the background vetting |
| Maximum settled systems within 100 pc, 1% swarm at 300 K, every excess (sum of classes / pooled) | 230 / 191 | A 5.8; FGK 11.6 (8.5-27); M 213 (143-321) | Identifications accepted: 55 / 37 |
| Maximum settled systems within 100 pc, 10% swarm at 300 K, every excess (sum of classes / pooled) | 34 / 22 | FGK 5.5 (5.5-8.5); M 23 (23-133) | Identifications accepted: 18 / 6.0; a class with zero candidates and 50% completeness cannot give fewer than about 6 |
| Incidence of W3 excess >= 25% of photosphere among FGK stars | 1.7e-4 (5/29,769) | 68% interval 1.0e-4 to 2.8e-4 | Consistent with about 1e-4 for the dustiest old Sun-like stars (Kennedy & Wyatt 2013) |
| Recall of known debris-disc hosts at 5 sigma | Patel 2014: 48/140; Cotten & Song Prime: 56/177 | 59% of Patel hosts above 3 sigma | Searchable sample only |
| Sgro & Song 2021 objects (SIMBAD list of 76) recovered as excess stars here | 28 of 42 searchable | exact counts | 12 young, 2 catalogue-only, 8 unexplained, 5 background, 1 co-moving companion |
Changes made after the referee report
- The report and result now lead with the every-excess (label-free) limits; the unexplained-only limits are presented as conditional on the identifications.
- Split 'young or known disc' into 65 stars with independent youth evidence and 62 with a published excess-catalogue entry only, and added a strict limit that counts the catalogue-only stars as unexplained (code/08_classify.py, code/09_limits.py).
- Added f = 0.03 and 0.07 to the grid and a second model tolerance (0.5); every limit is quoted with its range over 100-600 K and tolerance 0.2-0.5 (data/limit_ranges.csv); the f = 0.02 and 0.05 values are stated and the step below f = 0.1 is in the first paragraph.
- Added per-class and M sub-range strata (M0-M1.5, M2-M3.5, M4-M4.5, M5-M6, M6.5-M9); system counts are given per class with their sum and the pooled figure is labelled as assuming a class-independent rate (data/settled_fraction.csv, data/completeness_by_subtype.csv); the 1% M limit is stated to apply to M0-M4.5.
- Added a direct-count chance-alignment estimator for caps of 3, 4 and 6 arcsec (122 within 6 arcsec, matching the referee's 124) and a neighbour census of deblending (data/control_direct_count.csv, data/neighbour_census.csv); the text now quotes about 120-140 with the 4 arcsec value.
- Recomputed the vetting pass fraction as 0.94 +/- 0.02 (a flag in either band rejects; the 6/127 false-flag rate on young or catalogued stars is used) and applied it in limits.csv and robustness.csv.
- Youth indicator now requires clean Gaia photometry (4 of 24 over-luminous instead of 7 of 29); blended and flagged objects are named.
- data/unexplained.csv gained W1-W2, J-Ks, GCNS probability, Gaia blending flags, Gaia neighbour within 4 arcsec, a Sgro & Song 2021 flag and a secondary_indicators column.
- SCR J0615-7615 (Gaia DR3 5260623420435383168) inspected and reclassified as background (sixth manual classification): unexplained 38 -> 37, M 29 -> 28.
- Literature updated and verified through the arXiv API, Crossref and SIMBAD: Zackrisson et al. 2026, Korn et al. 2026, Ren, Garrett & Zackrisson 2026, Ren et al. 2025, Sgro & Song 2021, Curtis et al. 2026, Garrett 2026; added a quantitative comparison with Sgro & Song 2021; the centroid test is no longer claimed as a new method.
- Suazo et al. 2022 comparison caveated as not like for like and '300 times' removed (about 80 times lower at covering fraction 0.1, 28 times with tolerance 0.5, 4 times at 0.5, no better at 0.9).
- New robustness variants: catalogue-only identifications counted as unexplained; parent sample with GCNS probability > 0.5.
- Figures 2-5 redrawn (M sub-range panels, three limit versions with shaded ranges, new accounting categories, chance-alignment range bar, SCR J0615-7615 cutout).
- Wording fixes: 'volume-limited' instead of 'volume-complete'; 'three lines of evidence, not independent'; classes stated to be defined by absolute G magnitude.
- Full pipeline rerun end to end with the final code (run_all.py --from 2, all steps OK); report, figures and data tables are consistent with it; a 'Response to referee' section was added.
Referee points not accepted
- Optional cut requiring GCNS probability > 0.5 was not adopted as the baseline, because it would change a sample cut after looking at the positive tail; it is provided as a robustness variant (305 excess stars, no limit changes).
- The characterisation of the study as only 'a measurement of excess incidence with a Dyson label' is partly rejected: it is true for the FGK every-excess limit (now stated in the report), but the completeness function C(f, T), the M-dwarf limits and the per-class confusion boundary are not available from disc surveys.
- The referee's suggested f = 0.1 ranges (2e-5 to 9e-5 accepted; 8e-5 to 3e-4 every excess) were replaced by wider computed ranges (2.2e-5 to 1.5e-4; 8.2e-5 to 4.8e-4) because temperature and tolerance are varied jointly.
- The referee suggested only flagging SCR J0615-7615; after inspecting the Legacy DR10 image at the star's 2010 position I reclassified it as background instead; the other flagged stars remain counted as unexplained.
- The vetting pass fraction was computed from the data as 0.94 +/- 0.02 rather than set to the suggested value of about 0.95.
Figures
Code
Every number above is produced by these scripts from public data. The data tables themselves are not hosted here; the scripts download them.
01_download.py 02_build_sample.py 03_excess.py 04_injection.py 05_control.py 06_vet_queries.py 07_images.py 08_classify.py 09_limits.py 10_robustness.py 11_figures.py common.py dustmap.py photosphere.py run_all.py swarm.py
Referee report
A second, separate analysis re-ran the code, recomputed the main numbers by its own route and tried to break the result. Like the first, it was run by Claude for this project; it is not an outside expert. In its report “the analyst” is the first analysis, which wrote the paper, and file names that are not linked on this page are its own working files. The paper above is the version revised in response.
Verdict: sound with fixes. Results reproduced: yes.
- Full rerun. I copied the code and ran run_all.py from step 2 on the cached raw downloads (about 12 minutes). Every derived table came out byte-identical to the analyst's: limits.csv, completeness.csv, candidates.csv, accounting.csv, control_expectation.csv, robustness.csv, unexplained.csv and the rest. The detection list is the same 307 stars.
Independent pipeline (indep.py). This used my own GCNS cuts and AllWISE matching, a single-predictor Ks-anchored photosphere, stricter neighbour cuts, F_bol from G plus BC_G(G-RP) instead of Ks, my own band integration, and analytic injection.
| Quantity | Referee route | Analyst |
|---|---|---|
| Parent sample | 273,856 (A 1,678; FGK 60,518; M 211,660) | identical |
| AllWISE matches | 260,663 | identical |
| Excess stars at 5 sigma | 310 | 307 (279 in common) |
| C(f=0.01, 300 K), FGK / M | 0.50 / 0.33 | 0.54 / 0.33 |
| C(f=0.1, 300 K), FGK / M | 0.50 / 0.49 | 0.54 / 0.52 |
| C(f=1e-3, 300 K), FGK / M | 0.37 / 0.008 | 0.44 / 0.006 |
| Swarm response at 300 K, W3 / W4 (Jy per W m^-2) | 2.459e12 / 3.204e12 | identical |
- Of the 28 analyst detections I miss, 19 fall outside my stricter cuts and 9 sit at 4.6-4.99 sigma in my route.
- My route has a large negative W3 tail (1,317 stars). 99.9% of it is stars with contaminated RP colours (dM < -1), which is exactly what the analyst's two-predictor, two-anchor design suppresses.
- My lower completeness values follow from my stricter neighbour cuts (138,211 searchable against 149,005).
- A hand calculation of the 300 K response at 12 micron agrees with the code.
Compatible counts and limits. Recomputed with a simplified model-excess formula, k matches exactly: 58 / 8 at f = 0.01 and 6 / 0 at f = 0.1 (every excess / unexplained). The Clopper-Pearson arithmetic gives 6.98e-4, 1.43e-4, 8.18e-5 and 2.12e-5, as reported.
Chance alignments, by a different estimator. I counted control sources directly at their actual offsets instead of using the analytic trigger area. Result: 110 in W3, 43 in W4, 124 in either band for r <= 6 arcsec. The analyst's 6-arcsec variant gives 105.8, 43.3 and 122.8. I also tested the assumed blending radius empirically: galaxy-coloured W3-bright AllWISE sources are catalogued within 8 arcsec of M-dwarf targets at only 0-15% of the control-field density. They really are merged into the star, so the 6-arcsec cap is not too generous. The count is cap-dependent, though: 42 for r <= 3 arcsec and 74 for r <= 4 arcsec in W3.
End-to-end check on real objects. TW Hya, beta Pic, HD 172555, 49 Cet, HD 181327, HD 191089, HD 69830, HD 107146 and HD 3003 are all recovered as excess stars. HD 15407, HR 4796, eta Crv and HD 61005 are correctly listed as not searchable (dust or artefact flags).
Other checks.
- The SFD lookup (a custom HEALPix routine) matches the IRSA dust service at 3 of 3 positions that responded: 0.0120 / 0.0119, 0.1025 / 0.1013, 0.0262 / 0.0262.
- Suazo et al. 2022 Table values (265,724 sources; 6.6e-3, 1.9e-4, 1.8e-5) confirmed in the paper text.
- Suazo et al. 2024 candidates (143-275 pc, covering fraction 0.03-0.16, 100-275 K) confirmed.
- Contardo & Hogg (4,898,812 stars, 53 objects, 1.1e-5) confirmed.
- Kennedy & Wyatt 2013 (1 in 10,000 for the dustiest old systems) confirmed.
- Carrigan 2009, Patel et al. 2014 and Cotten & Song 2016 abstracts are consistent with how they are used.
Strongest objection
WISE photometry cannot tell a 0.2-8% warm swarm from a debris or transition disc, or from a dusty galaxy within about 1 arcsec of the star. The 'unexplained-only' limits, which lead the headline, are therefore only as good as the labels used to explain excesses away:
- 62 of the 127 'young or known disc' stars carry nothing but an infrared-excess catalogue entry, which a swarm host would also have.
- 99 M-dwarf excesses are removed by a statistical centroid test.
- The f = 0.1 number has zero candidates only because the brightest unexplained M dwarfs sit at blackbody-equivalent f of 0.03-0.08, just under the 20% tolerance.
An expert would say the study has measured the incidence of mid-infrared excess (already known for FGK stars) and the galaxy-confusion rate for M dwarfs, and attached a Dyson label.
The conclusion survives, in its weaker form:
- The every-excess limits use no labels at all and reproduce exactly: 7.0e-4 at f = 0.01 and 8.2e-5 at f = 0.1 (300 K).
- Reclassifying every catalogue-only identification as unexplained moves the unexplained-only limits by less than a factor of 2: 1.43e-4 to 1.56e-4 at f = 0.01, 2.1e-5 to 3.4e-5 at f = 0.1, 1.7e-4 to 3.3e-4 at f = 1e-3.
- The background interpretation for M dwarfs is supported by my independent control-field count (124 against the analyst's 123-140), by the neighbour census, and by the JWST result for Hephaistos candidates D and E.
What does not survive is the precision of the headline. The defensible statement is: for warm (100-600 K) swarms, fewer than about 1e-3 of stars at 1% covering and fewer than about 1e-4 to 3e-4 at 10%, tightening to about 1.5e-4 and 2e-5 to 9e-5 if the natural and background identifications are accepted. The 1% M-dwarf limit applies to M0-M4.5 only.
Errors found
- major. The headline 10% limit (2.1e-5
unexplained-only, k = 0) sits on a cliff. It depends on the 20%
tolerance and on the exact grid value f = 0.1.
- Evidence: At 300 K the unexplained count is 9 at f = 0.05 (limit 1.2e-4), 4 at f = 0.064 (6.6e-5) and 0 at f = 0.1. The unexplained M dwarfs have blackbody-equivalent f up to 0.084. With tolerance 0.5 the analyst's own robustness.csv gives k = 4 / 24, so the limits become 6.3e-5 (unexplained) and 2.3e-4 (every excess). At 600 K the baseline is already 8.7e-5 / 2.8e-4.
- Fix: Quote the f = 0.1 limit as a range: about 2e-5 to 9e-5 unexplained-only and 8e-5 to 3e-4 every-excess, across tolerance 0.2-0.5 and 100-600 K. State that for f = 0.02-0.05 the unexplained-only limit is 1.2e-4 to 1.4e-4. Change 'fewer than about 6 systems' to 'fewer than about 6 to 25'.
- major. The pooled 'all stars' limits and the system
counts (< 39, < 191, < 6, < 22) assume the same swarm rate
in every spectral class. The pooled count is 67% M dwarfs at f = 0.01,
against 77% in the population, and the result contradicts the per-class
limits.
- Evidence: The M-dwarf limit alone allows 2.13e-4 x 211,660 = 45 systems at f = 0.01 (unexplained), more than the pooled 39. For every excess, M alone allows 213 against the pooled 191. The M-dwarf completeness at f = 0.01, 300 K is 0.53 (M0-M2), 0.49 (M2-M4), 0.23 (M4-M5), 0.065 (M5-M6.5) and 0.015 (later), so the f = 0.01 M limit is in practice an M0-M4.5 limit.
- Fix: Report system counts per class: at f = 0.01, FGK < 6 (12 every-excess) and M < 45 (213). Label the pooled figure as valid only for a class-independent rate. Add the completeness-by-subtype table and say that M5 and later (24% of M dwarfs) are essentially unconstrained at f = 0.01.
- major. The literature comparison and the novelty
statement are out of date and miss directly relevant work.
- Evidence: The arXiv API (queried 2026-10-12) lists: Zackrisson et al., Project Hephaistos IV (arXiv:2607.09460), JWST/MIRI shows candidates D and E are background galaxies within about 1 arcsec; Korn et al., Project Hephaistos III (arXiv:2607.25701); Ren, Garrett & Zackrisson (arXiv:2607.03619), which compares Gaia positions propagated to the AllWISE epoch with AllWISE image centroids, the same test used here; Ren et al. 2025 (arXiv:2501.05152), candidate G is a radio AGN. Sgro & Song 2021 (MNRAS 508, 3084) searched Gaia DR2 M dwarfs within 100 pc for W3/W4 excess and is not cited.
- Fix: Cite these. Replace 'support the background-galaxy interpretation of Ren et al. (2024) and Blain (2024)' with the JWST confirmation. Use Hephaistos IV to support the stated blindness of the centroid test inside 1-2 arcsec. Drop the claim that the centroid test is new as a method; what is new is its null calibration on a volume-limited sample. Compare the M-dwarf excess census with Sgro & Song 2021.
- minor. The over-luminosity argument for youth among
the unexplained M dwarfs is partly wrong.
- Evidence: Two of the 'seven more than 1 mag above the main sequence' have dM = -8.7 and -4.9. Those are blended pairs with corrupted RP photometry (Gaia DR3 6886178038419703168: companion at 0.5 arcsec, IPDfmp 87, BP/RP excess 2.8; 5168535370237983488: IPDfmp 23, excess 2.9), not pre-main-sequence stars. The code's own comment says objects above the ridge are mostly contaminated pairs.
- Fix: Define the youth indicator from M_G against a clean colour, or exclude stars with high BP/RP excess or IPDfmp, and restate the count. Remove 6886178038419703168 from 'strongest on-star cases' or describe it as a 0.5-arcsec pair that SIMBAD types as an emission-line star.
- minor. The unexplained list still holds objects
that are identifiable from data already in hand. Near-infrared and W1-W2
colours were not used.
- Evidence: Gaia DR3 6202851314311763072 has GCNS probability 0.38, J-Ks = 3.2 and W1-W2 = 1.6, so it is not a normal M dwarf (spurious astrometry or an AGN-like object). SCR J0615-7615 has an obvious galaxy 2-3 arcsec west in Legacy DR10, on its 2010 proper-motion track. 2MASS J04242429-6904152 is a SIMBAD post-AGB candidate with a Gaia neighbour at 2.6 arcsec. Eight of the 29 have a Gaia source within 0.7-3.3 arcsec. The four strongest have W1-W2 = 0.36-0.48, against a 95th percentile of 0.25 for non-excess M dwarfs, which means dust hotter than 300 K. This errs on the conservative side, since it inflates the unexplained count.
- Fix: Add W1-W2, J-Ks and GCNS probability columns to unexplained.csv and note these cases. Optionally require GCNS probability > 0.5 in the parent sample (402 stars affected).
- minor. The chance-alignment expectation '140 +/- 9'
carries only Poisson error, and the agreement with 138 identified
background sources is partly fortuitous.
- Evidence: The number depends on the assumed blending cap: 123 with W4 capped at 6 arcsec; my direct count gives 124 at r <= 6 arcsec, 74 at <= 4 arcsec and 42 at <= 3 arcsec in W3. For FGK stars the model predicts 22 +/- 4 but only 14 non-young excesses exist.
- Fix: Quote 'about 120-140, with roughly +/- 20% systematic from the blending radius' and drop the implied precise match. The neighbour census (0-15% of control density inside 8 arcsec) can be cited in support of the cap.
- minor. The comparison with Suazo et al. 2022 is not
like-for-like.
- Evidence: Their numbers are the fraction of sources whose colours are compatible with a Dyson-sphere model. They are not 95% limits and involve no vetting. The '300 times' figure sets a vetted limit against an unvetted fraction.
- Fix: Keep '80 times lower' (every-excess 95% limit against their compatible fraction, with the difference in definition stated) and drop or caveat '300 times'.
- minor. The vetting-pass correction (0.975) is
slightly optimistic.
- Evidence: The code takes the maximum of the per-band null rates, although a flag in either band rejects the star. The offset test flags 6 of 127 (4.7%) young or known-disc stars. Each 99th-percentile threshold comes from about 530 null stars.
- Fix: Use about 0.95 with an uncertainty. The limits change by 3% or less. Also divide the unexplained columns of robustness.csv by the same factor so they match limits.csv (1.40e-4 against 1.43e-4).
- minor. 'Three independent lines of evidence' for
background contamination of M dwarfs are not independent, and the
catalogue-only 'known disc' label is circular for swarms.
- Evidence: The centroid-test efficiency (27/34) is calibrated on the catalogued-background set. 62 of the 127 'young or known disc' stars rest only on an entry in an infrared-excess catalogue, which a swarm would also earn.
- Fix: Reword to 'three lines of evidence'. Add the variant I computed in which catalogue-only identifications count as unexplained: at 300 K, 1.56e-4 (f = 0.01), 3.4e-5 (f = 0.1), 3.3e-4 (f = 1e-3).
- minor. Class labels are by absolute magnitude only.
- Evidence: 'A' contains B9.5V to F0V stars and a giant (c Leo, A5III). 'FGK' contains over-luminous pre-main-sequence K/M stars such as TW Hya, AU Mic and TWA 7.
- Fix: State this beside the per-class tables.
Overclaims
- '2.1e-5 ... for 10%' and 'fewer than about 6 systems' as a headline. The value holds only at exactly f = 0.1, 300 K and tolerance 0.2; it is 1.2e-4 at f = 0.05 and 6e-5 to 9e-5 at tolerance 0.5 or at 600 K.
- 'fewer than about 39 or 191 systems of 273,856'. The pooled extrapolation is below what the M-dwarf limit alone allows (45 and 213).
- '138 are background sources (140 +/- 9 chance alignments were expected)'. The quoted precision ignores a roughly 20% systematic from the blending radius, and 99 of the 138 are statistical centroid classifications.
- '80-300 times tighter than Suazo et al. (2022)'. The 300 compares a vetted 95% limit with an unvetted compatible-source fraction.
- 'Three independent lines of evidence'. The centroid efficiency is calibrated on the catalogued-background set.
- 'Seven lie more than 1 mag above the main sequence ... so some are probably unrecognised young stars'. At least two are photometric artefacts of blended pairs.
- '127 are known young stars or catalogued discs' offered as explanations. 62 are only entries in infrared-excess catalogues, a label a swarm would also carry.
- Novelty item 3, the null-calibrated centroid test as a new contribution. The Gaia-to-AllWISE centroid diagnostic was already applied to the Hephaistos candidates (Suazo et al. 2024; Ren et al. 2026).
- 'volume-complete 100 pc sample'. Only 54% of stars are searchable, and M5 and later are essentially unconstrained at f = 0.01. This is stated in the limitations but not in the headline.
Novelty check
Novel: partly. I found no earlier stellar Dyson-swarm search that publishes an injection-recovery completeness function, or limits at covering fractions of 1e-3 to 1e-2 for the 100 pc sample. Those two elements appear to be new, as does the per-class statement of where the limit is confusion-limited. Three parts are not new. (a) At covering fraction 0.5 and above the result reproduces Suazo et al. 2022 (2.3e-5 against 1.8e-5 at 0.9). (b) Comparing Gaia positions propagated to the AllWISE epoch with AllWISE image centroids has been done for the Hephaistos candidates (Suazo et al. 2024; Ren et al. 2026); the new part here is the null calibration and the volume-limited application. (c) The conclusion that M-dwarf mid-infrared excesses of this kind are mostly background galaxies is established by JWST for two candidates (Hephaistos IV) and argued by Ren et al. and Blain. For FGK stars the every-excess limit is in effect a re-measurement of the bright end of the warm-excess luminosity function (Kennedy & Wyatt 2013), re-expressed in covering fraction. Injection-recovery has also been used for galaxy-scale waste-heat searches (Curtis et al. 2026), though not for stars. The analyst's 'medium' confidence is fair once the literature is updated.
- Suazo et al. 2022, Project Hephaistos I, MNRAS 512, 2988 (arXiv:2201.11123): closest prior limit; 100 pc values verified in the paper text
- Suazo et al. 2024, Project Hephaistos II (arXiv:2405.02927): seven M-dwarf candidates, includes a positional-offset analysis, no completeness function
- Zackrisson et al. 2026, Project Hephaistos IV (arXiv:2607.09460): JWST/MIRI shows candidates D and E are background galaxies within about 1 arcsec (not cited by the analyst)
- Korn, Suazo & Zackrisson 2026, Project Hephaistos III (arXiv:2607.25701): characterisation of the candidates (not cited)
- Ren, Garrett & Zackrisson 2026 (arXiv:2607.03619): Gaia-to-AllWISE-epoch centroid diagnostics for nine candidates (not cited)
- Ren et al. 2024 (arXiv:2405.14921) and Ren et al. 2025 (arXiv:2501.05152): radio AGN and dust-obscured galaxy contamination
- Blain 2024 (arXiv:2409.11447): confusion with dusty background galaxies
- Contardo & Hogg 2024 (arXiv:2403.18941): 53 W1/W2-excess objects among 4,898,812 FGK stars
- Sgro & Song 2021, MNRAS 508, 3084: W3/W4 excess search among Gaia DR2 M dwarfs within 100 pc (not cited; I could not retrieve the abstract, so the description is second-hand)
- Kennedy & Wyatt 2013 (arXiv:1305.6607): 12 micron excess luminosity function; about 1e-4 for the dustiest old Sun-like stars
- Patel et al. 2014 (arXiv:1403.3435); Cotten & Song 2016 (arXiv:1606.01134); Carrigan 2009 (arXiv:0811.2376)
- Curtis, Rowland & Wright 2026 (arXiv:2608.12458): injection-recovery for galaxy-scale Dyson waste heat
- Garrett 2026 (arXiv:2608.31153): waste heat colder than 100 K, relevant to the stated temperature limitation
Required changes
- Headline and Section 8: lead with the every-excess limits (7.0e-4 at f = 0.01; 8.2e-5 at f = 0.1, 300 K) as the label-free result. Present the unexplained-only values as conditional on the identifications.
- Change 'none needs an artificial explanation: 127 are known young stars or catalogued discs' to wording that does not treat a catalogue entry as an explanation, for example 'none requires one; 65 have independent youth evidence, 62 are previously catalogued excess stars'.
- f = 0.1 limit: quote a range (about 2e-5 to 9e-5 unexplained; 8e-5 to 3e-4 every-excess) covering tolerance 0.2-0.5 and 100-600 K. State that at f = 0.02-0.05 the unexplained-only limit is 1.2e-4 to 1.4e-4 (k = 9-10). Change 'fewer than about 6 (22) systems' to match.
- System counts: replace the pooled '< 39 / < 191 of 273,856' with per-class counts (f = 0.01: FGK < 6 / 12; M < 45 / 213), or label the pooled values as assuming a class-independent rate.
- Add the M-dwarf completeness by subtype at f = 0.01, 300 K (0.53, 0.49, 0.23, 0.065, 0.015 for M0-M2, M2-M4, M4-M5, M5-M6.5, later). Say in the headline and in Section 8 that the 1% M-dwarf limit applies to M0-M4.5.
- Section 4, comparison with earlier work, and Section 7: cite Project Hephaistos III and IV (arXiv:2607.25701, 2607.09460), Ren et al. 2026 (arXiv:2607.03619), Ren et al. 2025 (arXiv:2501.05152) and Sgro & Song 2021. Remove the claim that the centroid test is new as a method. Note that JWST confirms the galaxy explanation for two Hephaistos candidates and that contaminants inside about 1 arcsec are invisible to the centroid test.
- Section 4, 'The unexplained stars': correct the youth argument, since at least two of the seven over-luminous M dwarfs are blended pairs with corrupted RP colours. Flag Gaia DR3 6202851314311763072 (GCNS probability 0.38, J-Ks = 3.2, W1-W2 = 1.6), SCR J0615-7615 (adjacent galaxy in Legacy DR10) and 6886178038419703168 (0.5-arcsec pair, SIMBAD emission-line star). Add W1-W2 and J-Ks columns to unexplained.csv.
- Chance alignments: replace '140 +/- 9' with 'about 120-140 (statistical +/- 9; roughly +/- 20% systematic from the blending radius)' in the headline, key numbers and accounting table. Note the FGK over-prediction (22 +/- 4 expected, 14 observed).
- Suazo et al. 2022 comparison: state that their numbers are compatible-source fractions, not vetted 95% limits. Keep '80 times lower' with that caveat and remove or caveat '300 times'.
- Add the 'catalogue-only identifications counted as unexplained' variant to the robustness table (1.56e-4 at f = 0.01; 3.4e-5 at f = 0.1; 3.3e-4 at f = 1e-3).