Where is everybody? · Working papers
Does spreading keep going? Real colonisation waves
Revised after a second, separate analysis run for this project tried to break it. Neither analysis is an outside expert.
Does expansion sustain itself? Evidence from real colonisation waves (revised after review)
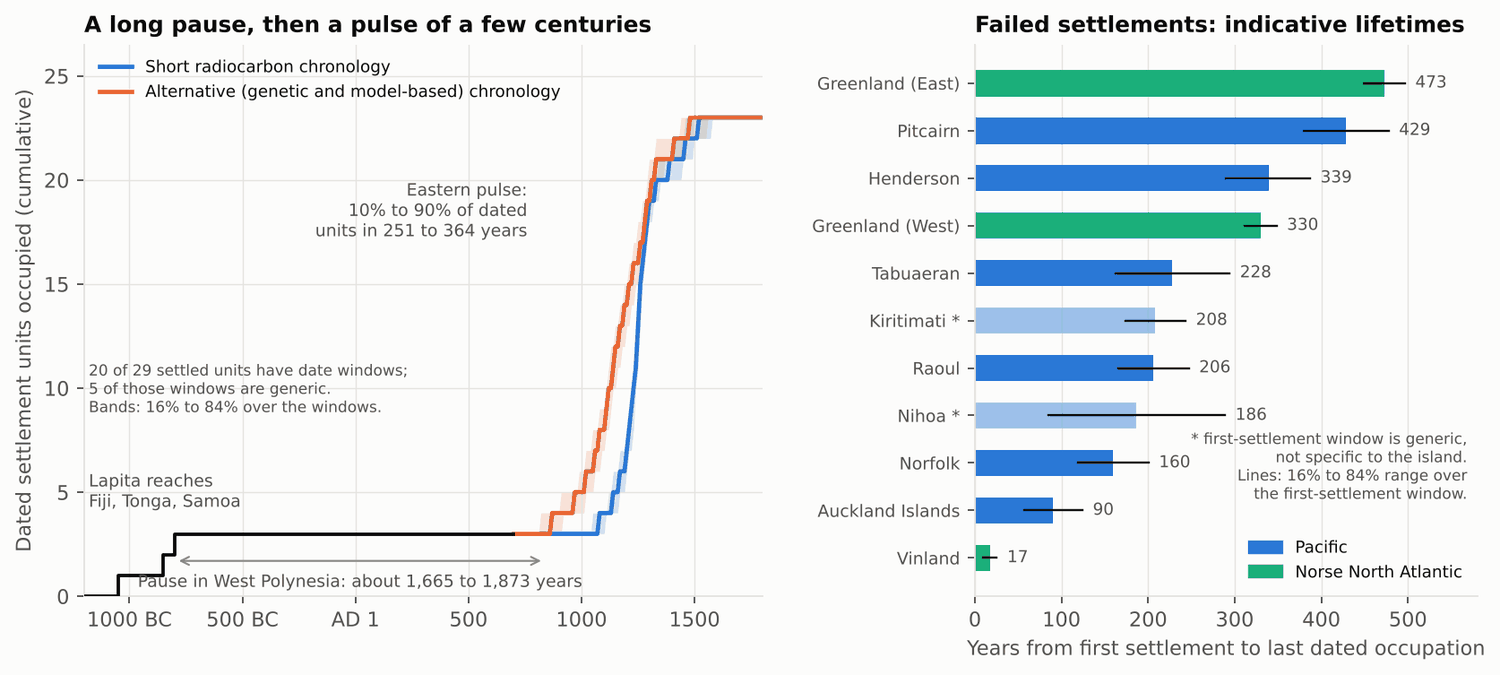
Real colonisation waves show that expansion, where it was feasible, ran fast and reached most usable targets, but they cannot say whether expansion sustains itself over the thousands of generations needed to fill a galaxy. In East Polynesia, after a pause of 1,665 to 1,873 years in the western homeland, settlers reached 29 of the 50 land units in range (a unit is an island or archipelago treated as one target) in a pulse lasting 251 years (95% range 159 to 359) on the short radiocarbon chronology or 364 years (259 to 524) on the alternative one. The share of targets settled runs from 58% of all land to 95% (19 of 20; 95% interval 79% to 99.5%) of islands that have supported a community since European contact, depending on the definition. Sixteen of the 29 settled units (55%; 37% to 72%) were abandoned before contact, and the abandoned islands were both small and far from any settled neighbour. Each unit had 13 to 31 others within voyaging range, which puts the threshold below which a wave stalls at a coloniser share of 0.14 to 0.34, but the Pacific does not pin down the coloniser share itself. The main caveats: every wave studied ended after four to six relaunch generations in a domain of at most about 50 targets; three of the 16 abandoned settlements are doubtful; the tables are hand-entered and mostly checked only against Wikipedia; and three first-pass headline claims are withdrawn (97% of habitable islands filled, isolation having no effect, and a recommended prior with median 0.03).
What changed since the first pass
| Claim | First pass | Revised |
|---|---|---|
| Share of targets settled | 97% (86% to 99.6%) of habitable islands | 58% to 95% depending on definition; the 97% counted settlement itself as proof of habitability |
| Isolation and abandonment | No measurable effect | Strong effect once islands, not archipelagos, are the unit |
| Coloniser share (Landis's p) | 0.72, and at least 0.35 | Not identified; bounded below at 0.15 to 0.45 depending on assumed range |
| Landis's strict rule | Rejected | Not rejected once habitability is uncertain |
| "Reproduction number" of 1.5 | Daughters per settlement per generation | Growth factor of the count of dated units: 1.2 to 1.5 per 30 years |
| Prior for sustained expansion | Median 0.03 (0.002 to 0.3) recommended | No prior recommended; the project model is left unchanged |
Question
Do real expansion waves keep going, and what do their hop lengths, growth rates and failure rates say about the probability that a technological civilisation becomes a sustained expander?
Data
| Source | Rows used | Notes and cuts |
|---|---|---|
| Polynesian unit table (hand-entered) | 66 units, 123 anchor islands | 50 East Polynesian land units, 10 homeland units, 6 beyond the network. Checked against the source text: 26; against Wikipedia only: 38; from memory: 2 (Futuna, Oeno) |
| Polynesian island table (new) | 88 islands in the 29 settled units | Land area from Wikipedia infoboxes for 73. Contact status stated in the article for 31, standard knowledge for 57. Tuamotus: 15 of 76 atolls |
| Dates | 20 of 29 settled units | Wilmshurst et al. 2011 windows (short chronology); Ioannidis et al. 2021 genetic dates (alternative). Five windows are generic, not unit-specific |
| Norse North Atlantic | 6 frontier units | Hand-entered |
| Bird introductions | 832 events, 202 species (Moulton & Cropper 2019 data file); 27,723 records (GAVIA); 96 effect sizes (Cassey et al. 2018) | Downloaded by the code |
| Maritime census | 18 culture-periods listed, 15 counted, 11 lineages, 8 waves | Hand-entered; rule written after the list existed |
| p3k14c radiocarbon database | 173,946 dates | Null result: only 73 dates from Remote Oceania, all from Rapa Nui, so it cannot supply the chronology |
Selection cuts. Abandonment is measured over East Polynesia; the homeland is excluded because its settlement belongs to the earlier Lapita wave (including it gives 16 of 39). The main island sample drops 10 islands whose contact status is doubtful (78 remain). Settlement lifetimes use only the 6 abandoned units with a unit-specific first-settlement window.
Method
Great-circle distances between units give nearest-neighbour hops, documented source-to-daughter hops and the longest hop the network needs. Timing comes from 20,000 Monte Carlo draws over the date windows, run separately for the two chronologies. Abandonment is fitted by logistic regression at unit grain and, new in this revision, at island grain, with intervals from resampling whole units so that islands of one archipelago are not treated as independent. The percolation analysis simulates Landis's model (each settlement is a coloniser with probability p; colonisers settle every reachable neighbour) on the real island graph. The revised version uses all 50 land units, with the chance that an island is habitable fitted from its land area, instead of a node set chosen by outcome. The stall threshold is approximated by the two-dimensional continuum value, about 4.5 divided by the mean number of neighbours. The transfer to the project's model is now a set of sensitivity tests, not an estimate.
Results
Reach and timing.
| Quantity | Value | Uncertainty or range |
|---|---|---|
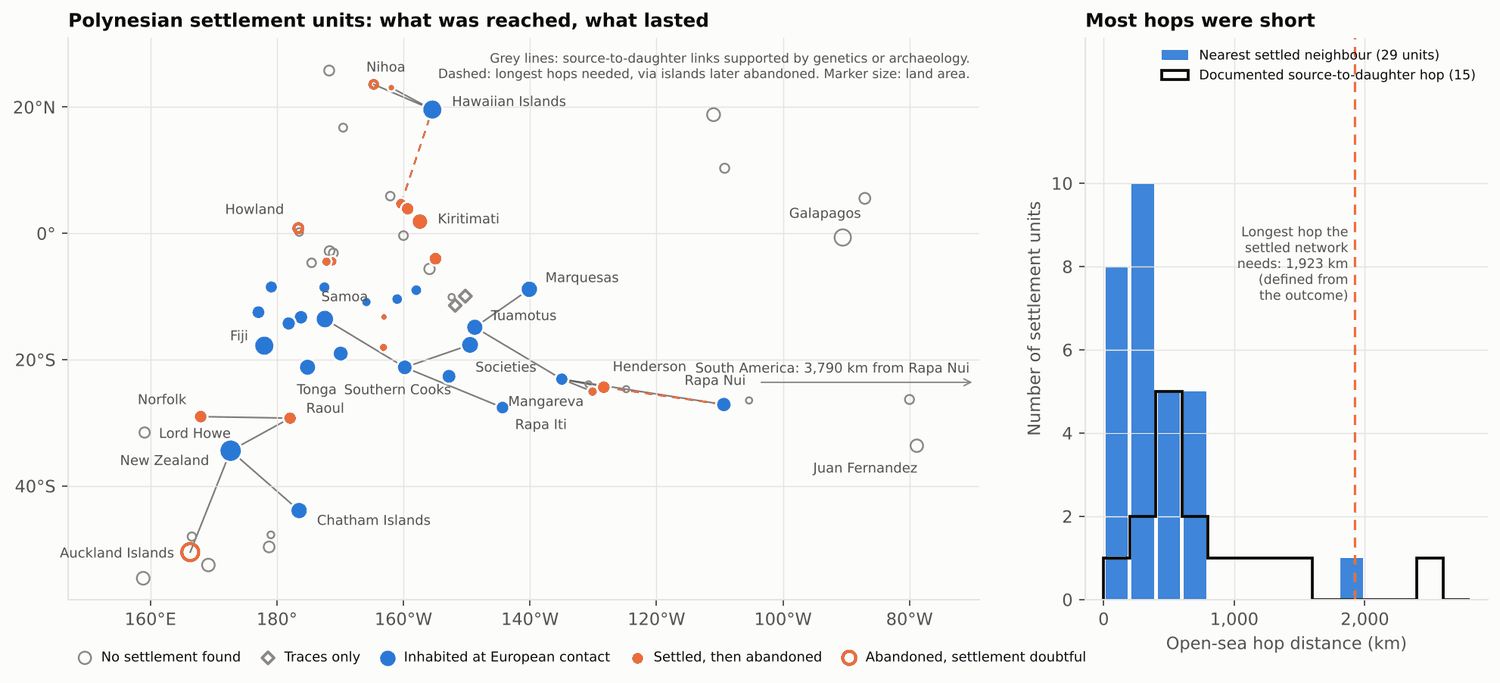
| Nearest settled-neighbour hop, median | 360 km | quartiles 196 to 533 km |
| Documented source-to-daughter hops (15), median | 517 km | quartiles 444 to 1,013 km; longest 2,559 km |
| Longest hop the settled network needs | 1,923 km | 3,192 km if later-abandoned stepping stones are not used; defined from the settled set |
| Doubling time of the count of dated units | 52 years (short), 91 years (alternative) | 37 to 68; 63 to 116 |
| Growth factor per 30 years | 1.49 (short), 1.26 (alternative) | 1.36 to 1.75; 1.20 to 1.39 |
| Same, unit-specific windows only (15 units) | 1.44, 1.23 | |
| Same, Wilmshurst's seven archipelago windows | 1.29, 1.22 | 1.21 to 1.46 (short) |
Under the short chronology the curve is a step (one archipelago, then a pulse), not an exponential, so the growth factor only restates how fast the count rose. The direct count of daughters is small: the four early units of the genetic chain founded 1 to 3 documented daughters each (mean 2.0), and only 7 of 29 units have any documented daughter (24%; 12% to 42%), a lower bound because the source of 14 units is unknown. There was no single hard distance limit: the network needs 1,923 to 3,192 km and contact with South America implies about 3,790 km, yet Juan Fernandez (3,003 km) and Galapagos (3,561 km) were not settled.
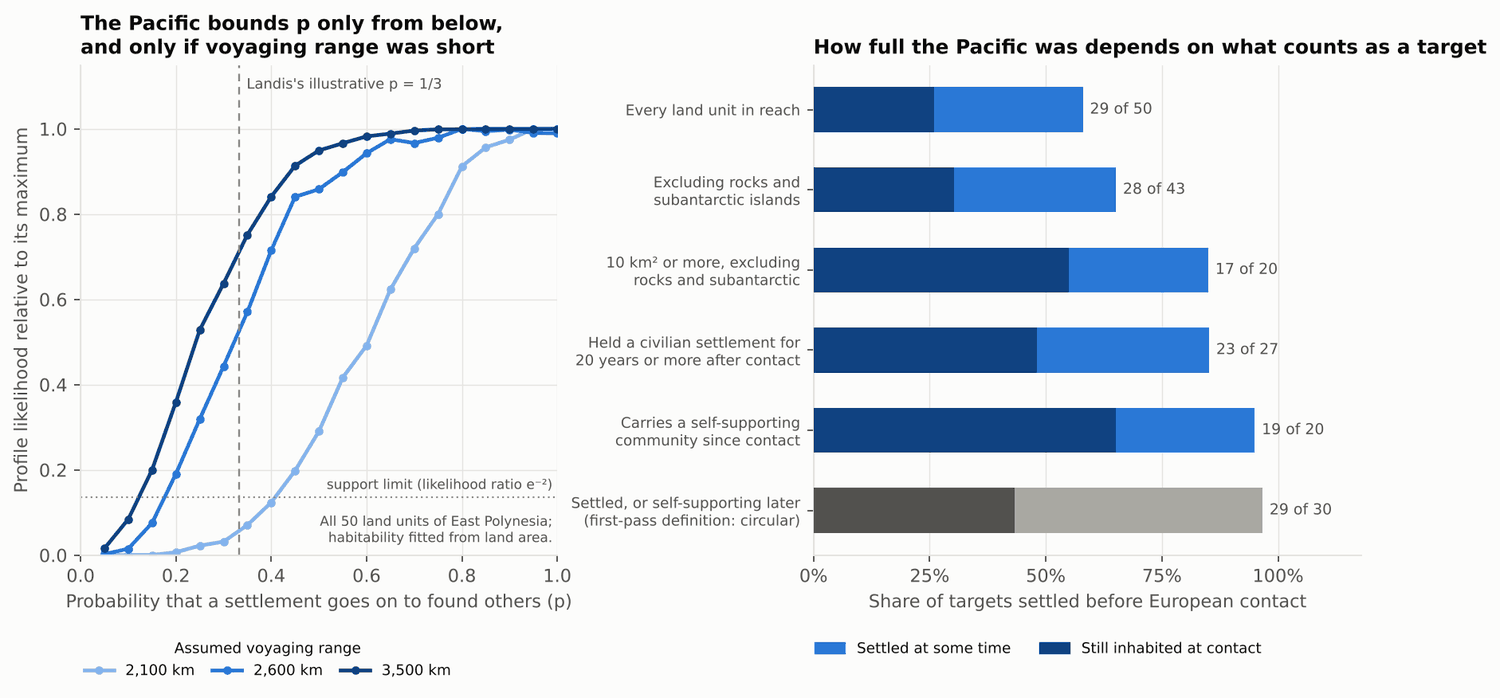
How full was the Pacific? The answer depends on the denominator. None of these definitions uses prehistoric settlement as evidence of habitability.
| Definition of a target | Settled / targets | Share |
|---|---|---|
| Every land unit in range | 29 / 50 | 58% |
| Excluding bare rocks and subantarctic islands | 28 / 43 | 65% |
| 10 km² or more, same exclusions | 17 / 20 | 85% |
| Held a civilian settlement for 20 years or more after contact | 23 / 27 | 85% |
| Has carried a self-supporting community since contact | 19 / 20 | 95% (79% to 99.5%) |
Only 13 of the 50 (26%) were inhabited at contact. Without the three doubtful settlements (Howland, Necker, Auckland Islands) the first row is 26 of 50. Settlement rose with size: 3 of 7 units under 1 km² against 11 of 13 at 100 km² or more.
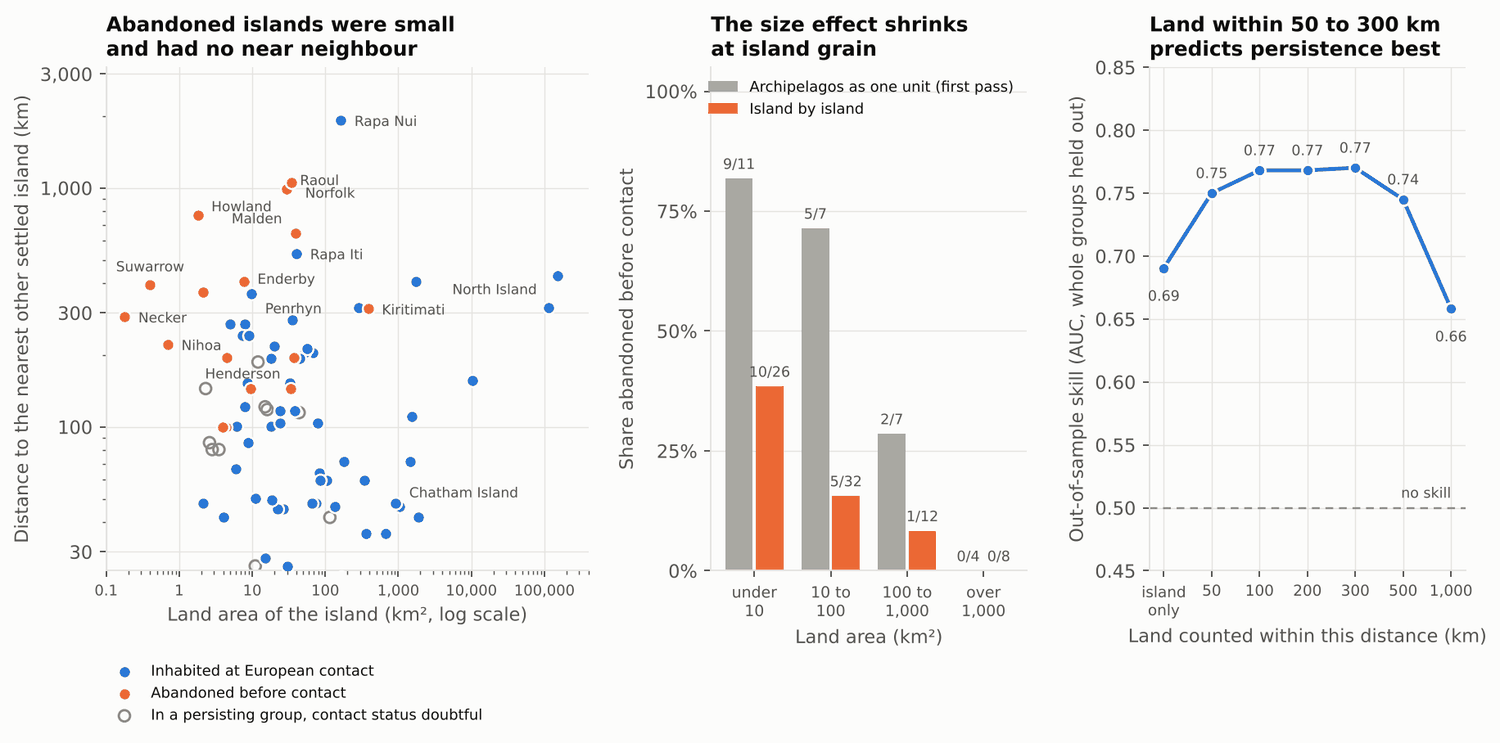
Abandonment. 16 of 29 settled units were abandoned (55%); alternative codings give 40% to 58%. The abandoned islands hold 0.2% of settled land (2.7% excluding New Zealand). At island grain, 15 of 58 islands under 100 km² were abandoned (26%), against 14 of 18 at unit grain. Abandoned small islands sat a median 289 km from the nearest settled island, persisting ones 100 km.
| Predictor, fitted together with island area | Log-odds per tenfold increase | 95% interval, whole units resampled |
|---|---|---|
| Distance to nearest settled island | +3.4 | +2.0 to +6.5 |
| Land within 300 km | −1.3 | −2.6 to −0.5 |
| Distance to nearest land of 100 km² or more (first-pass measure) | +1.3 | −0.8 to +3.8 |
Out-of-sample skill (AUC with whole units held out; 0.5 is chance) is 0.69 for island area alone, 0.75 to 0.77 for land within 50 to 300 km, and 0.66 for land within 1,000 km. Persistence therefore tracked neighbours on a scale roughly ten times shorter than the reach of the voyages. Failed settlements with usable dates lasted a median 90 to 429 years (6 units; indicative only).
Percolation. Each unit had 13 to 24 settled neighbours within an assumed range of 2,100 to 3,500 km (17 to 31 counting all land), which implies a stall threshold of about 0.14 to 0.34 for the coloniser share. The share itself is bounded only from below: values from 0.45, 0.20 and 0.15 upward are supported at ranges of 2,100, 2,600 and 3,500 km. Landis's illustrative one-third has a likelihood ratio of 0.07, 0.57 and 0.75 against the best fit, so it is disfavoured only if range was short. Simulated directly at a share of 0.35, the wave still reaches 84%, 93% and 99% of the 29 settled units on average.
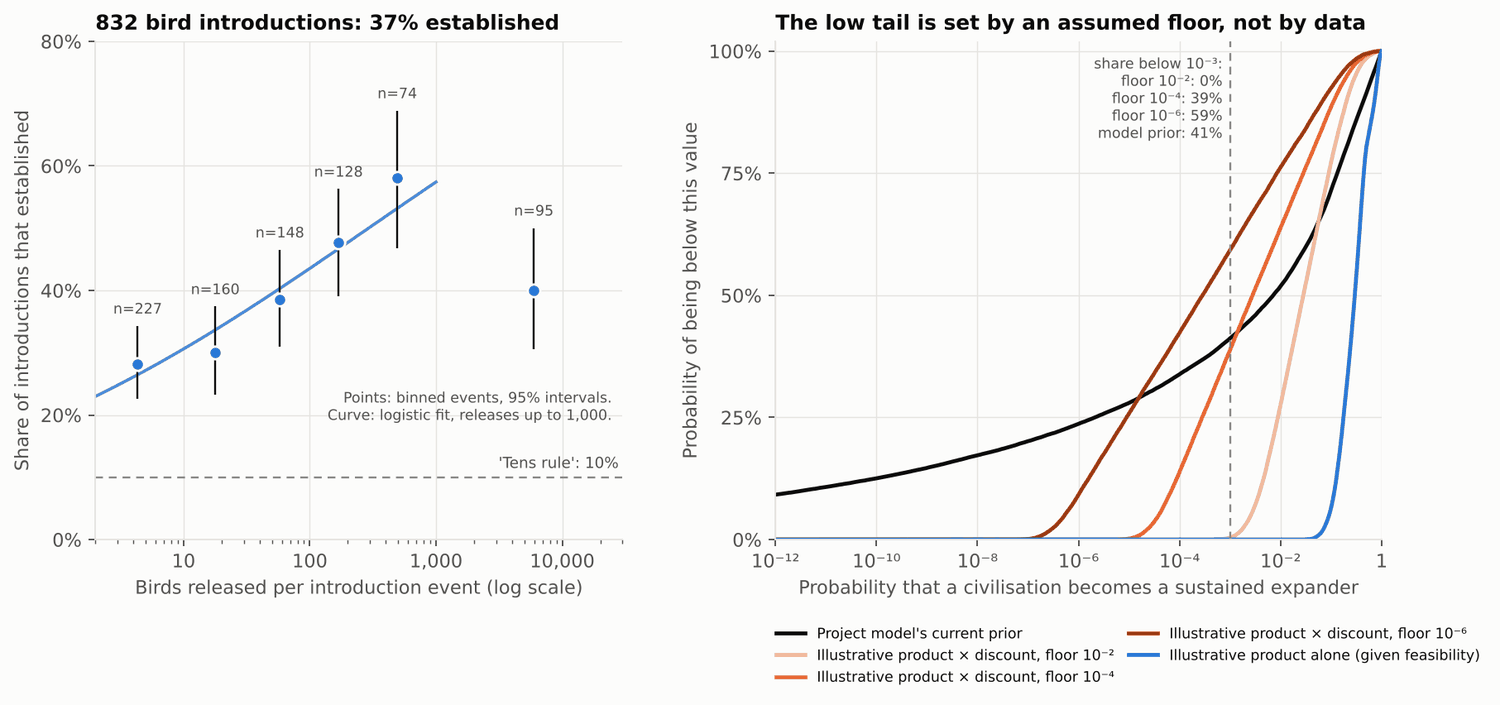
Other analogues. Three of 6 Norse frontier units were abandoned (17% to 83%). Of 832 bird introductions, 37% established (34% to 41%), rising with the number released (0.33 ± 0.07 in log-odds per tenfold); 16% of 419 established species are recorded as spreading further, a lower bound. In the maritime census 8 of 15 culture-periods (5 of 11 lineages) launched a settlement wave; adding 10 or 30 unlisted non-expanders lowers the lineage share to 24% or 12%. Six of 8 waves ended by exhausting their targets, one at a range limit (Lapita) and one in retreat (Norse).
What transfers to the model. Multiplying these short-run rates gives a median anywhere from 0.01 to 0.8, depending on the scenario. The low tail of any prior built from them is set by an assumed discount for interstellar feasibility, not by data:
| Assumed floor of the feasibility discount | Median probability | Share below 0.001 |
|---|---|---|
| 0.01 | 0.028 | under 1% |
| 0.0001 | 0.0028 | 39% |
| 0.000001 | 0.0003 | 59% |
| Project model's current prior | 0.007 | 41% |
As a sensitivity test only, the model's probability for "civilisations exist but do not spread" is 0.25 with its current prior and 0.04, 0.09 and 0.15 when the expansion probability is log-uniform from 0.01, 0.0001 and 0.000001 up to 1. The analogues cover 10 to 40 wave-generations, enough to exclude a per-generation chance of stopping only above 0.26 to 0.07; surviving 10,000 generations needs it below about 0.00007.
Robustness checks
- Network range is 1,923 km with or without the doubtful settlements, and with only the five core western sources.
- The nearest-neighbour effect holds if the three doubtful abandoned settlements are dropped (+3.2; 1.8 to 6.0) and if the 10 doubtful islands are counted as abandoned (+2.0; 0.6 to 3.9). In that last case the land-within-300-km effect is no longer distinguishable from zero (−1.4 to +0.1).
- The bird slope survives using one event per species (0.32; 0.13 to 0.57); 23 species supply half the events.
- All numbers reproduce from one command with fixed random seeds.
Limitations
- The Pacific and census tables are hand-entered. Contact status for 57 of 88 islands rests on standard knowledge, not a checked source.
- The island table is incomplete for the Tuamotus, which under-represents small persisting atolls with near neighbours.
- Dates for most abandoned islands are poor; lifetimes and relaunch delays are indicative.
- The later-habitability codes rest on post-contact history with modern supply lines.
- The stall threshold is an approximation; on a 50-node graph it is not sharp.
- The census has no pre-defined reference class and is not exhaustive.
- Every analogue is a closed domain of at most about 50 targets and a few generations.
Closest prior work and what is new
Landis (1998) proposed the percolation model; Cartin (2014, JBIS 67, 119) ran it on the real stars within 40 parsecs. Bell, Currie, Irwin and Bradbury (2015, American Antiquity 80, 397) fitted epidemic-type spread models to the settlement of 24 Polynesian island groups. The "mystery islands" of Pacific archaeology (canonical list in Leppard 2016, after Kirch 1988) are conventionally described as small and remote, so the direction of the abandonment result is not new. For birds, Moulton and Cropper (2019) concluded from the same file that release size does not consistently predict establishment; Blackburn et al. (2020, PeerJ 8, e8766) re-analysed it and found that it does, and the fit here agrees with the re-analysis. What may be new is narrow: a Landis-type likelihood on the real island graph with habitability fitted, showing the coloniser share is not identified; the profile of persistence against the radius over which neighbouring land is counted; and the explicit bound showing why the analogues cannot constrain long-run expansion.
Implications for the Fermi Paradox
- Where expansion was feasible, spreading was fast compared with waiting: a pause of about 1,700 to 1,900 years, then a pulse of about 250 to 500 years. If this carries over, the delay before expansion starts matters more than its speed.
- Real geography offers many neighbours (13 to 31 here, against 6 on Landis's cubic lattice), so a percolation stall needs a coloniser share below about 0.14 to 0.34. This study cannot say whether the share is above that.
- "Reached" is not "occupied": 29 of 50 land units were reached but only 13 were inhabited at contact, and small outposts without near neighbours were the ones that failed.
- The study gives no basis for changing the model's prior on sustained expansion, in either direction. That parameter remains the least constrained in the project.
Figures and code
figures/fig1_pacific_map_and_hops.png: map of units and hop lengths.figures/fig2_timeline_and_lifetimes.png: pause, pulse and lifetimes of failed settlements.figures/fig3_abandonment_vs_size.png: abandonment by island size and neighbours.figures/fig4_percolation_fit_and_reach.png: coloniser-share likelihood and share of targets settled.figures/fig5_invasion_base_rates_and_prior.png: bird establishment and the floor sensitivity.- Entry point:
code/run_all.py(about 5 minutes); all numbers indata/key_numbers.json. Raw downloads live inraw/and are re-fetched by the code if missing.
Response to referee
- Fill fraction. Dropped "97% (86% to 99.6%)"; replaced with the denominators table; the 1,923 km range is labelled as defined from the settled set.
- Isolation. Withdrew "no measurable effect"; added the island-level analysis; the unit-level fit is stated to apply to stand-alone islands and whole archipelagos only.
- Behavioural factor. Relabelled as illustrative and conditional; removed the recommended prior; added the floor table.
- Model rerun. Presented as a sensitivity test; deleted "no behavioural support below 0.001" and "must be justified by infeasibility"; no change to the model is recommended.
- Quantity mismatch. Stated in the first paragraph and quantified (generations, targets, stopping-chance bound); every wave ended.
- Percolation. Rebuilt on all 50 land units with fitted habitability; 0.72 withdrawn as prior-dominated; 7 of 29 documented colonisers noted as compatible with one-third; the neighbours-and-threshold result kept, citing Cartin. The first-pass rejection of Landis's strict rule is also withdrawn: with habitability uncertain it fits as well as any alternative (likelihood ratio 0.97 to 1.0).
- Census. Rule stated (written after the fact, so no interval); three rows removed as double-counted or ill-defined; lineage-level count added; the seven memory rows checked against Wikipedia; sensitivity to unlisted non-expanders added; Lapita coded consistently (7 of 8 waves kept going on a lenient reading, 6 of 8 on a cautious one).
- Growth. Renamed "growth factor"; generic windows and the mixed-chronology 70-year delay disclosed; daughters counted directly; the short chronology described as a step.
- Distance limit. Replaced with the attested ranges.
- Land lost and lifetimes. Corrected using Enderby Island (7.7 km²): 0.2%, not 0.4%. Lifetimes limited to six units and called indicative.
- Citations. Added Cartin 2014, Bell et al. 2015, Blackburn et al. 2020 and Moulton and Cropper's contrary conclusion; novelty narrowed.
- Memory rows. 17 of 19 Pacific rows confirmed against Wikipedia (Futuna and Oeno remain unverified); Necker, Howland and the Auckland Islands flagged as doubtful in the table, the map and the sensitivities.
Points not accepted in full. The referee's significance level for isolation treated islands of one archipelago as independent; with whole units resampled, the nearest-settled-island effect stands but the first-pass measure (nearest large land) is not established. Manuae (Cook Islands) is kept as inhabited at contact, because its article reports Cook finding it so in 1777. The figure of 58% is a lower bound, not a neutral number, because its denominator includes rocks and waterless atolls. And although every wave ended, six of eight did so by running out of targets, so the endings are not evidence of an intrinsic tendency to stop, nor against one.
Key numbers
| Quantity | Value | Uncertainty | Note |
|---|---|---|---|
| Pause in West Polynesia before the eastern pulse | 1,873 years (short chronology); 1,665 years (alternative chronology) | 95% range 1,797 to 1,948; 1,574 to 1,767 | Monte Carlo over published date windows |
| Duration of the eastern pulse (10% to 90% of dated units) | 251 years (short); 364 years (alternative) | 95% range 159 to 359; 259 to 524 | 20 of 29 settled units have date windows; 5 of those are generic |
| Doubling time of the count of dated units | 52 years (short); 91 years (alternative) | 95% range 37 to 68; 63 to 116 | Short-chronology curve is a step, not an exponential |
| Growth factor of the unit count per 30 years (formerly called reproduction number) | 1.49 (short); 1.26 (alternative) | 95% range 1.36 to 1.75; 1.20 to 1.39 | 1.44 and 1.23 with unit-specific windows only; 1.29 and 1.22 with Wilmshurst's seven archipelago windows. Not a measured number of daughters |
| Hop length, median | 360 km nearest settled neighbour; 517 km documented source-to-daughter (15 hops) | quartiles 196 to 533 km; 444 to 1,013 km | Longest documented hop 2,559 km |
| Longest hop the settled network needs | 1,923 km | 3,192 km if later-abandoned stepping stones are not used | Defined from the settled set, so not an independent range estimate; South America contact implies about 3,790 km |
| Share of targets settled, by definition | 29 of 50 (58%) for all land units to 19 of 20 (95%) for islands self-supporting since contact | 95% intervals 44% to 71% and 79% to 99.5% | Intermediate definitions give 65% and 85%; the first-pass 97% was circular and is withdrawn |
| Land units still inhabited at European contact | 13 of 50 (26%) | Against 29 of 50 reached | |
| Settled units abandoned before contact | 16 of 29 (55%) | 95% interval 37% to 72%; alternative codings 40% to 58% | Three of the 16 (Howland, Necker, Auckland Islands) are doubtful settlements; without them 13 of 26 |
| Share of settled land on abandoned islands | 0.2% (2.7% excluding New Zealand) | Counting only Enderby for the Auckland Islands; first-pass 0.4% used the whole group | |
| Island-level effect of distance to nearest settled island on abandonment | +3.4 log-odds per tenfold increase | 95% interval 2.0 to 6.5 (whole units resampled) | 78 islands in 29 units; holds at +2.0 (0.6 to 3.9) if 10 doubtful islands are counted as abandoned |
| Island-level effect of land area in the same fit | -1.8 log-odds per tenfold increase | 95% interval -4.3 to -0.75 | |
| First-pass isolation measure (distance to nearest land of 100 km2 or more), island level | +1.3 log-odds per tenfold increase | 95% interval -0.75 to +3.8 | Not established once islands of one unit are not treated as independent |
| Out-of-sample skill (AUC) for abandonment by radius over which land is counted | 0.69 island alone; 0.75 to 0.77 for 50 to 300 km; 0.66 for 1,000 km | Whole units held out; 0.5 is chance | |
| Mean number of neighbours within assumed voyaging range (2,100 to 3,500 km) | 13 to 24 on the settled graph; 17 to 31 on all land units | Implied stall threshold for the coloniser share about 0.14 to 0.34 (two-dimensional continuum approximation) | |
| Coloniser share p (Landis model), all 50 land units with fitted habitability | Supported from 0.45, 0.20, 0.15 upward at ranges 2,100, 2,600, 3,500 km | Likelihood ratio of p = 0.35 against best fit: 0.07, 0.57, 0.75 | Not identified; first-pass 0.72 was prior-dominated and is withdrawn |
| Units with a documented daughter settlement | 7 of 29 (24%) | 95% interval 12% to 42% | Lower bound; source of 14 units unknown. Compatible with one-third |
| Norse frontier units abandoned | 3 of 6 | 95% interval 17% to 83% | |
| Bird introductions that established | 37% of 832 events | 95% interval 34% to 41%; slope 0.33 +/- 0.07 log-odds per tenfold birds released | 23 species supply half the events; one-event-per-species slope 0.32 (0.13 to 0.57) |
| Maritime cultures that launched a settlement wave | 8 of 15 culture-periods; 5 of 11 lineages | No interval: reference rule written after the list; lineage share 24% or 12% with 10 or 30 unlisted non-expanders | |
| Illustrative short-run product, scenario medians | 0.01 to 0.8 | Conditional on feasibility; first few generations in a closed domain; not a prior | |
| Share of an analogue-based prior below 0.001, by assumed feasibility floor | under 1% (floor 0.01); 39% (floor 0.0001); 59% (floor 0.000001) | Project model's current prior: 41%. The low tail is set by the assumption, not by data | |
| Model probability of 'civilisations exist but do not spread' (sensitivity test) | 0.25 with the current prior; 0.04, 0.09, 0.15 with log-uniform priors from 0.01, 0.0001, 0.000001 to 1 | Sensitivity to assumed priors only; no change to the model recommended | |
| Per-generation stopping chance the analogues can exclude | Above 0.26 (10 observed wave-generations) to 0.07 (40) | Surviving 10,000 generations needs it below about 0.00007, which would take about 43,000 observed generations |
Changes made after the referee report
- Withdrew the fill fraction '97% (86% to 99.6%)'; added five outcome-independent definitions of a target (58% to 95%) coded from post-contact settlement history, and labelled the 1,923 km network range as defined from the settled set.
- Withdrew 'isolation had no measurable effect'; built an 88-island table with land areas from Wikipedia infoboxes and refitted abandonment at island grain with whole-unit resampling, one-island-per-unit resampling, held-out-unit skill and a profile over the radius within which neighbouring land is counted.
- Stated that the unit-level fitted chances of abandonment apply to stand-alone islands and whole archipelagos only.
- Rebuilt the percolation analysis on all 50 land units with habitability fitted from land area; withdrew the coloniser-share estimate of 0.72 as prior-dominated and outcome-conditioned; withdrew the first-pass rejection of Landis's strict rule; kept the neighbours-and-threshold result with a citation to Cartin 2014.
- Removed the recommended prior (median 0.03, 0.002 to 0.3); replaced it with four illustrative scenarios, a feasibility-floor table and model reruns presented as sensitivity tests; no change to the project model is recommended.
- Added an explicit statement and quantification of the mismatch between the analogue quantity (a few generations, at most about 50 targets, every wave ended) and the model parameter (about 10,000 generations), including a bound on the per-generation stopping chance.
- Renamed 'reproduction number' to growth factor of the unit count; added subsets by quality of date window, disclosed the five generic windows and the mixed-chronology 70-year delay, added the direct count of documented daughters, and described the short-chronology curve as a step.
- Replaced 'stalled only at a hard distance limit' with the attested ranges (1,923 to 3,192 km needed, 2,559 km longest documented hop, about 3,790 km implied by South American contact, Juan Fernandez and Galapagos unsettled).
- Corrected the land-loss share using Enderby Island (7.7 km2) instead of the whole Auckland group: 0.2% instead of 0.4%; restricted lifetimes to six units with unit-specific windows and labelled them indicative.
- Rebuilt the maritime census: stated the reference rule (written after the fact), removed three double-counted or ill-defined rows, added a lineage-level count, a sensitivity to unlisted non-expanders and a consistent coding of how each of eight waves ended.
- Checked the memory-graded rows against Wikipedia text: 17 of 19 Pacific rows and the seven census rows now carry a secondary-source grade; Futuna and Oeno remain unverified; Necker, Howland and the Auckland Islands are flagged as doubtful in the table, the map and the sensitivities.
- Added citations to Cartin 2014, Bell et al. 2015 and Blackburn et al. 2020, noted Moulton and Cropper's contrary conclusion from the same bird data, and narrowed the novelty claim.
- Added sensitivities: core western sources only, doubtful settlements dropped, doubtful islands recoded, one bird event per species.
- Rewrote figures 3, 4 and 5 and revised figures 1 and 2 to match the revised analysis; reran the whole pipeline from the single entry point so that all data files and figures match the final code.
Referee points not accepted
- Isolation significant at about p = 0.001 (accepted in direction, rejected in form): the referee's test treated islands of one archipelago as independent and used a typed, partly unsourced table. With whole units resampled, distance to the nearest settled island is a robust predictor (+3.4; 2.0 to 6.5), but the first-pass measure the referee re-tested (distance to nearest land of 100 km2 or more) is not established (+1.3; -0.75 to +3.8).
- Manuae (Cook Islands) as doubtful at contact: kept as inhabited, because its Wikipedia article reports that Cook found it inhabited in 1777.
- 29 of 50 (58%) as the neutral fill figure: it is a lower bound, not a neutral number, because its denominator includes bare rocks, waterless atolls and subantarctic islands; the report gives the full range of definitions up to 19 of 20.
- 'All waves ended' as evidence against sustained expansion: the fact is accepted and now stated in the first paragraph, but six of the eight waves ended by exhausting their targets, so the endings are not evidence of an intrinsic tendency to stop, nor against one.
- Define the census reference class before counting: no longer possible; the rule is stated as written after the fact, intervals are dropped and sensitivity to unlisted non-expanders is shown instead.
Figures
Code
Every number above is produced by these scripts from public data. The data tables themselves are not hosted here; the scripts download them.
common.py curated_tables.py figures.py invasions.py island_sources.py norse.py pacific.py run_all.py synthesis.py
Referee report
A second, separate analysis re-ran the code, recomputed the main numbers by its own route and tried to break the result. Like the first, it was run by Claude for this project; it is not an outside expert. In its report “the analyst” is the first analysis, which wrote the paper, and file names that are not linked on this page are its own working files. The paper above is the version revised in response.
Verdict: major problems. Results reproduced: yes.
The arithmetic reproduces exactly; the problems are in definitions and interpretation, not in the code.
Rerun. I copied code/ and data/ to a separate
working folder and ran run_all.py (141 s, using the
analyst's cached raw downloads). A recursive comparison of the
regenerated key_numbers.json with the analyst's found 0 differences. The
vendored model3.py is byte-identical to models/model3.py. The model
rerun gives 'stuck' 0.250 -> 0.072 (site), 0.037 for W=(1,3), 0.170
for the equal mixture, 0.323 -> 0.075 (self-sampling), and Bayes
factor 1.22 (site) and 1.29 (self-sampling), all as reported.
Independent recomputations:
| Check | Route | Result |
|---|---|---|
| Hop distances | Coordinates typed independently | Henderson to Rapa Nui 1,921 km (analyst 1,923); Mangareva to Rapa Nui 2,611 (2,559 from the nearest Gambier anchor); Norfolk to Lord Howe 896; Rapa Nui to Juan Fernandez 3,005; to Galapagos 3,562; Macauley to East Cape 875; Teraina to Hawaii 1,741. All agree. |
| Jeffreys intervals | Recomputed for 29/30, 16/29, 3/6, 8/18, 9/16, 7/29, 311/832, 67/419 | All match. |
| Timing | My own Monte Carlo over the date windows | Pause 1,873 yr, pulse 250 yr, doubling 52 yr, R 1.49 per 30 yr and 2.54 per 70 yr (short chronology); 1,664, 363, 92, 1.25, 1.70 (alternative). Matches. |
| Percolation | Event-driven simulator (different algorithm), nine grid cells | Agrees within Monte Carlo noise, e.g. range 2,100 km, p=1, s=0.6: coverage 0.451 / exact 0.072 against 0.459 / 0.073. |
| Behavioural factor | My own Monte Carlo | 0.082 / 0.277 / 0.817 (5 / 50 / 95%). Matches. |
| Bird data | Raw supplementary file read directly | 311 of 832 established (37.4%), 202 species. GAVIA status counts consistent. |
Citations spot-checked and found correct.
- Wilmshurst et al. 2011 ranges: Society 1025-1121, Marquesas 1200-1277, Gambier 1108-1275, Hawaii 1219-1266, New Zealand 1230-1282, Rapa Nui 1200-1253 (PMC full text).
- Ioannidis et al. 2021 dates: 830, 1050, 1110, 1130, 1140, 1190, 1210 (analyst's downloaded text).
- Leppard 2016 list of 13 mystery islands.
- Anderson & White 2001: Norfolk settled from Raoul, 13th to 15th century.
- Leppard et al. 2022: sample of 49 islands.
Not checked. The 19 Pacific rows and 7 census rows the analyst entered from memory. The Wilmshurst supplementary table (not obtainable).
Limits of my own sensitivity analyses. The island-level table uses land areas I typed or took from Wikidata, a non-exhaustive anchor list, and contact-era status I did not verify island by island (dropping six doubtful anchors changes nothing material). They show sensitivity to definitions; they are not replacement results.
Strongest objection
Everything carried from the analogues into the Fermi model is either selected on the outcome or measured on a different quantity from the one the model needs.
The model's parameter is the probability that a civilisation becomes a persistent, galaxy-filling expander: of order 1e11 targets, sustained for at least 0.3 Gyr, which means thousands to millions of successive relaunch generations. The analogues measure something much smaller: whether a culture that already had the capability filled a closed domain of 30 or fewer targets within 4 to 6 relaunch generations and about 300 years.
In every documented case the wave then stopped:
- Lapita paused for 1,700 to 1,900 years with empty islands about 1,150 km away.
- East Polynesian long-range voyaging contracted after about 1450, which the analyst's own census lists as a failure.
- The Norse frontier retreated.
Whether those stops came from running out of targets or from a cultural hazard that would also end an interstellar wave cannot be told from these data. So the analogues do not bound the low tail of the expansion probability. In the analyst's calculation that tail is set by the arbitrary 0.01 floor on the feasibility discount: move the floor to 1e-4 and 39% of the mass falls below 0.001, which is the prior the study says is unsupported (41%).
Two of the Pacific statistics offered as empirical support are also produced by definitions: the 97% fill fraction counts islands as habitable targets because they were settled, and the 'size, not isolation' result comes from merging persisted islands into archipelagos.
Does the conclusion survive? Only in a weaker form. What stands: given feasibility and a capable culture, launching and filling a small reachable domain within a few generations was common (order 0.1 to 0.8); with 13 to 24 targets in range, a Landis threshold near 1/3 does not stall a wave; long pauses do not show impossibility. What does not stand: the recommended prior range (0.002 to 0.3), the statement that mass below 0.001 lacks support, the cut of 'stuck' from 0.25 to 0.07 as an evidence-driven result, and the isolation null.
Errors found
- major. The headline '29 of 30 habitable targets
settled (97%, interval 86 to 99.6%)' is true by construction. A
'habitable target' is defined as a unit that was settled OR later
carried a self-supporting population, and the 1,923 km 'range' is
defined afterwards as the smallest range that connects the settled set.
So 29 of the 30 trials are in the denominator because they succeeded,
and a binomial interval on them means nothing.
- Evidence: pacific.py lines 429-442. Ten of the 16 abandoned units are coded by the analyst as NOT self-supporting later (habitable_later = 0), including Necker (0.18 km2, shrines), Howland (the table's own note: a 1987 survey found no evidence of settlement) and Suwarrow (0.4 km2). Unsettled Starbuck (16 km2), Kanton (9 km2) and Palmyra are excluded as non-habitable. With denominators that do not depend on the outcome: 29 of 50 East units in reach settled (58%; the code computes this, the report omits it) and 13 of 50 inhabited at contact (26%); 28 of 43 without rocks and subantarctic islands; 17 of 20 for units of 10 km2 or more; 19 of 20 for 'inhabited at contact or self-supporting later'.
- Fix: Drop the Jeffreys interval and the phrase '97% of habitable targets'. State instead: 'Exactly one island in reach that later carried a self-supporting population (Lord Howe) was never settled; 29 of the 50 land units in reach were settled and 13 were still inhabited at European contact.' Show the 58 to 97% spread by definition in one table.
- major. 'Abandonment depends on size; isolation had
no measurable effect' is produced by the unit definition. Persisted
small islands are merged into archipelago units (the 76 Tuamotu atolls
are one 850 km2 unit), while every abandoned island is its own unit.
Isolation is thereby absorbed into 'area'.
- Evidence: My island-level sensitivity (scripts/island_level.py): 67 East Polynesian anchor islands, 16 abandoned. There are 37 persisted islands under 100 km2, so the abandoned share under 100 km2 is 14 of 51 (27%), not 14 of 18 (78%). Logistic fit: area -1.25 +/- 0.48 per tenfold (p = 0.001) AND distance to nearest settled island +3.17 +/- 1.03 per tenfold (p = 0.001); number of settled islands within 300 km, p < 0.001; the analyst's own isolation measure, +1.71 +/- 1.01 (p = 0.07). Dropping six anchors of doubtful contact-era status changes nothing material. Leppard 2016, the analyst's own source, says the mystery islands 'are all either isolates, or in comparatively small isolated archipelagoes'.
- Fix: Retract the isolation null from the headline, key numbers, Figure 3 title and implications. Restate: 'At archipelago level, total land area predicts persistence; at island level both small size and few neighbours predict abandonment, so the two cannot be separated with these units.' Add that the fitted 0.74 chance at 10 km2 applies only to stand-alone islands. Build a properly sourced island-level table.
- major. The 'analogue-informed prior' (0.3 for
behaviour, 0.03 after discount) and the model consequence ('stuck' 0.25
-> 0.07) are judgement, not evidence. Three separate problems: (a)
the lower tail is set entirely by the arbitrary 0.01 floor on the
feasibility discount; (b) the three factors use reference classes chosen
after the fact; (c) the quantity measured is not the model's parameter.
- Evidence: (a) My rerun: with a discount floor of 1e-4 the median is 0.0027 and 39% of mass lies below 0.001, which is the model's existing prior (41%); with a floor of 1e-6 it is 60%. (b) The census of 18 cultures has 7 rows from memory, counts Polynesians and Austronesians as both successes and failures, and has an open-ended denominator: adding 30 capable non-expanders moves the single-faction median from 0.18 to 0.065. '7 of 8 waves filled their accessible domain' defines the domain by what was filled, although Lapita stopped for 1,700 to 1,900 years with the Cooks about 1,150 km away. (c) model3.py line 58 defines p_exp as becoming a persistent galaxy-filling expander (fill time at least 0.3 Gyr). The analogues are closed domains of 30 targets or fewer, 4 to 6 relaunch generations and at least 500 years, and all three best-documented waves ended. (d) W_exp = (2,5) does not 'reproduce' the range: it puts 12% below 0.001 (analogue range 0.6%) and 18% above 0.29 (5%).
- Fix: Present the behavioural factor as a conditional illustration: given feasibility, and over the first few relaunch generations, launch and early spread were not rare. Remove 'about 0.03 (0.002 to 0.3)' from the headline. Report the model rerun only as a sensitivity test, alongside a table of the result against the discount floor (1e-2, 1e-4, 1e-6). Delete or rewrite 'no behavioural support for values below 0.001' and 'any mass below that must be justified by physical or economic infeasibility'.
- major. The percolation fit does not test Landis and
its node set is conditioned on the outcome. The graph contains only the
units that were settled plus Lord Howe; the 21 unsettled or traces-only
East units are removed as 'not habitable'. The likelihood is then 'all
settled units were settled, and one island was not'. With 13 to 24
neighbours in range, any p above the threshold gives full coverage, so p
is barely identified.
- Evidence: The coverage-only posterior mean for p is 0.69 to 0.82 against a flat-prior mean of 0.525; the likelihood ratio at p = 0.35 against the best value is 0.08 to 0.83. The only direct data on the coloniser share, 7 of 29 (24%, a lower bound), is compatible with Landis's 1/3. My rerun with the 10 unsettled atolls of 3 km2 or more as targets: the single-s model cannot reproduce the pattern at all (best likelihood below 1e-14, against 0.01 to 0.08 with Lord Howe alone), so it is mis-specified without a habitability term.
- Fix: Reframe: 'The Pacific cannot estimate Landis's p. It shows that with 13 to 24 targets in range the threshold is at most 0.19 to 0.34 and the wave was above it; documented colonisers are at least 24% of units.' Remove the posterior mean 0.72 from the headline or label it prior-dominated. State that the node set is selected on outcome.
- minor. 'Reproduction number R' is a restatement of
unit-count doubling time, not a measured offspring number. The rate is
ln(k)/(t50 - first), with k set by how many units have dates. Three of
the 20 'dated' units carry the generic 1190-1293 window and Nihoa and
Necker carry 1300-1600. The 70-year interval comes from four genetic
point dates belonging to a chronology that contradicts the short
radiocarbon one (under the short chronology the Southern Cooks,
1231-1290, post-date their supposed daughter the Societies, 1025-1121).
- Evidence: My sensitivity: R per 30 yr 1.22 to 1.49 and per 70 yr 1.6 to 2.5 across four subsets and both chronologies (inside the reported ranges). With only the seven archipelago-specific windows the short-chronology doubling time is 81 yr, not 52. Wilmshurst et al. themselves describe a step (one archipelago, then 'one major pulse'), not exponential growth.
- Fix: Call it 'growth factor of settled units per 30 or 70 years'. Add the direct offspring count (documented daughters per early unit: Mangareva 3, New Zealand 3, Tuamotus 2, Southern Cooks 2). Say that the short chronology is a step function and that the 70-year delay mixes chronologies.
- minor. Two close prior works are missing, and the
novelty claim is too broad.
- Evidence: Cartin 2014 (JBIS 67, 119; arXiv:1404.0204) ran Landis percolation on the real positions of stars within 40 pc with a maximum travel distance, so the dependence of the outcome on range and neighbours is already published. Bell, Currie, Irwin & Bradbury 2015 (American Antiquity 80, 397) fitted an island-level epidemic-type colonisation model to settlement dates of 24 Oceanic island groups with Bayesian model selection.
- Fix: Cite both. Narrow the claim to: first application of Landis's coloniser rule to an archaeological island graph, and a joined table of reach, timing and abandonment.
- minor. 'Stalled only at a hard distance limit'
conflicts with the study's own evidence of longer voyages.
- Evidence: Figure 4 marks South American contact at about 3,800 km. The analyst's own figure for Hawaii without abandoned stepping stones is 3,192 km. If capability was 3,500 km or more, Juan Fernandez (3,003 km) and Galapagos (3,561 km) were in range and unsettled.
- Fix: Say: 'the network needed hops of 1,900 to 3,200 km; voyages of 3,500 km or more are attested; two habitable groups at 3,000 to 3,600 km were not settled'.
- minor. 'Only 0.4% of settled land was lost' is
fragile. New Zealand is 92% of the denominator, and 570 of the 1,164 km2
'lost' is the whole Auckland group credited for a single site on Enderby
Island (7.7 km2).
- Evidence: curated_tables.py: Auckland Islands 570 km2; Wikidata gives Enderby 7.7 km2. Excluding New Zealand the figure is 5.1%. Counting Enderby alone gives about 0.2% and 2.6%.
- Fix: Report 'about 0.2 to 0.4% (3 to 5% without New Zealand)' or drop the statistic from the headline.
- minor. Lifetimes of failed settlements, and 'about
three relaunch delays', are not measured to the precision implied.
- Evidence: Eight units. Nihoa's lifetime is 1636 minus a 1300-1600 window. Ten of the 29 units have imputed exposure in the failure-rate calculation. The 70-year delay comes from the other chronology.
- Fix: Give lifetimes as 'roughly 100 to 400 years for the six units with usable dates' and drop the ratio to relaunch delay, or mark it as indicative.
- minor. The bird section omits that the authors of
the 832-event file concluded the opposite of what the analyst reports,
and that a re-analysis reversed them.
- Evidence: The paper is titled 'Propagule pressure does not consistently predict the outcomes of exotic bird introductions' (Moulton & Cropper 2019). Blackburn, Cassey, Lockwood & Duncan 2020 (PeerJ 8:e8766) re-analysed the same data and found a strong positive relation, in line with the analyst's slope of 0.33 +/- 0.07. Also, 23 species supply 51% of events, and GAVIA has 9,141 records of unknown status.
- Fix: Cite both papers and say which side the reanalysis here supports. Lead with the 46 to 72% range for GAVIA, not 72%.
Overclaims
- '29 of 30 habitable targets settled (97%, 95% interval 86 to 99.6%)': the denominator is selected on the outcome; shares that do not depend on the outcome run from 58% to 95%.
- 'Isolation had no measurable effect' on abandonment: an artefact of merging persisted islands into archipelago units; at island level isolation is significant (p about 0.001).
- 'Stalled only at a hard distance limit ... not in Landis-style unsettled pockets': the 21 unsettled land units in reach are defined as non-habitable, and voyages well beyond 1,923 km are attested.
- 'R about 1.3 to 1.5 per generation' called a reproduction number: it is a unit-count growth factor that depends on the number of dated units, on imputed windows and on a mixed-chronology interval.
- 'Percolation fit gives a coloniser probability of 0.72 (5% quantile 0.35)': prior-dominated and conditioned on a node set made of the settled islands; the only direct evidence (7 of 29 documented colonisers) is compatible with Landis's 1/3.
- 'The analogues put the behavioural part of the expansion probability at about 0.3 (0.08 to 0.8)': the product of three reference classes chosen after the fact and equal-weight judgement mixtures.
- 'About 0.03 (0.002 to 0.3)' as an 'evidence-informed' prior: the lower bound is the arbitrary 0.01 feasibility floor.
- 'They give no behavioural support for values below 0.001 ... any mass below that must be justified by physical or economic infeasibility': the analogues cover 4 to 6 relaunch generations in closed domains and cannot bound the chance of sustaining expansion across a galaxy; every analogue wave ended.
- 'Civilisations arise but almost never expand falls from 0.25 to 0.07': correct arithmetic, but it is the effect of an assumed prior, not of data.
- 'Only 0.4% of settled land was lost': dominated by New Zealand's area, and half the lost area is the whole Auckland group credited for one site.
- 'Failed outposts lasted about three relaunch delays, long enough to act as stepping stones': eight poorly dated lifetimes divided by a four-point delay from an incompatible chronology.
- Novelty claim of the first percolation model on a real graph with a neighbour-dependent threshold: Cartin 2014 and Bell et al. 2015 precede it.
Novelty check
Novel: partly. The qualitative Pacific findings are established archaeology: a long pause, a rapid pulse, nearly every viable island reached, marginal isolated islands abandoned. Landis-type percolation on a real point set with a range limit is Cartin 2014, and likelihood fitting of an island-level spread model to Oceanic settlement dates is Bell et al. 2015; neither is cited. I found no earlier work that applies Landis's coloniser rule to an archaeological island graph, no published logistic regression of mystery-island abandonment on area and isolation, and no earlier attempt to turn these analogues into an explicit prior for a Fermi model. Those three are probably new. Of them, the percolation fit is uninformative about p, the regression's isolation null is an artefact of the units, and the prior is judgement. The joined table of reach, timing and abandonment under two chronologies is a useful compilation, not a discovery.
- Cartin 2014, JBIS 67, 119 (arXiv:1404.0204): Landis percolation on real star positions within 40 pc with a maximum travel distance
- Bell, Currie, Irwin & Bradbury 2015, American Antiquity 80, 397: island-level epidemic-type colonisation model fitted to settlement dates of 24 Oceanic island groups
- Landis 1998, JBIS 51, 163; Hair & Hedman 2013; Carroll-Nellenback et al. 2019 (percolation and settlement-front models, no empirical fit)
- Wilmshurst et al. 2011, PNAS 108, 1815 (two-phase short chronology; pause and pulse)
- Leppard 2016, J. Pacific Archaeology 7(2), 20 (mystery islands; notes they are isolates or small isolated archipelagos)
- Anderson 2001, 'No meat on that beautiful shore' (resource-depletion explanation for mystery-island abandonment)
- Leppard et al. 2022, J. World Prehistory 35, 163 (49-island regression of colonisation dates)
- Montenegro, Callaghan & Fitzpatrick 2016, PNAS (shortest-hop seafaring simulations)
- Finney & Jones 1985, Interstellar Migration and the Human Experience (qualitative Polynesian analogy)
- Blackburn, Cassey, Lockwood & Duncan 2020, PeerJ 8:e8766 (re-analysis of the Moulton & Cropper bird data)
Required changes
- Headline and key number 1: delete '97% (86 to 99.6%)'. Replace with: 'one island in reach that later carried a self-supporting population (Lord Howe) was never settled; 29 of the 50 land units in reach were settled and 13 were inhabited at contact', plus a small table of the share under four definitions (58%, 65%, 85%, 95 to 97%). Say that the 1,923 km range is defined from the settled set.
- Headline, key number 9, Figure 3 title, implication 3: withdraw 'isolation had no measurable effect'. Add an island-level analysis with persisted archipelagos split into islands and sourced land areas, or state that unit aggregation confounds size with isolation and that an island-level check finds both significant. Say that the fitted abandonment chances apply to stand-alone islands only.
- Transfer section and headline: relabel the 0.28 (0.08 to 0.82) factor as an illustrative product conditional on feasibility and valid for the first few relaunch generations in a closed domain. Remove 'about 0.03 (0.002 to 0.3)' as a recommended prior. Add a table of median and share below 0.001 against the discount floor (1e-2, 1e-4, 1e-6).
- Implication 5 and the last key number: present the model rerun as a sensitivity test of an assumed prior. Delete 'they give no behavioural support for values below 0.001' and 'any mass below that must be justified by physical or economic infeasibility'; replace with 'the analogues cannot constrain the probability of sustaining expansion beyond a few generations, in either direction'. Do not change the project model's W_exp on the strength of this study.
- State the mismatch between the analogue quantity (closed domain, 30 or fewer targets, 4 to 6 generations, 500 years) and the model's p_exp (galaxy-filling, at least 0.3 Gyr), and that all three best-documented waves ended.
- Percolation section and Figure 4: state that the node set is the settled islands plus Lord Howe, that p is identified only through coverage, and that documented colonisers (7 of 29) are compatible with p = 1/3. Remove the posterior mean 0.72 from the headline or mark it prior-dominated. Keep the conclusion about neighbours and threshold, citing Cartin 2014.
- Census of maritime cultures: define the reference class before counting, or drop the Beta intervals. Remove double-counted lineages (Polynesians, Austronesians/Malagasy), verify the 7 rows from memory, and add a sensitivity test for extra non-expanders. Recode '7 of 8 waves filled their domain' with the Lapita pause treated consistently.
- Rename 'reproduction number' to 'growth factor of settled units'. Disclose that 3 of 20 windows are generic and that the 70-year delay mixes chronologies. Add the direct count of documented daughters per early unit. Note that the short chronology is a step, not exponential growth.
- Replace 'stalled only at a hard distance limit' with the attested ranges (network hops 1,900 to 3,200 km; voyages of 3,500 km or more; two habitable groups at 3,000 to 3,600 km unsettled).
- Fix or drop the 0.4% land-loss figure (use Enderby's 7.7 km2 for the Auckland Islands site, or give 0.2 to 0.4% and 3 to 5% without New Zealand). Soften the lifetime and 'three relaunch delays' statements to indicative.
- Add the missing citations: Cartin 2014 (JBIS 67, 119), Bell et al. 2015 (American Antiquity 80, 397), Blackburn et al. 2020 (PeerJ 8:e8766), and note Moulton & Cropper's own contrary conclusion. Narrow the novelty paragraph accordingly.
- Data provenance: verify the 19 Pacific rows entered from memory (especially the habitable_later codes that decide the fill denominator) and flag Necker, Howland and the Auckland Islands as doubtful 'settlements' in the main table, not only in the notes.