Where is everybody? · Working papers
Stars passing the Sun: a Gaia census and what it means for short-hop settlement
Revised after a second, separate analysis run for this project tried to break it. Neither analysis is an outside expert.
Gaia flyby census: stellar encounters with the Sun and short-hop settlement in the real local star field
Revised after refereeing. Every number is regenerated by
python3 code/run_all.py (about 23 min, single-threaded,
fixed seed) and collected in data/report_tables.md and
data/results.json.
Summary. Star systems pass within 1 pc of the Sun at 11.1 ± 1.0 per Myr, one per 90 kyr (Gaia nearby-star catalogue, an estimator that needs no radial velocities; the uncertainty is the half-range over six ways of counting stellar systems, and raw counts of stars with clean radial velocities alone require at least 8.6 ± 0.8). About 21,000 (11,000–59,000) distinct systems therefore passed within 1 pc in the 2.33 Gyr since the Great Oxidation, but only 6,000 (3,300–13,000) and 4,100 (2,600–8,000) in the last 0.67 and 0.47 Gyr, the eras in which Earth's biosphere is less contestably detectable from afar; none has passed in the radio era. An untouched Solar System limits the fraction x of passing systems that cross 1 pc and leave a lasting, evident presence to x < 1.4 × 10⁻⁴ (95%) if the presence lasts 2.33 Gyr, 7.2 × 10⁻⁴ for 470 Myr and only 0.27 for 1 Myr; all limits are 8 times weaker if only systems passing slower than 30 km/s count. A settlement that waits for stars to drift within 0.5–5 pc and sends 30 km/s ships only to stars at which they can stop (relative speed below 30 km/s) doubles every 0.06–2.9 Myr for launch delays up to 1 Myr. Its front moves at 48–108 km/s, depending on hop length and direction, which crosses the Galaxy in about 0.2–0.5 Gyr and reproduces Carroll-Nellenback et al. (2019). Main caveats: every system is assumed settleable (if only 3% are, growth alone takes 0.7 Gyr for 1 pc hops and 2.8 Gyr for 0.5 pc hops); the simulation is a local periodic box with straight-line motion, so the Galaxy time is an extrapolation; extending the rate over Gyr rests on an assumed factor-of-two range; and x constrains persistent, evident presences only. Faster figures (doubling in 33–578 kyr, crossing in about 0.1 Gyr) hold only for ships able to match the velocity of any passing star and are an upper bound on spreading speed.
Question
How often do other star systems pass close to the Sun, how many did so while Earth carried a remotely detectable biosphere, and how fast would a "wait for a star to drift close, then hop" settlement spread through the star field Gaia measures? What does an untouched Solar System then imply for the fraction x of star systems hosting a civilisation able and willing to make such a hop?
Data
| Source | Rows | Use and cuts |
|---|---|---|
Gaia Catalogue of Nearby Stars (GCNS; Gaia Collaboration, Smart et
al. 2021), VizieR J/A+A/649/A6/table1c |
331,312 | All objects within 100 pc: parallaxes, proper motions. No cut beyond GCNS's own. |
GCNS resolved binaries, table3 |
19,176 pairs (17,418 flagged binary) | Merging sources into systems. |
Gaia DR3 gaia_source, RV not null, parallax > 8 mas
(ESA archive) |
288,288 | Radial velocities for GCNS stars. "Clean" = RV error < 5 km/s and
rv_expected_sig_to_noise ≥ 5. |
| Gaia DR3, RV not null, parallax > 2 mas, parallax/error > 5, linear perihelion < 15 pc | 17,804 | Model-free lower bound; comparison with published encounters. |
10 pc sample (Reylé et al. 2021), J/A+A/650/A201 |
562 objects, 338 systems, 268 with a stellar primary | Completeness of GCNS systems; radio-era counts. |
Bailer-Jones 2022, J/ApJ/935/L9/table12 |
61 | Recovery test. |
Bailer-Jones et al. 2018 table 23 (3,379 rows) is downloaded but enters no number. A "system" is a set of GCNS sources merged with GCNS table 3 plus my co-moving pair search (projected separation < 0.1 pc, consistent distance, tangential-velocity difference < 2 + 84/√(separation in au) km/s), counted once. Gaia-visible brown dwarfs are included: 23 of the 309 GCNS sources within 10 pc are brown dwarfs, and 22 of the 267 GCNS systems there have a brown dwarf as brightest member.
Method
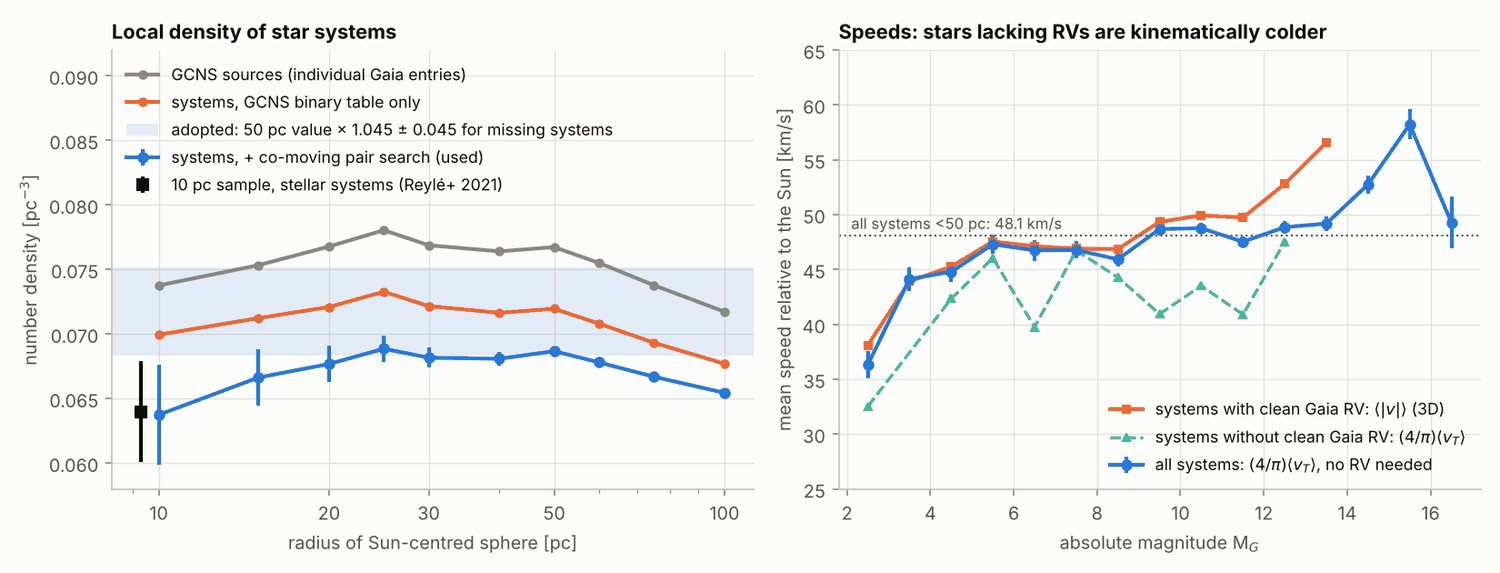
- Rate without radial velocities. Γ(d) = π d² n ⟨v⟩, and for a volume-complete all-sky sample ⟨v_T⟩ = (π/4)⟨v⟩, so Γ(d) = 4 d² Σ v_T / V needs only parallaxes and proper motions. I use the 35,958 GCNS systems within 50 pc, times 1.045 ± 0.045 for systems missing from GCNS (a judgment: 91.8% of 10 pc stellar systems are in GCNS, yet the GCNS 50 pc density already exceeds the 10 pc one). The quoted uncertainty is half the range of six defensible variants: two merging schemes, with and without the 1.09 correction implied by the 10 pc sample, and the 10 pc sample alone with the 50 pc mean speed or its own 3D speed.
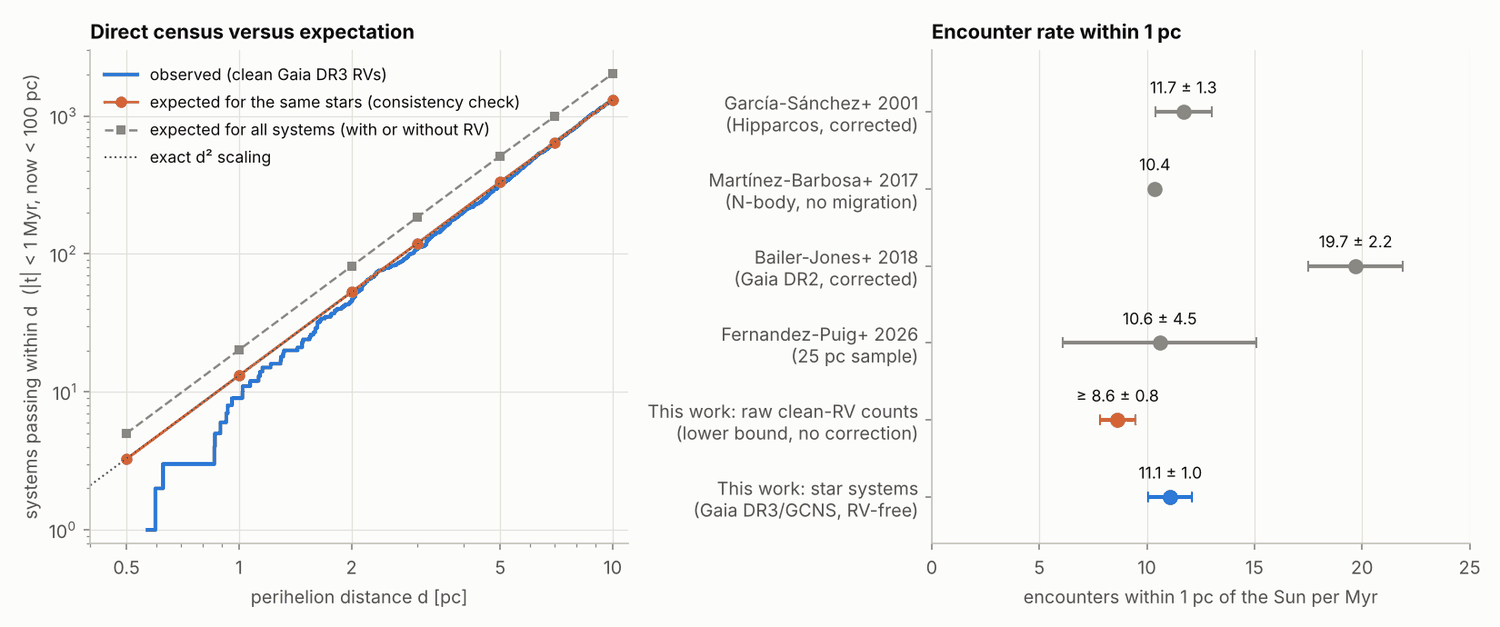
- Census and lower bound. For GCNS systems within 100 pc with clean RVs I compute linear-motion perihelia and count those within d and |t| < 1 Myr. The expected count for those same stars follows from isotropy and their speed distribution. This is a consistency check on the 65% of the encounter flux that has clean RVs; it shares the isotropy assumption with the rate estimator. Separately, the raw count N of clean-RV Gaia sources at any distance with perihelion inside d and |t| < T gives a model-free lower bound N/(2 T d²).
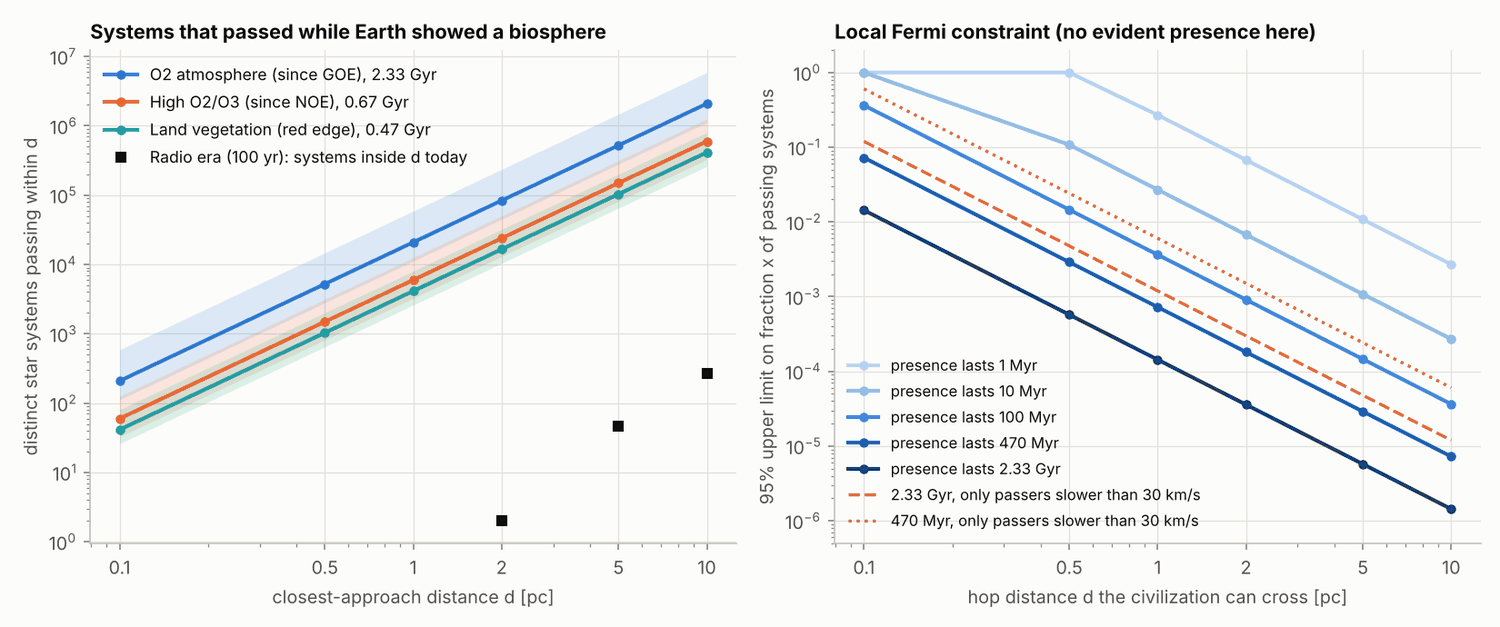
- Exposure. N(d, era) = Γ(1 pc) d² T F(T). Era lengths T: oxygenated atmosphere since the Great Oxidation, 2.22–2.43 Gyr (Poulton et al. 2021); high O₂/O₃ since the Neoproterozoic oxygenation, 0.54–0.80 Gyr (Och & Shields-Zhou 2012; Lyons et al. 2014); land vegetation, 0.43–0.51 Gyr (Wellman et al. 2003; Morris et al. 2018); radio, 100 yr. F(T) is the rate averaged over the last T divided by today's, from integrating the Sun's orbit in an axisymmetric potential through an exponential disc; F = 1 for T ≤ 10 Myr. I assume ranges of 0.6–1.3 (eras under 0.8 Gyr) and 0.5–2.0 (2.3 Gyr) for spiral arms, migration and disc evolution; Martínez-Barbosa et al. (2017) find a 0.54–1.62 spread across solar migration scenarios.
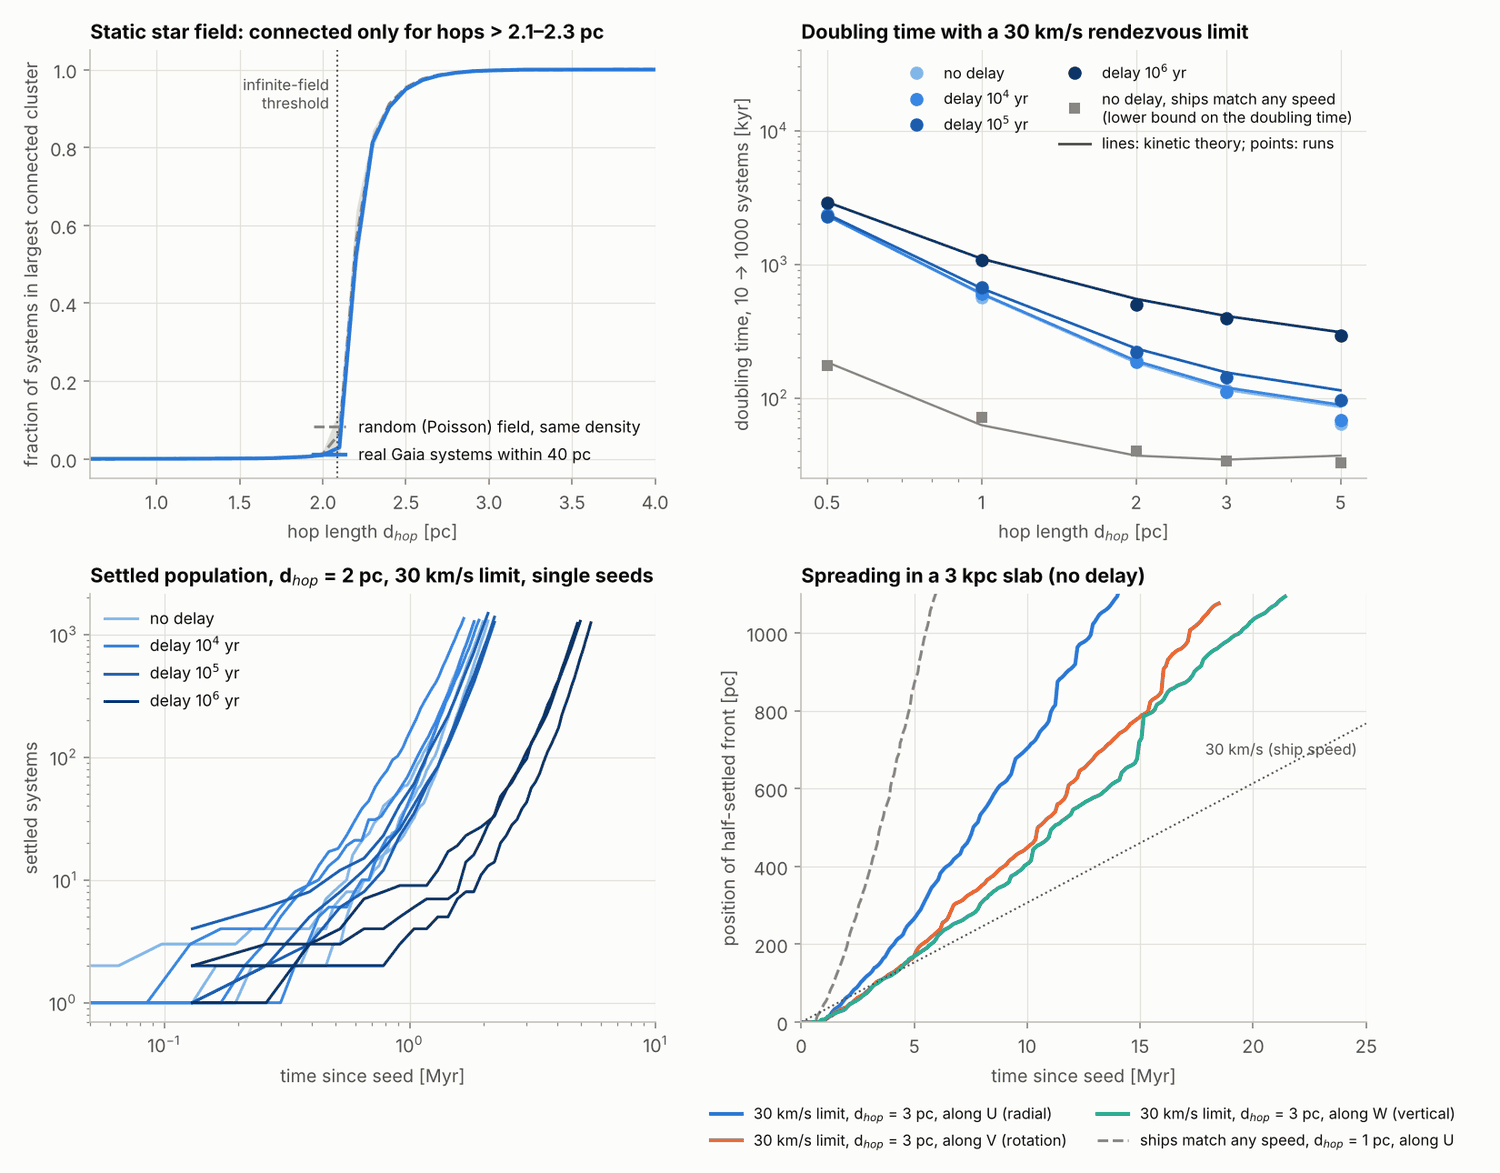
- Settlement. Periodic boxes at the measured density, velocities resampled from 23,243 Gaia stars within 50 pc with clean 6D data, reweighted so that (M_G, v_T) matches all systems. Stars move in straight lines. A settled system becomes active after t_delay and sends a 30 km/s ship to any unsettled star within d_hop. Lead rule: only if the two stars' relative speed is below 30 km/s, the velocity change needed to stop there. Upper-bound rule: at any relative speed, which assumes ships can match the velocity of any passing star. Every system is settleable (f = 1) unless stated. Doubling time T2 is measured from 10 to 1000 systems in (80 pc)³ cubes, three realisations per cell, seeded on a typical disc star (slower than 30 km/s); random origins are tested separately. Front speed is the half-settled front between 250 and 1000 pc in a 3000 × 16 × 16 pc slab laid along Galactic U, V or W. A side is counted only if it reached 1 kpc before the opposite front came within 100 pc of the periodic boundary. Runs are compared with kinetic theory: growth rate s = f π d² n λ exp(−s τ), where λ is the leading eigenvalue of the pair kernel |v_i − v_j| restricted to the rendezvous limit and τ is delay plus transit.
- Constraint. If each passing system independently has probability x of leaving a presence that persists for L, an untouched Solar System gives x < 3.0 / N(d, min(L, T)) at 95%.
Results
Rate (Fig. 1, 2).
| Quantity | Value |
|---|---|
| System density, GCNS < 50 pc raw / adopted | 0.0687 ± 0.0004 / 0.0718 ± 0.0034 pc⁻³ |
| Mean speed relative to the Sun | 48.1 ± 0.6 km/s |
| Γ(1 pc), raw flux sum | 10.61 ± 0.07 Myr⁻¹ |
| Γ(1 pc), adopted | 11.1 ± 1.0 Myr⁻¹ (variants 9.9–11.9; internal error 0.5) |
| 10 pc sample alone, own 3D speeds (52.3 ± 2.4 km/s) | 10.75 ± 0.82 Myr⁻¹ |
| Model-free lower bound (108 sources, d < 5 pc, |t| < 0.25 Myr) | ≥ 8.6 ± 0.8 Myr⁻¹ |
| Other definitions: with brown-dwarf primaries / every stellar object | 12.5 / 13.7 Myr⁻¹ |
| Passers slower than 30 / 10 km/s | 12.0% / 0.27% of the flux |
The rate is 0.56 of the 19.7 ± 2.2 of Bailer-Jones et al. (2018) and agrees with García-Sánchez et al. (2001; 11.7 ± 1.3), Martínez-Barbosa et al. (2017; 10.4 without migration) and Fernandez-Puig et al. (2026; 10.6 ± 4.5), who already attribute the 2018 excess mainly to spurious parallaxes. The lower bound alone is 0.44 of the 2018 value. Stars lacking a Gaia RV are kinematically colder (42.2 ± 0.6 versus 48.4 km/s at 4 ≤ M_G < 12), so RV-selected samples overweight fast stars.
Census (|t| < 1 Myr, now < 100 pc; 133,876 clean-RV systems of 274,150).
| d [pc] | 0.5 | 1 | 2 | 3 | 5 | 7 | 10 |
|---|---|---|---|---|---|---|---|
| observed | 0 | 9 | 45 | 109 | 310 | 639 | 1300 |
| expected | 3.3 | 13.1 | 52.8 | 119.0 | 332.6 | 643.1 | 1313.9 |
Counts are consistent with the expectation (differential χ² = 5.7 for 7 bins) and scale as d^(2.04 ± 0.06). The small-d deficit (zero within 0.5 pc has Poisson probability 0.04) is not significant. A system rate of 19.7 Myr⁻¹ would predict 23 within 1 pc and 591 within 5 pc. All 61 Bailer-Jones (2022) encounters are recovered.
Exposure (Fig. 3): distinct systems passing within d; central (low–high).
| Era | F | 0.5 pc | 1 pc | 5 pc | 10 pc |
|---|---|---|---|---|---|
| O₂ atmosphere, 2.33 Gyr | 0.81 | 5.2e3 | 2.1e4 (1.1e4–5.9e4) | 5.2e5 | 2.1e6 (1.1e6–5.9e6) |
| High O₂/O₃, 0.67 Gyr | 0.80 | 1.5e3 | 6.0e3 (3.3e3–1.3e4) | 1.5e5 | 6.0e5 (3.3e5–1.3e6) |
| Land vegetation, 0.47 Gyr | 0.79 | 1.0e3 | 4.1e3 (2.6e3–8.0e3) | 1.0e5 | 4.1e5 (2.6e5–8.0e5) |
| Radio, 100 yr (systems inside d today) | 1 | 0 | 0 | 46 | 268 |
Whether mid-Proterozoic oxygen was remotely detectable is contested (Reinhard et al. 2017), so the 2.33 Gyr row is the generous case and the two shorter eras the cautious one. Passages within 1500 au: 0.59 per Gyr.
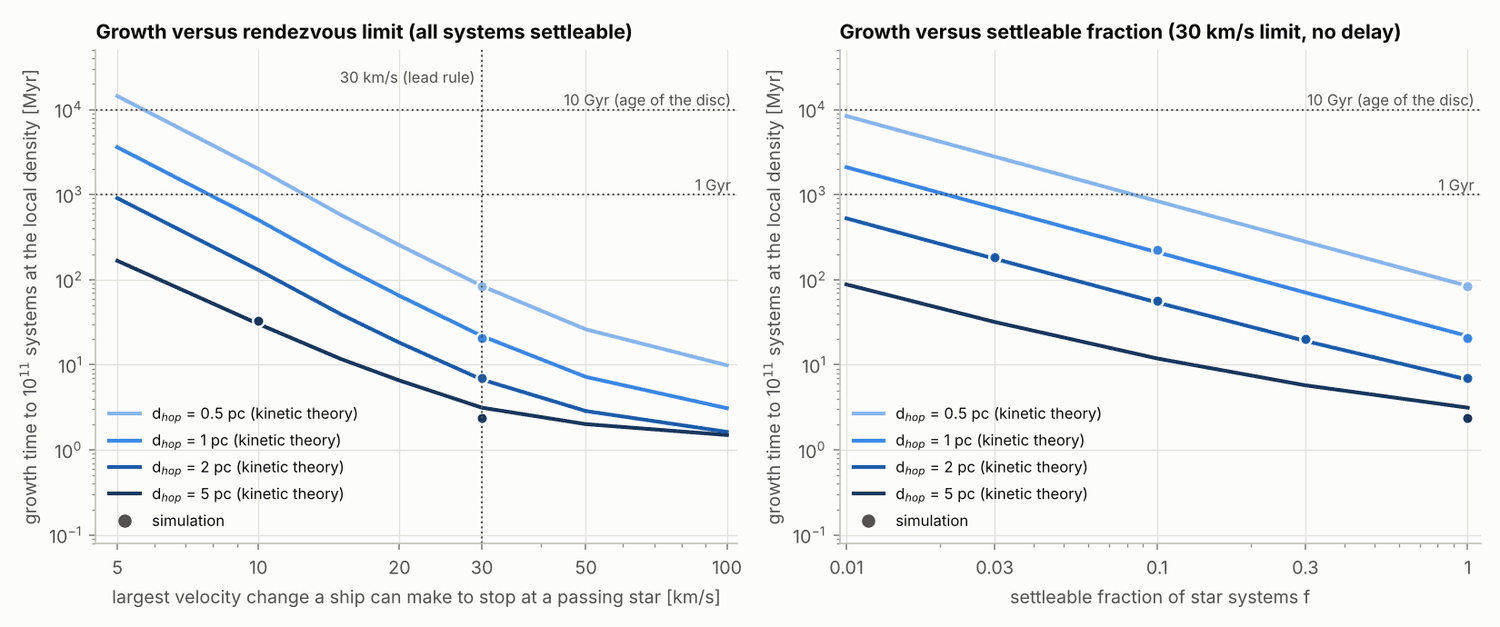
Settlement with a 30 km/s rendezvous limit (Fig. 4, 5). Today's star field is statically connected only above 2.1–2.2 pc (half of the 18,252 real systems within 40 pc join one cluster at 2.20 pc; a random field gives 2.19 pc). Stellar motion removes that threshold:
| d_hop [pc] | n d³ | T2 [kyr], delay 0 / 10⁴ / 10⁵ / 10⁶ yr | Front along U / V / W [km/s] | Growth to 10¹¹ systems [Myr], f = 1 / 0.1 / 0.03 |
|---|---|---|---|---|
| 0.5 | 0.009 | 2293 / 2353 / 2278 / 2872 | none within 1 kpc (growth-limited) | 84 / 839 / 2800 |
| 1 | 0.07 | 567 / 599 / 676 / 1079 | 55–62 / not run / not run | 22 / 211 / 700 |
| 2 | 0.57 | 192 / 185 / 221 / 500 | 64–78 / 59 / 48 | 6.7 / 54 / 176 |
| 3 | 1.9 | 114 / 111 / 141 / 394 | 77–93 / 67 / 58 | 4.2 / 26 / 80 |
| 5 | 9.0 | 64 / 68 / 96 / 292 | 83–108 / 74 / 66 | 3.1 / 12 / 32 |
T2 is simulated; all 60 seeds reached 1000 systems. Kinetic theory agrees within 15% in 17 of 20 cells (worst 25%, at 5 pc, where targets already lie within reach). Growth times are kinetic, no delay; they scale as 1/f in the dilute regime, and runs at f = 0.3, 0.1 and 0.03 match within 7%. Only 5.3% of the pair-encounter flux is slower than 30 km/s.
Upper bound, ships that match any speed: T2 = 174 / 71 / 40 / 34 / 33 kyr with no delay and 578 / 347 / 242 / 192 / 171 kyr with a 1 Myr delay; front along U 183–245 km/s (14 runs), carried by halo stars, strongly anisotropic (single sides: 170 km/s along W, 475 km/s toward negative V) and rising with slab width.
How little capability is enough (kinetic, f = 1, no delay, ship speed equal to the limit below 30 km/s):
| Rendezvous limit [km/s] | 5 | 10 | 15 | 20 | 30 | 50 | none |
|---|---|---|---|---|---|---|---|
| Share of pair flux | 0.009% | 0.12% | 0.5% | 1.4% | 5.3% | 22% | 100% |
| T2 at 1 pc [Myr] | 99 | 13.8 | 4.0 | 1.8 | 0.60 | 0.20 | 0.063 |
| Growth to 10¹¹ at 1 pc [Myr] | 3600 | 504 | 146 | 65 | 22 | 7.2 | 2.3 |
Simulated 10 km/s ships with a 10 km/s limit confirm this: T2 = 0.89 Myr (5 pc hops) and 1.74 Myr (3 pc), against 0.83 and 1.72 predicted.
Origins that stall. Under the limit a fast-moving origin has few partners. For 1 pc hops the median wait for a first reachable star is 1.2 Myr (0.08 Myr at any speed); 13% of origins wait over 10 Myr, 2.5% over 100 Myr and 0.8% over 1 Gyr; 0.3% have no partner below 30 km/s in the sample. In simulation, 20 of 24 random origins reached 1000 systems within 30 Myr and 22 of 24 within 100 Myr (stalled origins move at a median 105 km/s, started ones at 32 km/s); at 2 pc all 24 started.
Galaxy. At f = 1 growth to 10¹¹ systems takes 2–105 Myr, so filling is limited by transport. Dividing 23.2 kpc (Sun to the far edge of the disc) by the fronts gives 0.21–0.47 Gyr (0.28 Gyr for the median radial front), the same as the at most 0.3 Gyr of Carroll-Nellenback et al. (2019). Epicycles turn radial motion around after about 2 kpc, which by a rough estimate lengthens a radial crossing to about 0.43 Gyr, while shear wraps the settled region in azimuth within a similar time; neither is simulated. The upper-bound rule gives 0.09–0.12 Gyr. Growth, not transport, limits short hops and small f: reaching 10¹¹ systems within 1 Gyr at f = 1 needs d_hop > 0.15 pc (0.04 pc at any speed), and hops of 1500 au need 400 Gyr.
Local Fermi constraint (95% upper limit on x; passers at any speed).
| Persistence | 0.1 pc | 0.5 pc | 1 pc | 2 pc | 5 pc | 10 pc |
|---|---|---|---|---|---|---|
| 1 Myr | 1 | 1 | 0.27 | 0.068 | 0.011 | 2.7e-3 |
| 10 Myr | 1 | 0.11 | 0.027 | 6.8e-3 | 1.1e-3 | 2.7e-4 |
| 100 Myr | 0.36 | 0.015 | 3.6e-3 | 9.1e-4 | 1.5e-4 | 3.6e-5 |
| 470 Myr | 0.072 | 2.9e-3 | 7.2e-4 | 1.8e-4 | 2.9e-5 | 7.2e-6 |
| 670 Myr | 0.050 | 2.0e-3 | 5.0e-4 | 1.3e-4 | 2.0e-5 | 5.0e-6 |
| 2.33 Gyr | 0.014 | 5.7e-4 | 1.4e-4 | 3.6e-5 | 5.7e-6 | 1.4e-6 |
If only passers slower than 30 km/s count, limits are 8.3 times weaker (1 pc: 1.2e-3 for 2.33 Gyr, 6.0e-3 for 470 Myr); slower than 10 km/s, 360 times weaker (0.052 for 2.33 Gyr). With the low end of the rate and F ranges the 2.33 Gyr limit at 1 pc is 2.6e-4.
Robustness checks
- Sample radius 15–100 pc: raw rate 10.2–10.7 Myr⁻¹. The (4/π)⟨v_T⟩ identity holds on clean-RV stars: 48.49 ± 0.21 (3D) versus 48.29 ± 0.23 km/s.
- Census with |t| < 0.5 and 1.5 Myr, RUWE < 1.4, or v < 150 km/s: ratios at 5–10 pc stay within 0.93–1.01. The lower bound falls from 8.6 to 6.9 as the window widens to 1 Myr, as expected when distant stars lack RVs.
- Simulator: 1127 contacts versus 1147 expected analytically (0.98 ± 0.03). Doubling times are unchanged with a five-fold finer time step (193 vs 194, 66 vs 67, 40 vs 40 kyr; 640 vs 629 at 1 pc).
- Capped front at 3 pc: 90.9, 87.9–92.6 and 90.8 km/s for slab widths 8, 16 and 32 pc; the two sides of a run differ by a median 9%.
- Fronts slow with f: 71 km/s at f = 0.3 and 54 km/s at f = 0.1 (3 pc hops); at f = 0.03 no front forms within 1 kpc.
- The eigenvalue λ from a half-size velocity sample differs by 3% at 30 km/s, 6% at 10 km/s and 27% at 5 km/s.
- Orbit factor F = 0.68–0.85 across eighteen potential and disc variants.
Limitations
- Every system is assumed settleable in the main grid; results for f < 1 are kinetic, with four cube and three slab checks.
- The lead rule charges the ship 30 km/s to cruise and up to 30 km/s to stop, a budget of up to 60 km/s. Results at limits of 5–10 km/s rest on few slow pairs and are uncertain by tens of percent.
- The simulation is a local periodic box: uniform positions, straight-line motion, velocities from within 50 pc, no Galactic orbits, shear, density gradient or halo depletion. Galaxy times are extrapolations good to a factor of about two; the any-speed front is not converged.
- Doubling times and fronts are seeded on slow disc stars; stalled origins are quantified separately, not folded into the averages.
- Linear motion limits the census to about ±1 Myr. The Gyr exposure rests on the assumed F range, not on data.
- The missing-system correction is a judgment; the ±1.0 covers the variants I tried, not other definitions of "system". The lower bound counts Gaia sources, so a wide pair with two clean RVs counts twice.
- x assumes independent hosts, constant x, and that a persistent presence would be evident. The Solar System has not been searched for small or dormant artefacts, and visits that leave nothing are unconstrained.
- Zuckerman (1985) could not be retrieved and is cited only through later papers.
Closest prior work and what is new
Encounter rates: García-Sánchez et al. (2001, A&A 379, 634), Martínez-Barbosa et al. (2017, MNRAS 464, 2290), Bailer-Jones et al. (2018, A&A 616, A37), Bailer-Jones (2022, ApJL 935, L9), Fernandez-Puig et al. (2026, A&A 710, A252). Exposure argument: Zuckerman (2026, ApJ 1001, 167) already used n V R² T with V = 48 km/s to find about 2 million old solar-type stars within 100 light-years in 2 Gyr and drew the Fermi inference from the absence of probes. Settlement with stellar motion: Carroll-Nellenback et al. (2019, AJ 158, 117; Maxwellian velocities, no rendezvous cost, front about 100 km/s, crossing at most about 0.3 Gyr), Wright et al. (2021, RNAAS 5, 141; galaxy-scale runs with about 10 km/s ships and about 3 pc range), Hansen & Zuckerman (2021, AJ 161, 145), Nicholson & Forgan (2013, IJA 12, 337), Cartin (2014, JBIS 67, 119; static percolation).
Not new: a rate near 11 Myr⁻¹ and its d² scaling; that the 2018 rate is too high (Fernandez-Puig et al. 2026); the exposure argument (Zuckerman 2026); a sub-Gyr crossing set by stellar motions (Carroll-Nellenback et al. 2019), which the capped result reproduces.
New, to my knowledge: (i) an RV-free Gaia rate at about 9% precision, against 42% in Fernandez-Puig et al., with a model-free lower bound; (ii) the measured kinematic bias of Gaia RV availability; (iii) the extension of Zuckerman's argument to all systems and to limits on x as a function of hop distance, persistence and passing speed; (iv) settlement runs with the empirical Gaia velocity distribution and a rendezvous limit, including its dependence on the limit, on direction and on f, and the stalled-origin fraction; (v) the percolation threshold of the complete Gaia field, indistinguishable from random.
Implications for the Fermi Paradox
Proximity is not scarce. A star system passes within 1 pc every 90 kyr; 4,000–6,000 did so while Earth showed vegetation and high oxygen, and about 21,000 since the atmosphere became oxygenated. If 1 in 1,400 passing systems (1 in 7,000 for the longer era) had hosted a civilisation that crosses 1 pc and leaves a lasting, evident presence, an untouched Solar System would be a 5% outcome. The limit collapses for presences that fade within about a Myr (x < 0.27), for hops under 0.1 pc, if only slow passers are reachable, and wherever artefacts could go unnoticed. The data bound willingness and persistence, not existence, and they are conservative: a spreading settlement would add visitors that never passed as their own star.
Short-hop settlement is not slow, with conditions. Ships that cruise at 30 km/s and can stop only at stars passing slower than that double their settled population every 0.06–2.9 Myr even with Myr pauses, and spread at the pace of stellar mixing, crossing the Galaxy in 0.2–0.5 Gyr, far below its age. That fails if hops are about 1 pc or shorter and only a few percent of systems are settleable (0.7–2.8 Gyr of growth at f = 0.03), if ships can change velocity by only about 5 km/s (3.6 Gyr at 1 pc), or if civilisations wait for passages inside about 0.15 pc. Outside those corners, one expansionist origin in the disc would have reached us, which is a stronger statement than the per-system limit on x. The radio era adds nothing: no star has passed since we began transmitting.
Figures
Response to referee
- Lead with the capped rule. Done in the summary, tables, figures and implications. Any-speed numbers are labelled as an upper bound for ships that match any passing star. "Roughly 0.1 Gyr" is replaced by 0.2–0.5 Gyr; the range is wider than the suggested 0.25–0.4 because it spans all hops, delays and three directions.
- Capped grid incomplete. All 20 cells (5 hops × 4 delays) are now simulated with the cap, three cubes and one slab each. The "under 2.5 Myr" sentence is replaced by the simulated range, 0.06–2.9 Myr.
- f = 1 unstated. Stated; kinetic tables and seven simulated checks for f < 1 added; the "one origin would have reached us" claim is now conditional on hop length, f and velocity budget.
- Rate uncertainty and brown dwarfs. Now 11.1 ± 1.0, defined as the half-range of six variants. The brown-dwarf sentence is corrected. I count 22 systems with a brown-dwarf brightest member where the referee counted 19; the difference is the classification of the brightest member and does not affect the rate.
- "Confirms". Reworded to a consistency check on the clean-RV 65%; the model-free bound of at least 8.6 ± 0.8 is computed in the pipeline and reproduces the referee's value.
- Missing citations and novelty. Zuckerman 2026, Wright et al. 2021, Martínez-Barbosa et al. 2017 cited; the 2018 discrepancy is credited to Fernandez-Puig et al.; the exposure argument is presented as an extension of Zuckerman; the capped crossing as a reproduction of Carroll-Nellenback et al.
- Direction and slab width. Capped fronts are measured along U, V and W for 2, 3 and 5 pc hops, and the slab-width test is run for the cap. For the any-speed rule only U fronts pass the wrap-around filter; single-side values along V and W are given.
- F for short persistence. F = 1 for 10 Myr or less; limits at 1 pc are now 0.27 and 0.027.
- Stalled seeds. Seeds reaching 1000 systems are reported for every cell; random-origin runs and the analytic first-hop waiting time quantify stalling.
- Shorter eras. The 0.47 and 0.67 Gyr counts and limits stand beside the 2.33 Gyr ones in the summary and implications, with the detectability caveat.
- Wording and velocity sample. "Floor" is replaced by "conservative"; the S/N ≥ 5 cut is applied to the simulation velocity sample (23,243 stars, 80 faster than 200 km/s).
Further changes prompted by the review: launchers now activate within a time step rather than at the next one, which removed a bias of up to 20% in dense cells (2 pc capped: 192 kyr, against 233 before and the referee's 185); the dependence on the rendezvous limit, a 10 km/s ship test, and the epicycle and shear estimates were added.
Key numbers
| Quantity | Value | Uncertainty | Note |
|---|---|---|---|
| Encounter rate of star systems within 1 pc of the Sun, Gamma(1 pc) | 11.1 per Myr (one per 90 kyr) | +- 1.0 (half-range of six stellar-system variants, 9.9-11.9; internal error 0.54) | RV-free estimator 4 d^2 sum(v_T)/V on 35,958 GCNS systems within 50 pc, times 1.045 +- 0.045 for missing systems. Raw flux sum 10.61 +- 0.07. 10 pc sample alone with its own 3D speeds: 10.75 +- 0.82. Other definitions: 12.5 with brown-dwarf primaries, 13.7 counting every stellar object. Scales as d^2. |
| Model-free lower bound on Gamma(1 pc) from raw clean-RV Gaia DR3 counts | >= 8.6 per Myr | +- 0.8 (Poisson, N = 108) | Sources with linear perihelion < 5 pc and |t| < 0.25 Myr, divided by 2 T d^2; no completeness or isotropy model. Reproduces the referee's value. 0.44 of Bailer-Jones et al. 2018. |
| Ratio of adopted rate to Bailer-Jones et al. 2018 (19.7 +- 2.2 per Myr) | 0.56 | about +- 0.08 from the two quoted errors | Agrees with Garcia-Sanchez et al. 2001 (11.7 +- 1.3), Martinez-Barbosa et al. 2017 (10.4, no migration) and Fernandez-Puig et al. 2026 (10.6 +- 4.5), who already attribute the 2018 excess mainly to spurious parallaxes. |
| Local density of star systems | 0.0718 pc^-3 | +- 0.0034 | GCNS raw within 50 pc 0.0687 +- 0.0004; 10 pc sample stellar systems 0.0640 +- 0.0039 (91.8% of them in GCNS). 23 of 309 GCNS sources within 10 pc are brown dwarfs; 22 of 267 GCNS systems there have a brown-dwarf brightest member. |
| Mean speed of systems relative to the Sun | 48.1 km/s | +- 0.6 | (4/pi)<v_T>; identity checked on 23,243 clean-RV stars (48.49 +- 0.21 3D vs 48.29 +- 0.23). Stars without a clean Gaia RV are colder: 42.2 +- 0.6 vs 48.4 km/s at 4 <= M_G < 12. |
| Direct census, d < 10 pc, |t| < 1 Myr, now < 100 pc (133,876 clean-RV systems) | 1300 observed vs 1313.9 expected (ratio 0.99) | 0.96-1.02 (68% Poisson) | Consistency check on the 65% of the encounter flux with clean RVs, not an independent rate. d < 5 pc: 310 vs 332.6; d < 1 pc: 9 vs 13.1; d < 0.5 pc: 0 vs 3.3 (P = 0.04). Differential chi-square 5.7 for 7 bins. N(<d) ~ d^(2.04 +- 0.06). |
| Systems passing within 1 pc since the Great Oxidation Event (2.33 Gyr) | 2.1e4 | 1.1e4 - 5.9e4 | Orbit-averaged rate factor F = 0.81; range combines rate error, era length 2.22-2.43 Gyr and an assumed F of 0.5-2.0. Within 10 pc: 2.1e6 (1.1e6-5.9e6). Remote detectability of mid-Proterozoic oxygen is contested, so this is the generous case. |
| Systems passing within 1 pc since high O2/O3 (0.67 Gyr) and since land vegetation (0.47 Gyr) | 6.0e3 and 4.1e3 | 3.3e3-1.3e4 and 2.6e3-8.0e3 | F = 0.80 and 0.79, assumed F range 0.6-1.3. Within 10 pc: 6.0e5 and 4.1e5. |
| Radio era (100 yr): systems inside d today | 2 (2 pc), 46 (5 pc), 268 (10 pc) | 0.001 new passages within 1 pc expected in 100 yr; about 8,660 systems inside the 100 light-year radio sphere. | |
| 95% upper limit on x, hop 1 pc, presence persisting 2.33 Gyr | 1.4e-4 | 2.6e-4 with the low end of rate and F; 1.2e-3 if only passers slower than 30 km/s count; 0.052 if slower than 10 km/s | x = fraction of passing systems hosting a civilisation that crosses d and leaves a persistent, evident presence. 0.1 pc: 0.014; 10 pc: 1.4e-6. |
| 95% upper limit on x, hop 1 pc, shorter persistence | 0.27 (1 Myr); 0.027 (10 Myr); 3.6e-3 (100 Myr); 7.2e-4 (470 Myr); 5.0e-4 (670 Myr) | F = 1 for persistence of 10 Myr or less. Passers slower than 30 km/s only: 6.0e-3 at 470 Myr. | |
| Settlement doubling time T2, 30 km/s ships, rendezvous limit 30 km/s (lead rule), f = 1 | 64-2872 kyr over 5 hops x 4 delays | 3 realisations per cell, min-max spread typically 5-10%; kinetic theory within 15% in 17 of 20 cells (worst 25%) | d_hop 0.5/1/2/3/5 pc: 2293/567/192/114/64 kyr with no delay; 2872/1079/500/394/292 kyr with a 1 Myr delay. All 60 slow-star seeds reached 1000 systems. Only 5.3% of pair-encounter flux is slower than 30 km/s. |
| Settlement front speed with the 30 km/s rendezvous limit | 48-108 km/s | along U 55-108 (median 83, 19 runs); along V 59-74; along W 48-66 | Rises with hop length (1 pc: 55-62; 5 pc: 83-108 along U). No front within 1 kpc at 0.5 pc (growth-limited). Slab widths 8/16/32 pc at 3 pc: 90.9 / 87.9-92.6 / 90.8 km/s. |
| Galaxy crossing time (23.2 kpc / front speed), rendezvous limit 30 km/s, hops >= 1 pc, f = 1 | 0.21-0.47 Gyr (0.28 Gyr for the median radial front) | factor of about two; a rough epicycle estimate gives 0.43 Gyr | Local-box extrapolation; epicycles, shear and density gradient not simulated. Reproduces the at most ~0.3 Gyr of Carroll-Nellenback et al. 2019. Growth to 1e11 systems takes only 2-105 Myr at f = 1. |
| Upper-bound rule (ships match any passing star's velocity): doubling time and front | T2 = 33-578 kyr; front 183-245 km/s along U; crossing 0.09-0.12 Gyr | front not converged: carried by halo stars, rises with slab width, strongly anisotropic (single sides 170 km/s along W, 475 km/s toward negative V) | Requires velocity changes of tens to hundreds of km/s; not a result for 30 km/s ships. |
| Growth time to 1e11 systems versus settleable fraction f (30 km/s limit, no delay, kinetic) | 1 pc hops: 22 Myr (f = 1), 211 Myr (0.1), 700 Myr (0.03); 0.5 pc hops: 84 Myr, 839 Myr, 2.8 Gyr | simulated checks at f = 0.3, 0.1, 0.03 agree within 7% | Scales as 1/f in the dilute regime. Fronts at 3 pc hops slow to 71 km/s (f = 0.3) and 54 km/s (f = 0.1); at f = 0.03 no front forms within 1 kpc. |
| Growth time to 1e11 systems at 1 pc hops versus the velocity change a ship can make (f = 1, no delay, kinetic) | 3.6 Gyr (5 km/s), 0.50 Gyr (10), 146 Myr (15), 65 Myr (20), 22 Myr (30), 7.2 Myr (50), 2.3 Myr (no limit) | eigenvalue from a half-size velocity sample differs by 27% at 5 km/s, 6% at 10 km/s, 3% at 30 km/s | Simulated 10 km/s ships with a 10 km/s limit: T2 = 0.89 Myr (5 pc) and 1.74 Myr (3 pc) vs 0.83 and 1.72 predicted. |
| Origins that stall under the 30 km/s limit, 1 pc hops | 13% wait > 10 Myr for a first reachable star, 2.5% > 100 Myr, 0.8% > 1 Gyr (median wait 1.2 Myr) | simulation: 20 of 24 random origins reach 1000 systems within 30 Myr, 22 of 24 within 100 Myr | Stalled origins move at a median 105 km/s versus 32 km/s for those that start. At 2 pc all 24 start. Main-grid seeds sit on slow disc stars. |
| Shortest hop that still reaches 1e11 systems within 1 Gyr (f = 1, no delay) | 0.145 pc (29,900 au) with the 30 km/s limit; 0.040 pc (8,200 au) at any speed | Growth-limited regime at local density. Hops of 1500 au need 400 Gyr (30 Gyr at any speed). | |
| Static percolation threshold of the real GCNS star field | 2.20 pc | random field of same density 2.19 pc; infinite-field threshold 2.09 pc | Hop length at which half of the 18,252 systems within 40 pc join one cluster. |
| Expected passages within 1500 au of the Sun | 0.59 per Gyr | Consistent with Hansen & Zuckerman 2021 (about one per Gyr). | |
| Simulator validation: contacts found vs analytic expectation | 1127 vs 1147.2 (0.982) | +- 0.029 | Doubling times unchanged with a five-fold finer time step (193 vs 194, 66 vs 67, 40 vs 40 kyr; 640 vs 629 at 1 pc). |
Changes made after the referee report
- Settlement now leads with the 30 km/s rendezvous-capped rule in the headline, key numbers, tables, figures and implications; any-speed results are labelled an upper bound for ships that can match any passing star's velocity. Galaxy crossing changed from 'roughly 0.1 Gyr' to 0.2-0.5 Gyr (0.28 Gyr median radial front).
- Completed the capped grid by simulation: all 20 cells (5 hops x 4 delays, including 1e4 and 1e6 yr), three cubes and one slab each; replaced the 'under 2.5 Myr' sentence by the simulated range 0.06-2.9 Myr.
- Stated f = 1; added kinetic tables of doubling and growth time versus settleable fraction f (1 to 0.01) and seven simulated checks at f < 1; made the 'one expansionist origin would have reached us' claim conditional on hop length, f and velocity budget.
- Rate uncertainty widened from +- 0.5 to +- 1.0 (half-range of six stellar-system variants, written to data/rate_variants.csv); added the 10 pc sample with its own 3D speeds (10.75 +- 0.82); corrected the brown-dwarf statement (Gaia-visible brown dwarfs are included; counts reported).
- Census reworded from 'confirms' to a consistency check on the 65% of flux with clean RVs; added a model-free lower bound (>= 8.6 +- 0.8 per Myr, data/rate_lower_bound.csv) and a differential chi-square.
- Cited Zuckerman 2026, Wright et al. 2021, Martinez-Barbosa et al. 2017 and Reinhard et al. 2017; novelty list revised: x limits are an extension of Zuckerman 2026, the Bailer-Jones 2018 discrepancy is credited to Fernandez-Puig et al. 2026, the capped crossing time is a reproduction of Carroll-Nellenback et al. 2019.
- Front speeds measured along Galactic U, V and W (capped: 2, 3, 5 pc hops), slab-width test (8/16/32 pc) run for the capped rule, second realisation added; a wrap-around validity filter added to the front measurement.
- F(T) now evaluated over the window actually used and set to 1 for persistence of 10 Myr or less (x < 0.27 and 0.027 at 1 pc for 1 and 10 Myr); x tables added for passers slower than 30 and 10 km/s and for 670 Myr.
- Stalled seeds are counted instead of averaged away: seeds reaching 1000 systems reported per cell; 48 random-origin runs and the analytic first-hop waiting-time distribution quantify origins that stall under the cap.
- The 0.47 and 0.67 Gyr exposure counts and x limits are given beside the 2.33 Gyr ones in the headline and implications, with the caveat that mid-Proterozoic detectability is contested.
- 'Floor' reworded to 'conservative'; the S/N >= 5 radial-velocity cut is applied to the simulation velocity sample (23,243 stars, 80 faster than 200 km/s).
- Simulator fixed and sped up: launchers activate within a time step (removing a bias of up to about 20% in dense cells; capped 2 pc now 192 kyr against 233 before and the referee's 185), time-step rule for hops of 2 pc or more, time-step convergence table, frontier pruning; velocity components can be permuted to lay the slab along any axis.
- New analyses beyond the referee's list: growth versus the rendezvous velocity limit (5-100 km/s) with a simulated 10 km/s ship check, back-of-envelope epicycle and shear estimates for the Galaxy extrapolation, new figure fig5_capability.png, fig2 and fig4 redrawn around the capped rule.
Referee points not accepted
- Suggested wording 'about 0.25-0.4 Gyr for hops of 1 pc or more': I report 0.21-0.47 Gyr (about 0.2-0.5), because my runs span all hops, delays and three directions (fronts 48-108 km/s); the referee's range lies inside mine.
- Suggested wording '0.08-2.5 Myr simulated for delays up to 0.1 Myr; under 3 Myr (mean-field) with a 1 Myr delay': superseded by the fully simulated grid (0.06-2.9 Myr); the lower end moved from 81 to 64 kyr because the simulator's time-step bias was fixed.
- Brown-dwarf count: the referee states 19 of 267 GCNS systems within 10 pc have a brown-dwarf primary; my pipeline finds 22 with a brown-dwarf brightest member. I report my count; the difference is classification and does not affect the rate.
- Rate quoted as 11.1 +- 1.0 with the 9.9-11.9 stellar-system range, rather than folding in the 12.5 value: 12.5 includes brown-dwarf primaries of the 10 pc sample and is reported as a different definition, not as part of the uncertainty.
- Any-speed front along W: the referee quotes 127 km/s (two-sided mean). My run gives the same two-sided mean from the arrival times (126 km/s), but the slow side fails my wrap-around filter, so I quote only the valid side (170 km/s) and state that any-speed fronts are given for the radial direction.
Code
Every number above is produced by these scripts from public data. The data tables themselves are not hosted here; the scripts download them.
common.py download_data.py run_all.py s1_density_kinematics.py s2_census.py s3_exposure.py s4_settlement.py s5_figures.py s6_summary.py settle_sim.py
Referee report
A second, separate analysis re-ran the code, recomputed the main numbers by its own route and tried to break the result. Like the first, it was run by Claude for this project; it is not an outside expert. In its report “the analyst” is the first analysis, which wrote the paper, and file names that are not linked on this page are its own working files. The paper above is the version revised in response.
Verdict: sound with fixes. Results reproduced: yes.
Full rerun of code/run_all.py from a scratch copy (12.4 min, cached raw data): data/report_tables.md is byte-identical to the analyst's and every value in results.json agrees. Live archive row counts match the cache (GCNS 331,312; 10 pc sample 562; Gaia DR3 RV sources with parallax > 20 mas 27,723). Independent recomputation with my own scripts (no analyst code): (a) 10 pc sample only, 268 stellar systems x their own mean 3D speed 52.3 +- 2.4 km/s from literature RVs: Gamma(1 pc) = 10.75 +- 0.82 per Myr; (b) GCNS < 50 pc with table-3-only merging by my own union-find: 10.93; all GCNS sources: 11.76; (c) Gaia DR3 gaia_source directly with my own quality cuts (40,424 sources, one aggregate ADQL query): 11.71 per Myr for objects; (d) model-free lower bound from raw clean-RV encounters in all of Gaia DR3, d < 5 pc and |t| < 0.25 Myr (108 observed, 109 expected): >= 8.6 +- 0.8 per Myr scaled to 1 pc, with clean-RV sources carrying 69% of the flux in that window, so 19.7 per Myr would need 44% completeness; (e) source-level census recount with DR3 astrometry: 9 within 1 pc and 0 within 0.5 pc in +-1 Myr, Monte-Carlo isotropic prediction 14.4 and 1438 vs 1429 observed within 10 pc; (f) own brute-force settlement simulation: T2 = 71 kyr (1 pc, any speed, no delay; analyst 68), 357 kyr (1 Myr delay; analyst 362), 193 kyr (0.5 pc; analyst 185), 185 kyr (2 pc with 30 km/s cap, two runs; analyst 233); mean-field by hand 65 kyr at 1 pc. Exposure and x-limit arithmetic checked by hand. Not independently rebuilt: static percolation and the orbit integration (both reproduce in the rerun and pass plausibility checks).
Strongest objection
The study asks how little travel capability is needed, then headlines doubling times of 35-600 kyr and a ~0.1 Gyr Galaxy crossing from a rule in which a 30 km/s ship 'settles' stars that pass at a median 56 km/s and, at the front, at more than 200 km/s (halo stars). Those are flybys; stopping needs a velocity change equal to the relative speed. The conclusion survives in weakened form: under the 30 km/s rendezvous cap growth is still fast (T2 of 0.08-2.3 Myr with no delay; 0.5-2.9 Myr with a 1 Myr delay by mean-field), the front moves at 53-94 km/s depending on direction, and the crossing time is 0.24-0.42 Gyr, which matches Carroll-Nellenback et al. 2019 and is far below the age of the disc. It stops being fast only if the settleable fraction is a few percent or less and hops are about 1 pc or shorter (about 0.7 Gyr of growth at 1 pc, 2.7 Gyr at 0.5 pc for f = 0.03). The 0.1 Gyr and 35-600 kyr figures do not survive as statements about 30 km/s ships. The encounter rate, exposure counts and x limits are unaffected by this objection.
Errors found
- major. The headline settlement numbers (doubling
every 35-600 kyr with delays up to 1 Myr; Galaxy crossing ~0.1 Gyr;
front 229 km/s) come from the 'any relative speed' rule, under which a
30 km/s ship settles stars passing at any speed. That is a flyby unless
the ship can shed the full relative velocity, so these are not results
for 30 km/s ships and contradict the study's premise of minimal travel
capability. The self-consistent capped results are thinner: delays of
10^4 and 10^6 yr were not run with the cap (the study plan asked for all
four), no front exists for 0.5 pc and only one run for 1 pc.
- Evidence: Analyst's own deltav_flux_fractions.csv: only 5.3% of pair-encounter flux is below 30 km/s, median relative speed 56 km/s; the front is carried by the fastest 0.1% (halo). settlement_runs.csv has capped rows only for t_delay 0 and 0.1 Myr. The implications sentence pairs 'Myr pauses' with 'under 2.5 Myr with a 30 km/s rendezvous cap', but meanfield_growth.csv gives T2 = 2.9 Myr at 0.5 pc with a 1 Myr delay.
- Fix: Lead with the capped rule in headline, the table of key numbers and implications. Label any-speed numbers as an upper bound assuming ships can match any passing star's velocity. Replace 'roughly 0.1 Gyr' by 'about 0.25-0.4 Gyr for hops >= 1 pc'. Run the cap for delays 1e4 and 1e6 yr or quote mean-field values labelled as such; correct the 2.5 Myr sentence to 'under 3 Myr (mean-field) with a 1 Myr delay'.
- major. Novelty is overstated because four pieces of
prior work are not cited. Zuckerman 2026 already published the part-5
argument; Fernandez-Puig et al. 2026 already argue the Bailer-Jones 2018
rate is too high and offer a diagnosis; Wright et al. 2021 ran
galaxy-scale settlement with Voyager-class ships and Galactic shear;
Martinez-Barbosa et al. 2017 computed the encounter rate along migrating
solar orbits, which is direct support for the F range the report
presents as pure assumption.
- Evidence: Zuckerman 2026, ApJ 1001, 167 (arXiv:2603.07333) sec. 7, read in full text: n V R^2 T with V = 48 km/s and T = 2 Gyr since oxygenation gives ~2 million old single solar-type stars within 100 lt-yr, and absence of probes implies none hosted a communicative civilisation. Fernandez-Puig et al. 2026 (arXiv:2605.16496) full text: 'We therefore attribute the higher rate reported by Bailer-Jones et al. (2018) mainly to ... imperfect filtering of spurious parallaxes'. Wright, Carroll-Nellenback, Frank & Scharf 2021 RNAAS doi:10.3847/2515-5172/ac0910: 10 km/s ships, 3 pc range, 0.1 Myr launch interval (parameters verified only via a secondary source). Martinez-Barbosa et al. 2017 (arXiv:1609.09099 abstract): 21, 39, 63 per Myr within 4e5 au for three migration scenarios, i.e. 10.4 per Myr within 1 pc without migration and a 0.54-1.6 spread.
- Fix: Cite all four. Recast claim (iii) as an extension of Zuckerman 2026 to all systems and to the dependence on d, persistence and relative speed. Drop 'disfavours about 20 per Myr' as a new finding and credit Fernandez-Puig et al.; the new part is precision and the RV-free estimator. Present the capped ~0.3 Gyr crossing as a reproduction of Carroll-Nellenback et al. 2019 with empirical velocities. Use Martinez-Barbosa et al. to support the F range.
- major.
- Evidence: ls of shows only code/, data/, figures/.
- Fix: Save the report at the stated path with the corrections in this review.
- minor. Every star is treated as a valid target and
future launcher (settleable fraction f = 1), and this is not stated.
Growth rate scales with f in the dilute regime, so the claim that one
expansionist origin anywhere would have reached us is conditional.
- Evidence: From the analyst's kinetic rates: with the cap and f = 0.03, T2 at 1 pc is ~19 Myr and 36.5 doublings take ~0.7 Gyr; at 0.5 pc ~2.7 Gyr.
- Fix: State f = 1, give T2 proportional to 1/f with the f = 0.03 example, and condition the implication on hop >= 1 pc and f above a few percent.
- minor. The +-0.5 on the rate is optimistic and the
definition of 'systems' is misdescribed. The adopted density lies above
every measured system density in the analyst's own Fig. 1 and 11% above
the complete 10 pc value. The limitation 'brown-dwarf systems are
excluded' is inaccurate.
- Evidence: My independent values: 10.75 +- 0.82 (10 pc sample, own 3D speeds) and 10.93 (table-3 merging). All 309 GCNS sources within 10 pc match the 10 pc sample; 23 are brown dwarfs and 19 of the 267 GCNS systems there have a brown-dwarf primary (1-2% effect at 50 pc).
- Fix: Quote 11 +- 1 per Myr, or keep 11.1 +- 0.5 labelled as statistical plus one judgment with the 9.9-12.5 range in the same line. Correct the brown-dwarf sentence.
- minor. 'Confirms' overstates the census. The
prediction uses the same stars' speed distribution and the same isotropy
assumption as the rate estimator, so agreement is an internal
consistency check on the 65% of the flux with clean RVs, not an
independent measurement of the total rate.
- Evidence: s2_census.py: N_pred is computed for exactly the clean-RV stars from the RV-sample speeds; the 0.65 completeness is a ratio of two such predictions.
- Fix: Say 'is consistent with' and add a model-free statement such as the raw lower bound (>= 8.6 +- 0.8 per Myr from clean-RV counts in +-0.25 Myr).
- minor. Front speeds were measured along one axis
only (Galactic U, the hottest), and slab-width convergence was tested
only for the any-speed rule.
- Evidence: My runs with the analyst's simulator: capped, 3 pc hop: 82.5/85.3/85.9/93.7 km/s for slab widths 8/16/16/32 pc along U, 63 km/s along V, 53 km/s along W. Any speed, 1 pc: 277 km/s along V, 127 km/s along W. Crossing time becomes 0.24-0.42 Gyr.
- Fix: Report the direction dependence or state the values are for the radial direction; add the slab-width test for the capped rule.
- minor. The orbit-averaged factor F = 0.81 is
applied to short persistence times, where the present-day rate (F = 1)
applies.
- Evidence: s3_exposure.py: n = gam * d**2 * L * F0 for all L. At 1 pc the 1 Myr limit should be 3.0/11.09 = 0.27, not 0.33; the 10 Myr limit 0.027, not 0.033. The error is conservative.
- Fix: Use F = 1 for L <= 10 Myr.
- minor. Runs in which the seed never makes a first
hop are hidden by np.nanmean, so 'spread typically under 10%' describes
only the runs that started.
- Evidence: In my capped reruns, 1 of 4 seeds at 1 pc and at 2 pc failed to reach 1000 systems within 80 Myr; one capped slab run was unusable for the same reason.
- Fix: Report the fraction of stalled seeds and note that a fast-moving origin star has few partners below 30 km/s.
- minor. The velocity sample feeding the simulations
requires only RV error < 5 km/s, not the S/N >= 5 cut used for the
census.
- Evidence: Stars with rv_expected_sig_to_noise < 5 are 0.9% of the sample but 3.5% of the weight, and 4 of the 84 stars above 200 km/s. The halo tail otherwise looks real (V from -200 to -510 km/s with good S/N).
- Fix: Apply the same clean cut or state that the effect was checked and is small.
- minor. The exposure headline uses only the 2.33 Gyr
era since the Great Oxidation; whether mid-Proterozoic oxygen was
remotely detectable is contested, and the later eras change the count
and the x limit by a factor of 4-5.
- Evidence: Analyst's own table: 6.0e3 and 4.2e3 systems within 1 pc for 0.67 and 0.47 Gyr; x < 7.1e-4 for 470 Myr.
- Fix: Give the 0.47-0.67 Gyr numbers alongside the 2.33 Gyr one in the headline.
- minor. Wording: 'the per-system limits on x are a
floor' reads backwards.
- Fix: Say the limits are conservative (the true constraint is at least this strong).
Overclaims
- 'Short-hop settlement (0.5-5 pc hops, 30 km/s ships, delays up to 1 Myr) doubles every 35-600 kyr' and 'Galaxy-filling time ... roughly 0.1 Gyr': both require ships able to match relative speeds of tens to hundreds of km/s, not 30 km/s ships.
- 'With 30 km/s ships and Myr pauses the settled population doubles in under 0.6 Myr (under 2.5 Myr with a 30 km/s rendezvous cap)': the cap was never run with a 1 Myr delay; the analyst's own mean-field value is 2.9 Myr at 0.5 pc.
- 'A parameter-free census of 133,876 clean-RV systems confirms it': the census is an internal consistency check on the RV subsample and shares the isotropy assumption; it does not independently measure the total rate.
- '11.1 +- 0.5': the uncertainty does not cover the analyst's own 10 pc variant (9.9 +- 0.6) or the definitional range 9.9-12.5.
- 'New, to my knowledge: ... era-by-era counts of systems that passed Earth while its biosphere was detectable, and the resulting x limits': the argument and a 2-million-star count for 2 Gyr were published by Zuckerman 2026.
- 'New: ... a parameter-free census test that disfavours about 20 per Myr': Fernandez-Puig et al. 2026 already report ~10.6 per Myr and argue the 2018 value is inflated; also 'the discrepancy is measured, not diagnosed' ignores their diagnosis.
- 'One expansionist origin anywhere in the disc would therefore have reached us': true only for f near 1 or hops of 1 pc and more; with f = 0.03 and the cap, growth alone takes 0.7-2.7 Gyr for 1-0.5 pc hops.
- 'Only civilisations that wait for passages inside about 0.04-0.14 pc fail to spread within a Gyr': a growth-only, f = 1, zero-delay statement at local density.
- 'About 21,000 systems passed within 1 pc ... while Earth's atmosphere advertised life': uses the full 2.33 Gyr since the Great Oxidation as the detectable era; the less contested eras give 4,200-6,000.
Novelty check
Novel: partly. The rate near 11 per Myr, the d^2 scaling, the too-high Bailer-Jones 2018 value, the exposure-count argument for a Fermi limit, and a sub-Gyr Galaxy crossing set by stellar motions are all in the literature. What stands as new, to my knowledge: an RV-free Gaia estimate of the rate at about 10% precision (against 42% in Fernandez-Puig et al.); the measured kinematic bias of Gaia RV availability, which holds within individual magnitude bins; x limits as a function of hop distance, persistence time and relative speed; settlement runs with the empirical Gaia velocity distribution and a rendezvous velocity cap (Carroll-Nellenback et al. include no velocity-matching cost); and the percolation threshold of the complete Gaia field. The capped ~0.3 Gyr crossing time reproduces the Carroll-Nellenback et al. upper limit and should be reported as such. All citations the analyst did give that I checked are accurate (Fernandez-Puig 2026, Garcia-Sanchez 2001, Bailer-Jones 2018 and 2022, Carroll-Nellenback 2019, Hansen & Zuckerman 2021, Cartin 2014).
- Zuckerman 2026, ApJ 1001, 167 (arXiv:2603.07333): ~2 million old single solar-type stars passed within 100 lt-yr in 2 Gyr since oxygenation (V = 48 km/s); absence of probes used as a limit. Not cited by the analyst.
- Fernandez-Puig et al. 2026, A&A 710, A252 (arXiv:2605.16496): 10.6 +- 4.5 per Myr within 1 pc; attributes the higher Bailer-Jones 2018 rate mainly to spurious parallaxes. Cited for the number only.
- Garcia-Sanchez et al. 2001, A&A 379, 634: 11.7 +- 1.3 per Myr
from an n
estimate. - Bailer-Jones et al. 2018, A&A 616, A37: 19.7 +- 2.2 per Myr after completeness correction.
- Martinez-Barbosa et al. 2017, MNRAS 464, 2290 (arXiv:1609.09099): 21, 39, 63 encounters per Myr within 1.94 pc for three solar migration scenarios. Not cited.
- Carroll-Nellenback et al. 2019, AJ 158, 117: Maxwellian stellar motions, front ~100 km/s, Galaxy crossing <= 300 Myr, no rendezvous cost.
- Wright, Carroll-Nellenback, Frank & Scharf 2021, RNAAS, doi:10.3847/2515-5172/ac0910: galaxy-scale settlement with 10 km/s ships, 3 pc range and Galactic shear (parameters verified via a secondary source only). Not cited.
- Hansen & Zuckerman 2021, AJ 161, 145: a stellar passage within ~1500 au per Gyr.
- Cartin 2014, JBIS 67, 119: static percolation of 5,481 SIMBAD systems within 40 pc.
Required changes
- Lead with the 30 km/s rendezvous-capped results in the headline, the table of key numbers and implications; label any-speed numbers as an upper bound that assumes ships can match any passing star's velocity; replace 'roughly 0.1 Gyr' with 'about 0.25-0.4 Gyr for hops of 1 pc or more'.
- Complete the capped grid for delays of 1e4 and 1e6 yr (or quote mean-field values labelled as such) and correct 'under 2.5 Myr with a 30 km/s rendezvous cap' to 'under 3 Myr (mean-field) with a 1 Myr delay; 0.08-2.5 Myr simulated for delays up to 0.1 Myr'.
- State that every system is assumed settleable (f = 1), give T2 proportional to 1/f with the f = 0.03 example, and condition 'one expansionist origin anywhere in the disc would have reached us' on hop >= 1 pc and f above a few percent.
- Quote the rate as 11 +- 1 per Myr, or keep 11.1 +- 0.5 explicitly labelled as statistical plus one judgment with the 9.9-12.5 definitional range in the same line; correct the limitation 'brown-dwarf systems are excluded' (Gaia-visible brown-dwarf primaries are included; 19 of 267 GCNS systems within 10 pc).
- Change 'a parameter-free census ... confirms it' to 'is consistent with it (a check on the 65% of the flux with clean RVs)', and add a model-free bound such as >= 8.6 +- 0.8 per Myr from raw clean-RV counts.
- Cite Zuckerman 2026 (ApJ 1001, 167), Wright et al. 2021 (RNAAS) and Martinez-Barbosa et al. 2017 (MNRAS 464, 2290); revise the novelty list so that the exposure/x-limit argument is an extension of Zuckerman 2026, the Bailer-Jones 2018 discrepancy is credited to Fernandez-Puig et al. 2026, and the capped crossing time is a reproduction of Carroll-Nellenback et al. 2019.
- Report the direction dependence of the front speed (capped: 85 km/s along U, 63 along V, 53 along W; any speed: 127 km/s along W) or state that quoted values are for the Galactic radial direction; add a slab-width test for the capped rule.
- Use F = 1 instead of 0.81 for persistence times of 10 Myr or less (x < 0.27 and 0.027 at 1 pc for 1 and 10 Myr).
- Report stalled seeds instead of averaging them away with nanmean, and state the fraction of origins that fail to start under the cap.
- Give the 0.47-0.67 Gyr exposure numbers (4,200-6,000 systems within 1 pc; x < 7e-4 for 470 Myr) next to the 2.33 Gyr headline, noting that remote detectability of mid-Proterozoic oxygen is contested.
- Reword 'the per-system limits on x are a floor' to 'are conservative'; apply the S/N >= 5 RV cut to the simulation velocity sample or state that its effect is small.