Where is everybody? · Working papers
Dimmed elliptical galaxies: a fundamental-plane search for harvested starlight
Revised after a second, separate analysis run for this project tried to break it. Neither analysis is an outside expert.
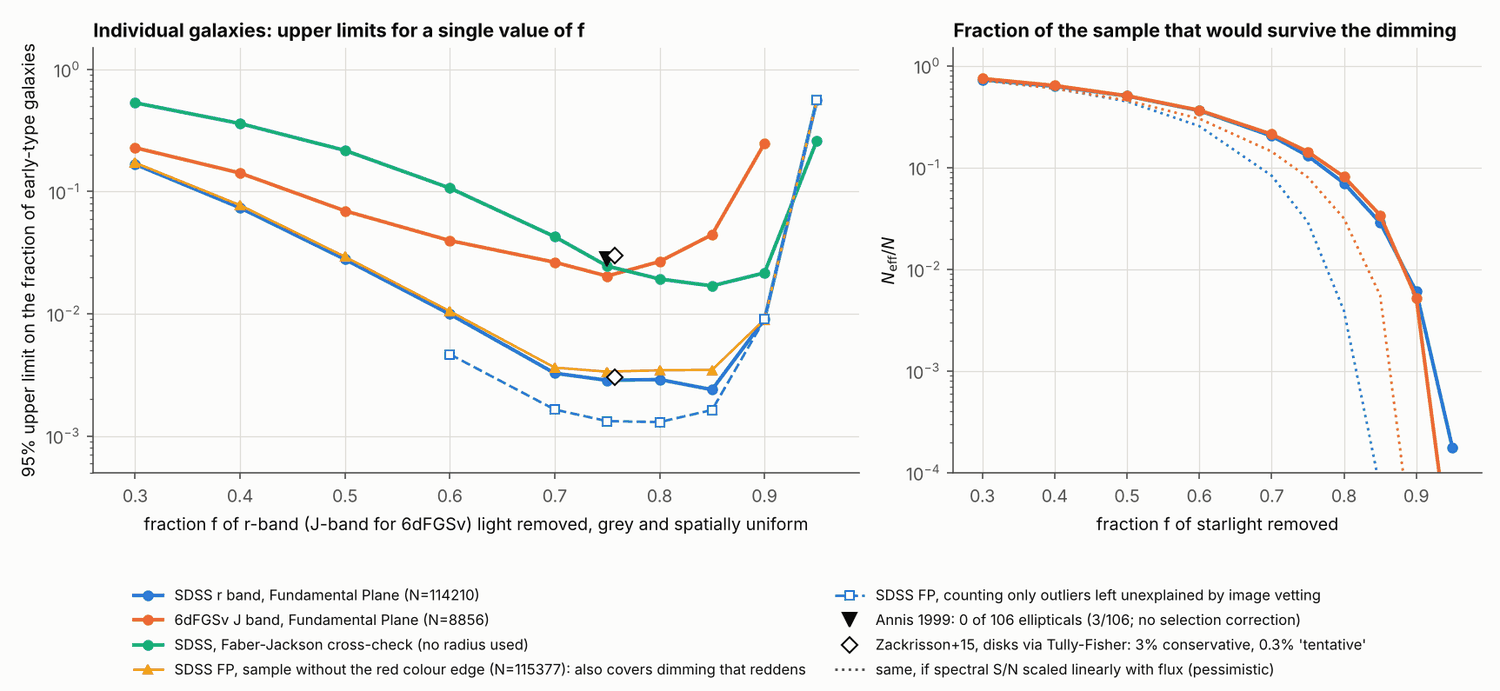
For grey, spatially uniform dimming at fixed mass, two fundamental-plane samples with no outlier clipping (114,210 SDSS r-band and 8,856 6dFGSv J-band early-type galaxies) give 95% upper limits on the fraction of bright early types missing a fraction f of their light of 2.8% at f=0.5 (2.4-3.8% across selection variants), 0.29% at f=0.75 (0.24-0.45%; 1.4% under pessimistic S/N scaling) and 0.90% at f=0.9 (resting on only 689 nearby, bright, high-surface-brightness galaxies and vanishing under pessimistic S/N); a population spread over f=0.5-0.9 is bounded at 3.4-3.8%, and dropping the red …
Summary
For grey, spatially uniform dimming at fixed mass, two fundamental-plane samples with no outlier clipping (114,210 SDSS r-band and 8,856 6dFGSv J-band early-type galaxies) give 95% upper limits on the fraction of bright early types missing a fraction f of their light of 2.8% at f=0.5 (2.4-3.8% across selection variants), 0.29% at f=0.75 (0.24-0.45%; 1.4% under pessimistic S/N scaling) and 0.90% at f=0.9 (resting on only 689 nearby, bright, high-surface-brightness galaxies and vanishing under pessimistic S/N); a population spread over f=0.5-0.9 is bounded at 3.4-3.8%, and dropping the red colour edge gives 2.9%/0.34%/0.90%. These are limits on light, not stars: cloaking all dwarfs and subgiants of an old population removes only about 20-36% of the light (Lacki 2019), where the limit is 7-17% of galaxies or absent, and f above about 0.93 or physical removal of stars is unconstrained. Spheres dimmed by 50% (30%) and placed uniformly in volume fill less than 0.39/0.47/0.83% (2.9/2.7/1.2%) of the SDSS volume for R=5/10/20 Mpc, but for R<=10 Mpc this is extrapolated from the 0.05-3% of the volume (100-900 sphere volumes, mostly z<0.08) actually tested; galaxy-weighted, fewer than 0.1-1.2% of sample galaxies lie in such regions. The most significant dim spheres all sit on catalogued rich clusters; 44% of the Coma sphere's 0.10 dex deficit is finger-of-god plus photometry, the rest has the sign and rough size of the environmental offset of the plane (cause not established), and ACO 2593 keeps an unexplained ~15% deficit about twice that trend. The first-pass individual-galaxy numbers survive unchanged (the referee reproduced them); the claims around them are narrower.
Key numbers
| Quantity | Value | Uncertainty | Note |
|---|---|---|---|
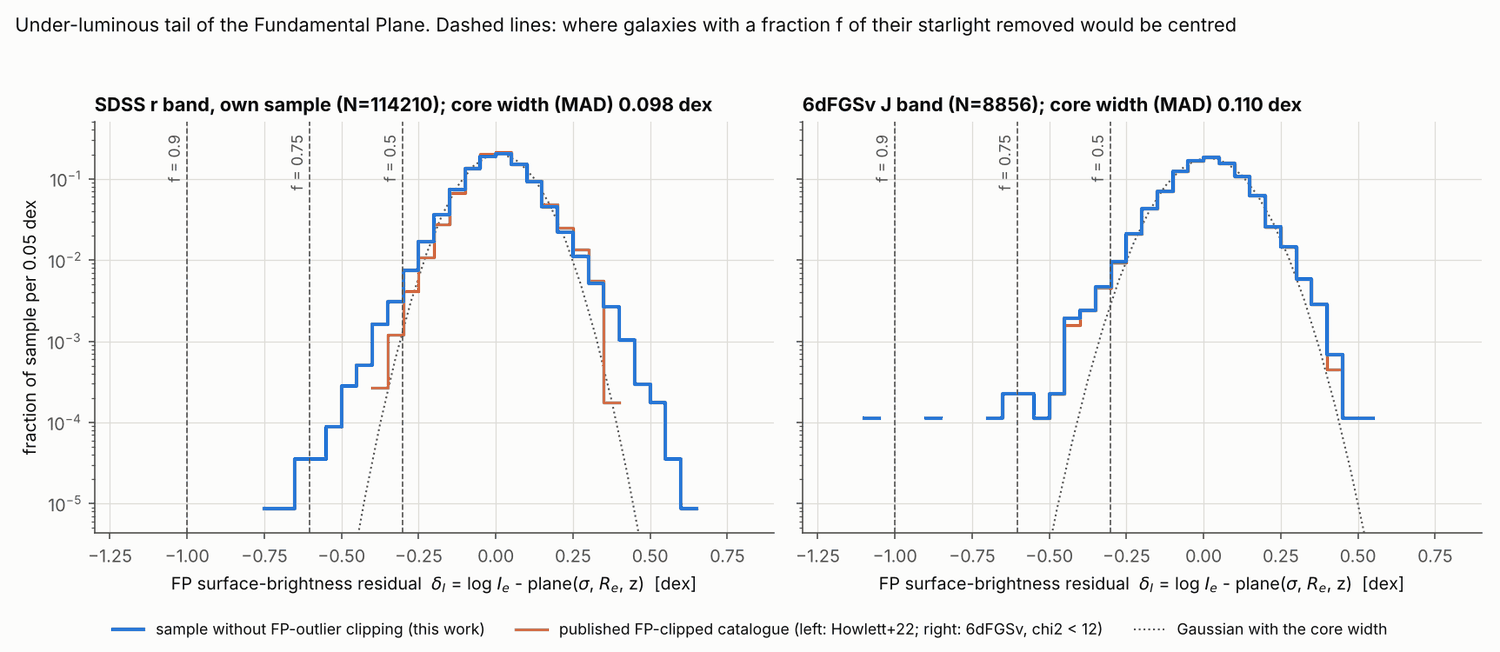
| SDSS sample size (unclipped FP sample, z=0.02-0.12) | 114,210 of 221,433 parent galaxies | exact count | 6dFGSv: 8,856 (36 outlier-clipped objects restored). SDSS FP intrinsic scatter 0.104 dex in log I_e, MAD 0.098; 6dFGSv 0.102 / 0.110. |
| 95% upper limit on fraction of SDSS early types dimmed by f=0.5 (grey, uniform) | 2.8% | 2.4-3.8% across selection variants (mag limit, EW boost, S/N scaling); 1.9% with stricter quality cuts; 2.9% without red colour edge | N_eff=57,746 (51% of sample, median z 0.073, r<=16.85); every outlier counted as a candidate (n_obs=111) |
| 95% upper limit, f=0.75 | 0.29% | 0.24-0.45% across variants; 1.4% if spectral S/N scales linearly with flux; 0.13% after vetting; 0.34% without red colour edge | N_eff=14,853 (13% of sample, median z 0.050, r<=16.09) |
| 95% upper limit, f=0.9 | 0.90% | 0.75-2.1% across variants; no limit under pessimistic S/N scaling; 5.3% with stricter quality cuts | rests on 689 galaxies (0.6% of sample), median z 0.030, 95% below z=0.049, r<=15.10, biased to high surface brightness (mean dI +0.13) |
| 95% upper limits at f=0.3 / 0.4 / 0.6 / 0.95 (SDSS) | 17% / 7.4% / 0.99% / 56% | conservative (unvetted); f=0.6 vetted 0.47% | weak below f=0.4, effectively no constraint above f~0.93 or below f~0.3 |
| Mixture bound: total fraction of galaxies with any distribution of f over 0.5-0.9 | <3.4% (per-threshold 95%), <3.8% (simultaneous) | for f in 0.75-0.9: 0.77% / 1.1% | linear programme over 28 thresholds; replaces the first-pass '2.8% for any f in 0.5-0.9' |
| 6dFGSv J-band 95% limits at f=0.3/0.4/0.5/0.6/0.75/0.9 | 23% / 14% / 7.0% / 4.0% / 2.0% / 25% | E/S0-only subsample 6.3% / 1.7% / 25% at f=0.5/0.75/0.9 | independent survey, band and hemisphere; Faber-Jackson cross-check on SDSS much weaker (53/22/2.5/2.2%) |
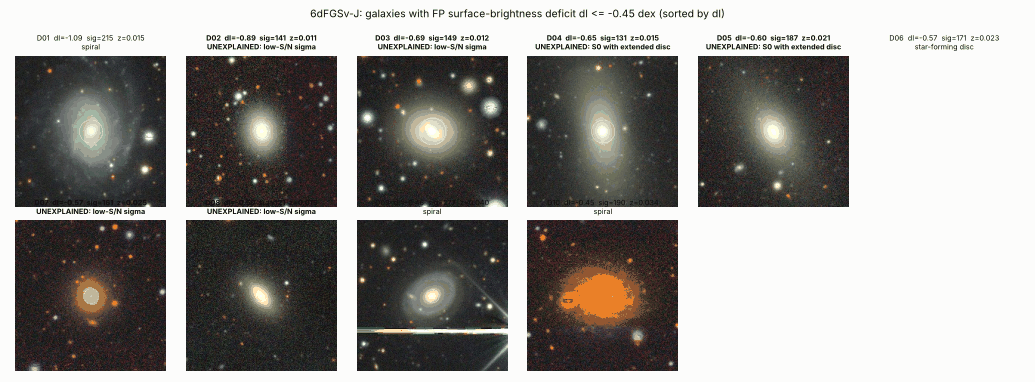
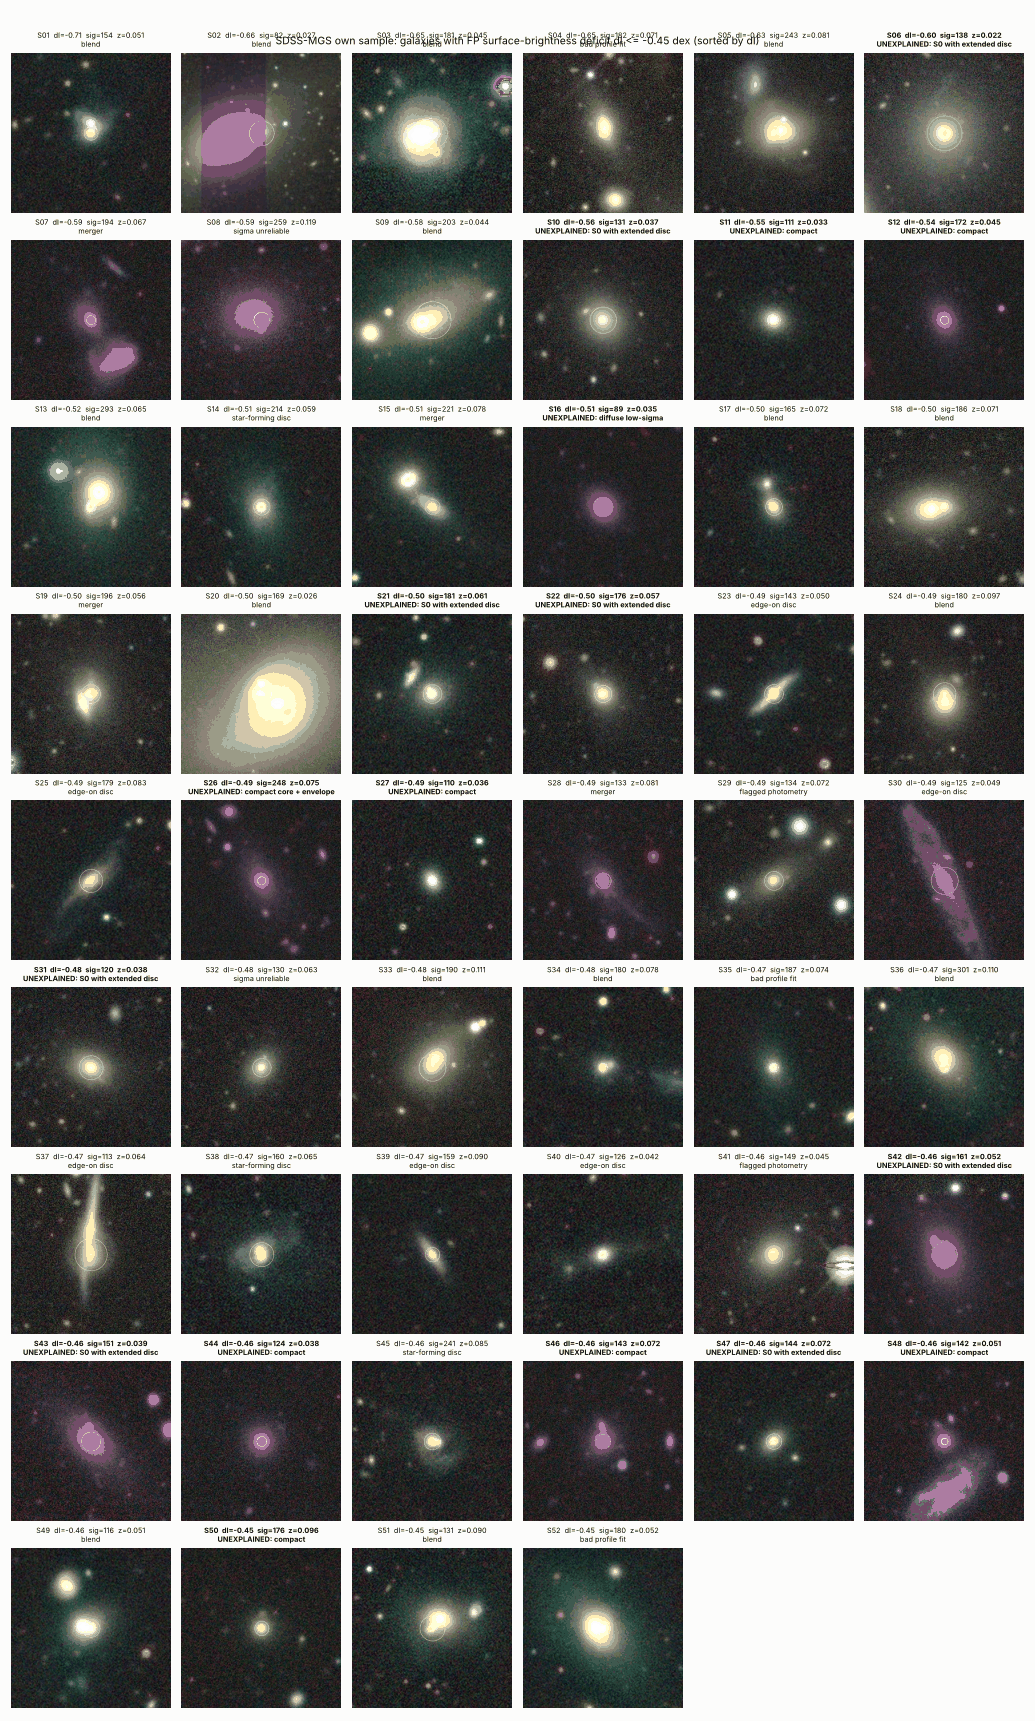
| Tail asymmetry beyond 0.60 dex (dim / bright), both samples combined | 11 dim vs 1 bright | binomial p=0.003 | SDSS 6/1, 6dFGSv 5/0; beyond 0.45 dex SDSS 52/59, 6dFGSv 10/2. Rates below -0.45 dex: 0.046% (SDSS), 0.11% (6dFGSv). Five objects at >=75% apparent deficit are not explained by vetting: S06 (157.816,+25.861), D02 (190.530,-43.371), D03 (300.367,-71.265), D04 (39.872,-19.842), D05 (144.756,-7.696) |
| Outlier vetting (dI<=-0.45 dex) | SDSS 52 (35 explained, 17 not); 6dFGSv 10 (4 explained, 6 not) | vetting is visual and partly manual | none has mid-IR excess: for 23 unexplained outliers waste-heat ratio gamma(300 K)<=0.064 profile-fit, <=0.12 largest AllWISE aperture; gamma(150 K)<=0.18 / <=0.62; expected about 2 or more for f>=0.65 |
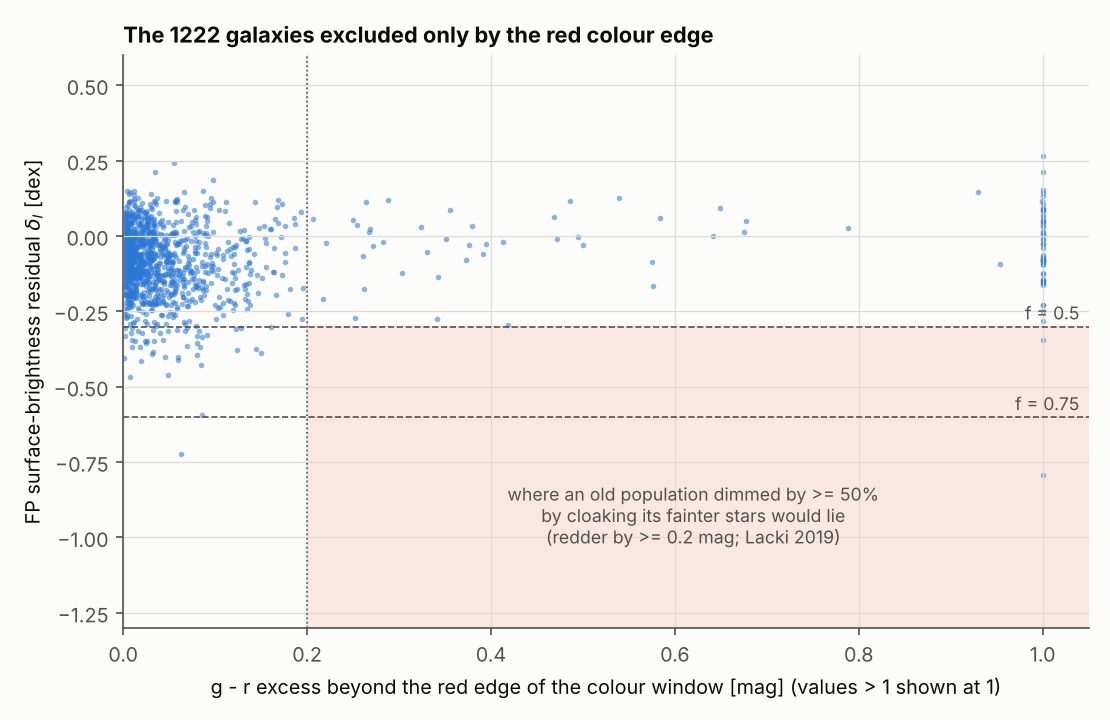
| Red-side colour check (galaxies redder than the selection window) | 1,222 of 132,662; 49 / 5 / 2 at dI<=-0.30/-0.45/-0.60; only 2 are >0.2 mag beyond the edge | both of those 2 are photometric artefacts on inspection | no population of reddened, under-luminous early types hidden by the colour cut |
| Howlett+22 clipped catalogue: eligible SDSS outliers expected vs present | 9 eligible of 52, 6.1 expected, 0 present | binomial p=3.3e-5, Poisson p=0.0021 | confirms published FP catalogues remove dim outliers; at dI<=-0.30: 125 eligible, 85 expected, 48 present |
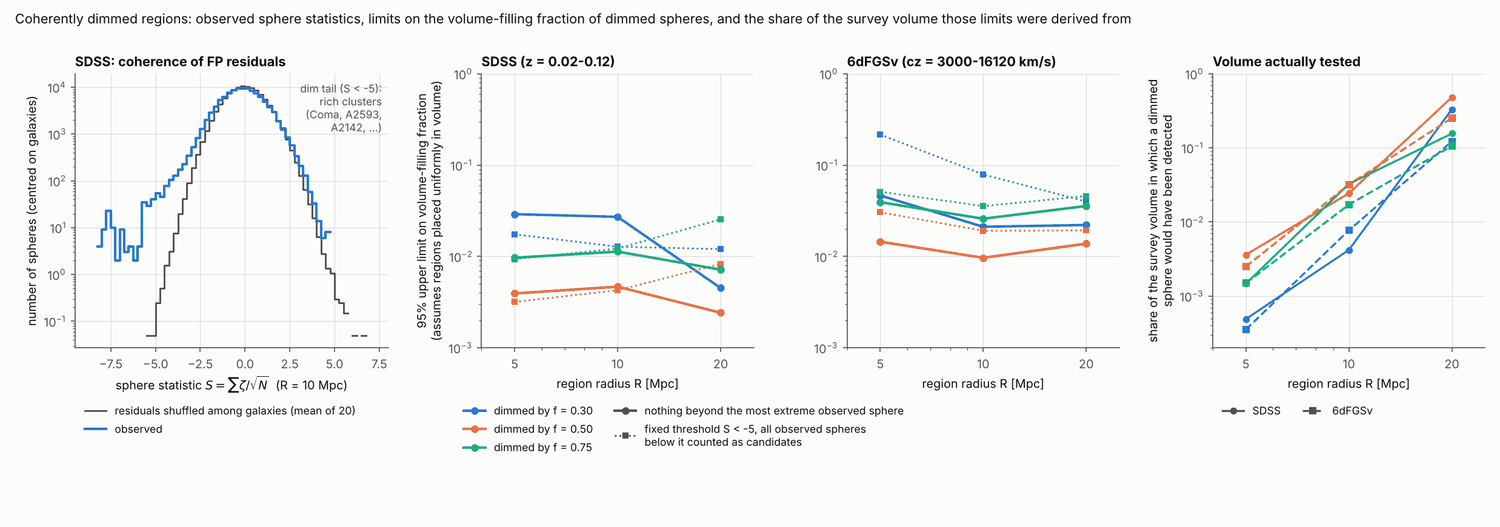
| SDSS region limit, 50% dimmed spheres, filling fraction (R=5/10/20 Mpc) | <0.39% / <0.47% / <0.83% | Monte Carlo 5% / 3% / 1%; weaker of rules A and B quoted | tested share of survey volume 0.36% / 2.4% / 48% (762 / 643 / 1,590 sphere volumes); assumes spheres placed uniformly in volume; number density <7.5e3 / 1.1e3 / 250 per Gpc^3; galaxy-weighted <0.13% / 0.32% / 1.1% |
| SDSS region limit, 30% dimmed spheres, filling fraction (R=5/10/20 Mpc) | <2.9% / <2.7% / <1.2% | Monte Carlo 13% / 8% / 2% | tested share 0.05% / 0.42% / 33% (103 / 111 / 1,093 sphere volumes; 90% of detections below z=0.08 for R<=10); galaxy-weighted <0.44% / 0.54% / 1.2% |
| SDSS region limit, 75% dimmed spheres, filling fraction (R=5/10/20 Mpc) | <0.97% / <1.2% / <2.6% | Monte Carlo 8% / 3% / 2% | tested share 0.15% / 3.3% / 16%; such galaxies mostly drop out of the sample, so sensitivity is lower than for 50% |
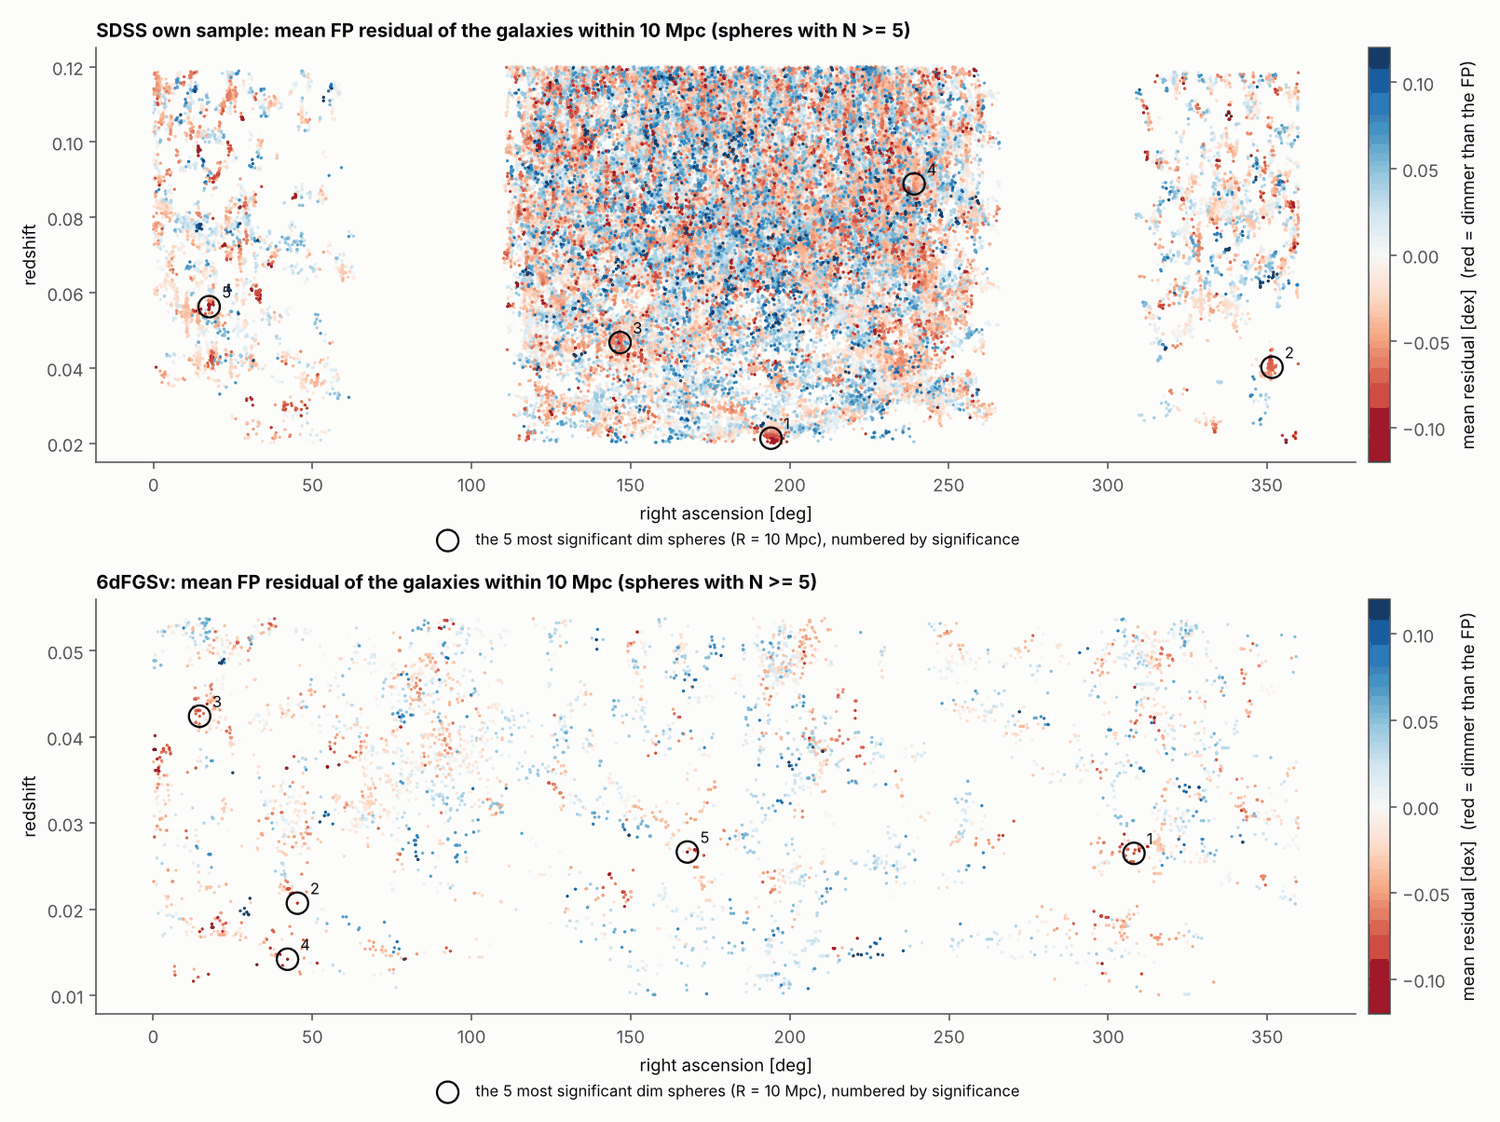
| Most negative SDSS sphere statistic S_min (R=5/10/20 Mpc) | -6.28 / -8.08 / -6.49 | shuffle p=0.0033 each (1 of 300 at most) | all on Coma (ACO 1656); after environment detrending -5.11 / -6.65 / -5.67; all 15 top dim spheres contain catalogued clusters |
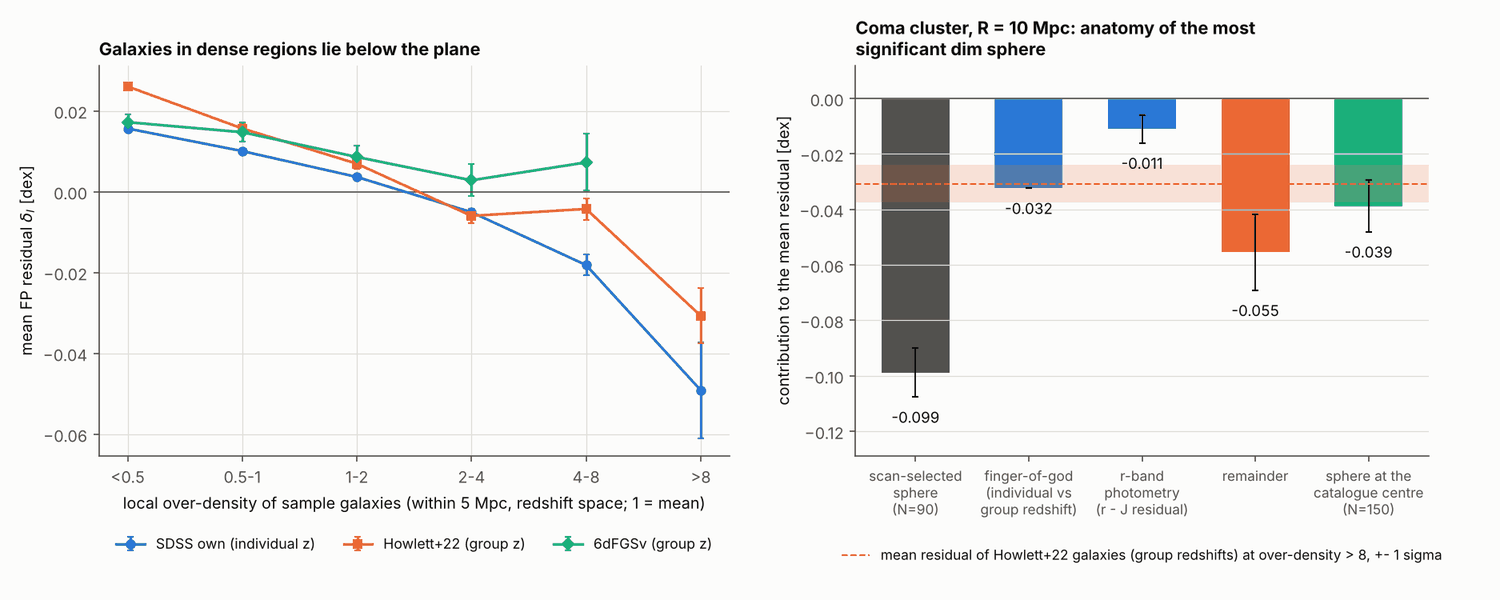
| Coma scan-selected R=10 Mpc sphere mean residual | -0.099 dex (N=90) | +-0.009 | finger-of-god -0.032, photometry -0.011+-0.005 (44% identified); remainder -0.055+-0.014 vs group-redshift environmental trend -0.031+-0.007; difference -0.025+-0.015 |
| Catalogue-centred R=10 Mpc spheres (no scan selection) | Coma -0.039 dex, ACO 2142 -0.020 dex, ACO 2593 -0.072 dex | +-0.009 / +-0.008 / +-0.013 | ACO 2593 corresponds to ~15% apparent dimming, about 2.8 sigma above the environmental trend, no group redshifts available; not explained |
| Coherent rms of FP residual on sphere scale (SDSS, R=5/10/20 Mpc) | 0.016 / 0.015 / 0.010 dex | shuffle-based | linear-theory bulk flows give 0.02 dex at z=0.02 and 0.005 dex at z=0.08, so peculiar velocities account for a comparable amount |
Data used
- SDSS spectroscopic galaxy sample: photometry, de Vaucouleurs fits, velocity dispersions and line indices via SDSS SkyServer SQL (parent 221,433 galaxies)
- Howlett et al. (2022) SDSS peculiar-velocity fundamental-plane catalogue (group redshifts, clipped sample for comparison)
- 6dFGSv fundamental-plane tables, Campbell et al. (2014) via VizieR (full and published samples)
- AllWISE source catalogue via IRSA TAP (profile-fit and aperture W3/W4 photometry for outliers) and VizieR cross-match
- SIMBAD TAP: catalogued galaxy clusters for sphere identifications and cluster centres
- Legacy Survey / SDSS image cutouts for visual vetting of outliers (notes recorded in code/vetting_manual.csv and code/redside_manual.csv)
- Literature values only: Lacki (2019) cloaked-population light fractions; Annis (1999); Zackrisson et al. (2015)
Method
Rebuilt two early-type samples without FP outlier clipping: SDSS DR-based r-band sample (de Vaucouleurs radii, sigma, colour/concentration/EW/S-N cuts; 114,210 galaxies, z=0.02-0.12) and the full 6dFGSv J-band table (8,856, clipped objects restored). Fitted the plane in the surface-brightness direction by truncated-normal maximum likelihood with a redshift term; residual dI shifts by log10(1-f) under dimming. For each f, every sample galaxy was dimmed and passed through all flux-dependent cuts (magnitude limit, S/N, sigma error, colour, EW) to get the number of surviving twins N_eff and the fraction recovered below four pre-specified thresholds; limits are Bonferroni-corrected Poisson upper limits on the observed count divided by the effective number, with all outliers counted as candidates (conservative) or after visual/catalogue vetting. Variants: magnitude limit, EW boost, linear S/N scaling, stricter quality cuts, no red colour edge, E/S0 only, Faber-Jackson. A linear programme bounds mixtures over f. Outliers were vetted with images, catalogue flags and AllWISE profile-fit and aperture photometry (waste-heat ratio). Regions: standardised residuals summed in spheres of 5/10/20 Mpc on a grid, shuffle null (300), 30k-300k injected dimmed spheres per case for sensitive volume; limits by rule A (beyond observed minimum) and rule B (fixed S<-5 with Poisson limit on observed count), quoting the weaker, with tested volume share, sphere volumes, detection redshifts, Monte Carlo errors and a galaxy-weighted version. Dim spheres were cross-identified with SIMBAD clusters, decomposed into finger-of-god (group redshifts from Howlett+22), photometry and remainder, and compared with catalogue-centred spheres and the environmental trend.
Closest prior work and what is new
Closest prior work. Annis (1999, JBIS 52, 33) used the fundamental plane of ~100 ellipticals (and Tully-Fisher for spirals) to find no galaxy dimmed by more than ~75%; Zackrisson et al. (2015, ApJ 810, 23) did the Tully-Fisher analogue for 1,359 spirals (<~3% with >=75% dimming) and Calissendorff (2013 thesis) its precursor; Lacki (2019, 'Sunscreen') modelled the non-grey colour and luminosity signature of partial cloaking; Chen & Garrett (2021) and Griffith et al. (2015) are the waste-heat counterparts; Howlett et al. (2022) and Campbell et al. (2014) are the FP catalogues used, which clip outliers for peculiar-velocity work.
What is new. To my knowledge the first FP dimming test at the 10^5-galaxy scale with (i) samples rebuilt without any FP outlier clipping (and a demonstration with expected counts that published catalogues remove exactly the objects sought), (ii) selection-corrected limits as a function of f with every flux-dependent cut modelled, a mixture bound, and a check for reddened objects outside the colour window, and (iii) a quantified search for coherently dimmed 5-20 Mpc regions with injection-based limits, tested-volume accounting and a galaxy-weighted version. I did not find a prior FP-based region search or selection-corrected FP dimming limit, but the literature search was limited to ADS/arXiv-level queries, so an unpublished or obscure equivalent cannot be excluded.
Confidence that it is new: medium
Limitations
- The test constrains grey, spatially uniform dimming of the light inside the effective aperture at fixed sigma and R_e. Selective cloaking of low-mass stars removes only ~20-36% of the bolometric light of an old population (Lacki 2019), a range where the limit is 7-17% of galaxies or absent, so harvesting of main-sequence stars is at best weakly constrained.
- No constraint for f above ~0.93 (galaxy drops out of the spectroscopic sample), for f below ~0.3 (inside the scatter of the plane), for physical removal of stars (sigma falls too), or for dimming confined to the outskirts.
- The f=0.9 limit rests on 689 nearby (z<0.05), bright (r<=15.1), high-surface-brightness galaxies and vanishes if spectral S/N scales linearly with flux; the f=0.75 limit weakens to 1.4% under that assumption. The true S/N scaling for a dimmed galaxy is assumed, not measured.
- Limits apply to bright, red, spectroscopically early-type galaxies in the survey magnitude range (roughly L* and above); they say nothing about dwarfs, spirals or z>0.12.
- Region limits assume spheres placed uniformly at random in comoving volume and uniformly dimmed members. For R<=10 Mpc only 0.05-3% of the SDSS volume (100-900 sphere volumes, mostly z<0.08) was actually tested; the quoted filling fractions extrapolate from that. If dimmed regions prefer clusters or voids the limits change.
- Rich clusters produce real negative residuals of 0.02-0.07 dex. 44% of the Coma sphere's deficit is identified; the rest is compared with an empirical environmental trend whose physical cause (age/M-L, structural non-homology, residual redshift-space distortion) is not established here. ACO 2593 keeps a ~15% deficit about twice that trend with no group redshifts available to test finger-of-god.
- Seventeen SDSS and six 6dFGSv outliers below -0.45 dex, including five at >=75% apparent deficit, are not explained by the vetting (visual inspection, partly manual notes). They show no mid-IR excess, but no spectroscopic or imaging follow-up was done; the dim/bright asymmetry beyond 0.60 dex (11 vs 1) is real in the catalogues and most plausibly photometric or sigma error, which is not proven.
- AllWISE aperture magnitudes are fixed circular apertures up to 24.75 arcsec radius, not matched elliptical photometry; for the nearest, largest outliers some extended mid-IR flux may still be missed. Cold (<100 K) radiators are not constrained by WISE at all; only the FP deficit applies to them.
- Effective radii and surface brightnesses are single-component catalogue fits (SDSS de Vaucouleurs model, 2MASS-based 6dFGSv); no re-measurement of photometry was made, and 6dFGSv velocity dispersions have ~12% errors.
- My reading of the light fractions in Lacki (2019) is approximate (from figures and text), and is flagged as such in the report.
What it means for the Fermi question
Within the local volume (z<0.12) and for bright early-type galaxies, a civilisation that has enclosed half or more of its galaxy's starlight in a grey, galaxy-wide way is rare: fewer than about 3% of such galaxies at f=0.5 and fewer than about 0.3-1.4% at f=0.75, independent of the temperature of the waste heat, which closes the cold-radiator loophole of mid-infrared searches for that regime. Combined with the mid-IR bounds on the surviving outliers, there is no candidate Kardashev-III early-type galaxy in ~120,000 objects. The constraint is much weaker than it sounds for the most plausible engineering path: enclosing only long-lived low-mass stars removes 20-36% of the light and reddens the galaxy modestly, and that regime is limited only to 7-17% of galaxies or not at all; complete cloaking (f>0.93) removes the galaxy from the sample altogether. Expanding spheres of dimmed galaxies of 5-20 Mpc radius with 30-50% dimming fill less than about 1-3% of the volume if placed at random, but the small-radius limits rest on a small tested volume and on the uniform-placement assumption, and rich clusters mimic the signal at the 5-15% level, so the FP cannot by itself exclude modest (<~20%) regional dimming. Net: the result removes the 'many galaxies are mostly harvested' branch for massive early types locally, and leaves partial, selective or complete harvesting open.
Changes made after the referee report
- Scope (referee 1): the summary, method and limitations now state that the limits are for grey, spatially uniform dimming of light at fixed mass; Lacki (2019) is cited and the 20-36% light loss for cloaking all dwarfs and subgiants is set against the 7-17% or absent limits in that range. The claim that the test covers star-harvesting generally was withdrawn.
- Red-side colour check (referee 1): new analysis of the 1,222 galaxies redder than the colour window (49/5/2 below -0.30/-0.45/-0.60 dex; the only two far beyond the edge are photometric artefacts), plus a new 'no red colour edge' sample variant with full limits (2.9% / 0.34% / 0.90% at f=0.5/0.75/0.9). New figure figS1_redside.png.
- Region limits (referee 2): injections raised from a few thousand to 300k/100k/30k per case so the weakest case has 55 detections instead of 7 (R=5 Mpc, f=0.3 limit moved from 2.3% to 2.9%); Monte Carlo errors, tested share of survey volume, number of sphere volumes, 90th-percentile detection redshift, number density and a galaxy-weighted limit are now tabulated; the uniform-placement assumption is stated; rule B (fixed threshold, Poisson limit on observed count) is named as the rigorous one and the weaker of A and B is quoted. Fig. 3 gained a 'volume actually tested' panel.
- Mixture bound (referee 3): the statement '2.8% for any f in 0.5-0.9' is replaced by a linear-programme bound of 3.4% (per-threshold) to 3.8% (simultaneous) on the total over any distribution of f in 0.5-0.9.
- Howlett+22 comparison (referee 4): '0 of 52' replaced by 9 eligible, 6.1 expected, 0 present (binomial p=3.3e-5, Poisson p=0.0021), with the -0.30 dex comparison (85 expected, 48 present) added.
- Cluster explanation (referee 5): 'largely explained' replaced by a decomposition (44% identified as finger-of-god plus photometry; remainder -0.055+-0.014 vs group-redshift trend -0.031+-0.007), catalogue-centred spheres for Coma, ACO 2142 and ACO 2593, SIMBAD identifications for all 15 top dim spheres, and the new inconvenient finding that ACO 2593 keeps a ~15% deficit about twice the trend. Fig. 5b redrawn.
- f=0.9 population (referee 6): described explicitly (689 galaxies, 0.6% of the sample, z<0.05, r<=15.1, high surface brightness, zero survivors under linear S/N scaling); the same is given for f=0.5 and f=0.75.
- Tails (referee 7): new dim/bright tail table for both samples, rates 0.046% and 0.11% below -0.45 dex, the 11-vs-1 asymmetry beyond 0.60 dex, and the five unexplained objects at >=75% apparent deficit named with coordinates (S06, D02, D03, D04, D05).
- WISE (referee 8): AllWISE aperture photometry fetched from IRSA for all outliers; bounds on the waste-heat ratio are now given for both profile-fit (0.064 / 0.18 at 300 / 150 K) and largest-aperture (0.12 / 0.62) photometry and labelled as such.
- Citations and wording (referee 9): Chen & Garrett (2021) and Calissendorff (2013) added; 'leaves little room' and similar phrases replaced by numbers.
- Code: new modules code/revision_checks.py and code/report_numbers.py, new input code/redside_manual.csv, selection cuts refactored into reusable masks in build_samples.py (sample verified byte-identical to first pass), run_all.py extended to ten stages; three full reruns with exit code 0 and deterministic outputs.
Referee points not accepted
- None rejected outright; all nine required changes were made.
- Qualification to point 1: for cloaking of all dwarfs and subgiants the r-band loss is probably nearer 40% than the bolometric 20-36% (my approximate reading of Lacki 2019, flagged as approximate in the report), where the limit is about 7% of galaxies rather than absent. The constraint on that scenario is therefore weak, not nil.
- Qualification to point 4: the binomial probability (3.3e-5) for zero of nine eligible outliers appearing in Howlett+22 is kept alongside the more conservative Poisson figure (0.0021); both support the statement that the published catalogue removes dim outliers.
- The individual-galaxy headline limits (2.8% / 0.29% / 0.90%) are unchanged; the referee's independent recomputation reproduced them, and the revision narrows the claims around them rather than the numbers.
Figures
Code
Every number above is produced by these scripts from public data. The data tables themselves are not hosted here; the scripts download them.
analysis_individual.py analysis_regions.py build_samples.py download_data.py finalize_limits.py fpk_common.py make_figures.py region_checks.py report_numbers.py revision_checks.py run_all.py vet_candidates.py
Referee report
A second, separate analysis re-ran the code, recomputed the main numbers by its own route and tried to break the result. Like the first, it was run by Claude for this project; it is not an outside expert. In its report “the analyst” is the first analysis, which wrote the paper, and file names that are not linked on this page are its own working files. The paper above is the version revised in response.
Verdict: sound with fixes. Results reproduced: yes.
Full rerun: copied code/ to scratch, pointed FP_KIII_RAW at a fresh
directory linked to the cached raw downloads, ran
python3 run_all.py --no-download single-threaded: 495 s,
exit code 0. All 16 output tables compared are byte-identical to the
analyst's (limits_final, limits_individual, limits_individual_best,
limits_regions, fp_fits.json, region_extreme_patches, env_trend,
survey_volume, candidates_*_vetted, etc.). Every number I checked in the
report matches those tables.
Raw data are re-downloadable: VizieR FPsample returns 11,102 rows, Zenodo answers, and a fresh SkyServer pull of the RA 0-4 chunk equals the cached copy after sorting (1,171 rows, max numeric difference 0). SkyServer returned HTTP 500 on 2 of 6 requests, so a first-time download relies on the retry loop.
Independent recomputation (own script from the 90 raw SDSS chunks; own cuts, astropy distances, crude k-correction, clipped least-squares plane instead of truncated ML, binned S/N table): sample 114,208 vs 114,210; tail at -0.45 / -0.60 dex 58 / 5 vs 52 / 6; N_eff 58,003 / 14,962 / 697 vs 57,746 / 14,853 / 689; 95% limits at f = 0.5 / 0.6 / 0.75 / 0.9 of 3.0% / 1.0% / 0.27% / 0.93% vs the analyst's 2.8% / 0.99% / 0.29% / 0.90%.
Independent region injections (own standardisation, sphere centred on the injection point): Coma is the most extreme sphere at all three radii; my sensitive volumes are 1.3-1.9 times the analyst's in 8 of 9 cases, so the analyst's region limits are on the conservative side.
Other checks that passed: units and zero points, 6dF RA in hours, 6dF radii against catalogue kpc/h (0.0000 dex), no duplicated specObjID, no chunk near a row cap, S/N model unbiased against the parent sample without the S/N cut, Bonferroni and Poisson limits applied correctly. The selection model is conservative: N_eff is set mainly by the analyst's own surface-brightness-range requirement (at f = 0.9, 8,442 pass the magnitude limit and 701 pass that requirement). Citations spot-checked in the source texts: Howlett+22 (34,059 galaxies; 503 outliers rejected at p < 0.01 after visual rejects), Zackrisson+15 (1,359 discs; 3% and 0.3%; "57 disk galaxies and 106 ellipticals" for Annis), 6dFGSv ReadMe (criterion 6 is chi2 < 12). Annis's "137 galaxies" comes from a web-search summary of the BIS abstract page; I did not open the page or the paper.
Strongest objection
The test measures missing light under a grey, uniform dimming model, while the plausible harvesting strategy in an old stellar population is neither grey nor light-weighted. Giants supply most of an elliptical's light and are the hardest stars to enclose. In Lacki's (2019) model, enclosing every dwarf and subgiant costs only about 20-36% of the light, where this study has little or no power (17% limit at f = 0.3, nothing below), and enclosing enough giants to reach f >= 0.5 makes the galaxy more than a magnitude redder than the red sequence, which the sample's colour window would exclude.
The conclusion survives in narrowed form. The numerical limits on the fraction of early-type galaxies missing >= 50% of their r-band light are correct for grey dimming, and my check of the 1,222 galaxies excluded on the red side found no reservoir of very red, under-luminous objects (49 at dI <= -0.30, only 2 of them more than 0.2 mag beyond the red edge), so the non-grey case at f >= 0.5 is covered to a similar level. What does not survive is the reading that galaxy-wide star harvesting in ellipticals is tightly bounded: harvesting of all main-sequence stars is essentially unconstrained here.
Errors found
- major. The limits hold only for grey, spatially
uniform dimming of light, and the most relevant prior paper is not
cited. Lacki 2019 (PASP 131, 024102, arXiv:1807.00077) shows that
cloaking stars below a luminosity threshold in an old population is not
grey: cloaking all dwarfs and subgiants removes only about 20-36% of the
bolometric light (where this study's limit is 17% of galaxies or
absent), and cloaking enough giants to reach f >= 0.5 makes a
quenched galaxy more than a magnitude redder than the red sequence,
which the sample's 0.4 mag colour window would exclude. The headline
phrase 'regardless of where or whether the absorbed energy is
re-emitted' and the implication 'leaves little room for galaxy-wide
shrouding' therefore overreach.
- Evidence: Lacki 2019 text: unscreened fraction 80-99.9% (L_min = 1 Lsun), 64-99.7% (10), 41-98% (100), 16-92% (1,000), quenched galaxies fading most; 'quenched galaxies ... becoming over a magnitude redder or more than the red sequence once the red clump is screened'. Referee check of galaxies excluded on the red side (scripts/red_side.py): of 132,662 passing all non-colour cuts except D4000, 1,222 are redder than the window; 49 have dI <= -0.30, 5 have dI <= -0.45; only 2 of the 49 are more than 0.2 mag beyond the red edge and one object (RA 216.587, Dec +16.949, flagged photometry) is more than 0.5 mag beyond it with dI <= -0.45. No hidden red, under-luminous population exists, so the conclusion survives at f >= 0.5 once re-scoped.
- Fix: State the grey, uniform-dimming assumption in the headline; cite Lacki 2019; add the red-side check to the robustness section; say the limits are on fractions of light, and that harvesting all main-sequence stars of an old population (20-36% of light) is essentially unconstrained.
- major. Region filling-fraction limits for R = 5 and
10 Mpc are extrapolated from a small tested volume and the headline does
not say so. The limit is 3 (or the rule-B count limit) divided by the
number of sphere volumes in the sensitive volume, extended to the whole
survey by assuming uniform random placement. Monte Carlo errors are not
quoted.
- Evidence: limits_regions.csv, rule A, f = 0.5: sensitive volume 4.7e5 / 2.8e6 / 4.0e7 Mpc^3 for R = 5 / 10 / 20 Mpc, i.e. 0.43% / 2.5% / 37% of the 1.1e8 Mpc^3 survey, or about 900 / 670 / 1,200 sphere volumes, all in the densest parts. R = 5 Mpc, f = 0.3 rule-A efficiency rests on 7 detections in 30,000 injections (about +-38%). In my injections 90% of detections are below z of about 0.05-0.08 for R <= 10 Mpc.
- Fix: Quote the tested share of the volume and number of sphere volumes beside each filling fraction; say the figure assumes uniform placement; change 'out to z = 0.12' to 'mostly below z of about 0.08' for R <= 10 Mpc; add Monte Carlo errors; add a galaxy-weighted limit (fraction of sample galaxies that can lie in such regions).
- minor. The range statement 'fewer than 2.8% of
bright ETGs have any f between 0.5 and 0.9' takes the largest single-f
limit, which is not valid for a population spread over several f values.
- Evidence: Linear programme over all thresholds (scripts/mixture_lp.py): maximum total fraction 3.4% at the analyst's per-threshold confidence, 3.8% with simultaneous coverage of all 28 thresholds. The f = 0.75-0.9 range statement (below 0.9%) holds at the analyst's confidence (0.77%) and is 1.1% with simultaneous coverage.
- Fix: Change to 'fewer than about 3.5-4%' or restrict the statement to single values of f.
- minor. '0 of 52 SDSS galaxies at 0.45 dex or more
below the plane survive in Howlett+22' overstates the clipping
demonstration, because most of the 52 fail Howlett's other cuts anyway.
- Evidence: Only 9 of the 52 pass r <= 17.0, z <= 0.1 and EW(Halpha) < 1 A; with the 68% inclusion rate of such galaxies about 6.1 would be expected in the catalogue and 0 are (Poisson p about 0.002). At dI <= -0.30: 48 observed against about 85 expected. Part of the removal is visual rejection, not the p < 0.01 clip.
- Fix: Reword to 'of the 52, 9 pass Howlett+22's magnitude, redshift and Halpha cuts; about 6 would be expected in the catalogue and none is'.
- minor. The headline says the cluster deficits are
'largely explained'; the tables support less than half identified, with
the rest attributed to an environmental trend by a partly circular
comparison.
- Evidence: Coma sphere mean -0.099 dex: finger-of-god -0.032 and photometry -0.011 (a 2-sigma measurement) = 44%. The remainder -0.055 dex is compared with the SDSS trend -0.049 +- 0.012, which uses individual redshifts and so contains the finger-of-god effect; the like-for-like group-redshift trend is -0.031 +- 0.007, leaving about -0.024 +- 0.011 dex. The sphere was selected as the most extreme of about 1e5, a selection bias not estimated. The report itself says the cause of the trend is not established.
- Fix: Headline: 'about 45% accounted for by finger-of-god and photometry; the remainder has the sign and rough size of the environmental offset of the plane, whose cause is not established'. Compare the remainder with the group-redshift trend.
- minor. The f = 0.9 limit (0.90%) describes an
unusual sub-population but is presented as applying to 'bright ETGs'.
- Evidence: The 689 survivors are 0.6% of the sample: median z 0.030 (95% below 0.049), r <= 15.1, mean dI +0.127 dex (highest surface brightness). The limit disappears under the pessimistic S/N scaling.
- Fix: Describe the tested population wherever the 0.90% figure appears and keep the S/N caveat next to it.
- minor. The far tail is asymmetric towards
under-luminous galaxies and this is not reported; 'the r-band and J-band
samples show the same tail shape' is loose.
- Evidence: Beyond 0.45 dex: SDSS 52 dim / 59 bright, 6dFGSv 10 / 2. Beyond 0.60 dex: SDSS 6 / 1, 6dFGSv 5 / 0. Five of the 11 beyond 0.6 dex have no identified artefact (S06, D02, D03, D04, D05). Rate below -0.45 dex is 0.046% in SDSS and 0.11% in 6dFGSv.
- Fix: Add the dim/bright table, name the five objects at an apparent deficit of 75% or more, and replace 'same tail shape' with the two rates.
- minor. Waste-heat ratios use AllWISE profile-fit
(point-source) magnitudes for resolved galaxies, which underestimates
their mid-infrared flux.
- Evidence: vet_candidates.py uses W3mag/W4mag from II/328; several 6dF candidates have R_e of 5-9 arcsec against a 6.5 arcsec W3 beam. The correction could approach a factor of two; the conclusion (gamma <= 0.064 against an expected 2-3) is unaffected.
- Fix: Label the gamma bounds as point-source values or use extended-source photometry.
Overclaims
- 'regardless of where or whether the absorbed energy is re-emitted' (true only for grey, uniform dimming; the colour window would exclude non-grey dimming)
- 'leaves little room for galaxy-wide shrouding with f between 0.5 and 0.9' (a 3-4% ceiling at f = 0.5 is about 1 galaxy in 30, and the limit is on light, not on the fraction of stars harvested)
- 'spheres dimmed by 50% fill less than 0.33-0.85% of the SDSS volume (z=0.02-0.12)' (for R = 5 and 10 Mpc only 0.43% and 2.5% of the volume was tested, mostly below z of about 0.08)
- 'fewer than 2.8% of bright ETGs have any f between 0.5 and 0.9' (3.4-3.8% for a mixture of f values)
- '0 of 52 SDSS galaxies ... survive in Howlett+22' (only 9 of the 52 were eligible; about 6 expected)
- 'largely explained by finger-of-god redshift errors, a small photometric offset and the known environmental offset of the plane' (44% identified; the environmental comparison is partly circular and its cause is not established)
- 'The r-band and J-band samples ... show the same tail shape' (tail rates differ by a factor of about 2.5; far tail is asymmetric towards dim objects)
- f = 0.9 limit of 0.90% presented for 'bright ETGs' (it rests on 689 nearby high-surface-brightness galaxies and vanishes under the pessimistic S/N scaling)
Novelty check
Novel: partly. The method is Annis (1999); Zackrisson+15 did the disc-galaxy version with a selection correction and a WISE check of outliers. arXiv API and web searches (Kardashev with fundamental plane, Faber-Jackson, peculiar velocity, early-type galaxies, scaling relations) found no fundamental-plane search with a modern large sample and no observational limit on coherently dimmed multi-galaxy regions. So the FP limit from 1.1e5 galaxies with an explicit N_eff(f) is a new quantitative result with an old method; the clipping point is correct but is stated in the source papers themselves; the WISE check follows Zackrisson+15; the region limits appear new. Lacki 2019 (Sunscreen), which bears directly on the grey-dimming assumption, is missing from the prior-work list, as are Chen & Garrett 2021 and the Calissendorff thesis. The analyst's 'medium' confidence is fair.
- Annis 1999, JBIS 52, 33: scaling-relation test, 137 galaxies (abstract); 57 discs and 106 ellipticals per Zackrisson+15
- Zackrisson et al. 2015, arXiv:1508.02406: Tully-Fisher, 1,359 discs, <~3% conservative, <~0.3% tentative at 75% dimming; converts Annis's discs to <=4-6%
- Lacki 2019, PASP 131, 024102, arXiv:1807.00077 (Sunscreen): photometric signatures of partially cloaked galaxies; non-grey dimming of old populations (not cited by the analyst)
- Lacki 2016, arXiv:1604.07844; Griffith et al. 2015, arXiv:1504.03418: waste-heat limits
- Chen & Garrett 2021, arXiv:2108.06597: K-III search via infrared-radio correlation in LoTSS (not cited)
- Calissendorff 2013 BSc thesis: Tully-Fisher test on 4,859 spirals (not cited)
- Olson 2015, arXiv:1507.05969: predicts clusters of K3 galaxies are likelier detections than isolated ones; no observational search
Required changes
- Headline and Implications: replace 'regardless of where or whether the absorbed energy is re-emitted' with 'for grey, spatially uniform dimming, independent of the fate of the absorbed energy'; add that the limits are on fractions of light and that cloaking all dwarfs and subgiants of an old population removes only about 20-36% of the light (Lacki 2019), where the limit is 17% or absent.
- Cite Lacki 2019 (arXiv:1807.00077) in 'Closest prior work'; add the red-side check (1,222 galaxies redder than the colour window; 49 / 5 / 2 at dI <= -0.30 / -0.45 / -0.60) to the Robustness section; change 'colour and D4000 are unchanged by grey dimming' to say the colour window would exclude non-grey dimming and that the excluded galaxies were examined.
- Region limits (headline, results table, Implications): quote beside each filling fraction the tested share of the survey volume (0.43% / 2.5% / 37% for R = 5 / 10 / 20 Mpc at f = 0.5) and the number of sphere volumes tested (about 900 / 670 / 1,200); state the uniform-placement assumption; change 'out to z = 0.12' to 'mostly below z of about 0.08' for R <= 10 Mpc; add Monte Carlo errors (R = 5 Mpc, f = 0.3 rests on 7 detections in 30,000).
- Add a galaxy-weighted region limit (fraction of sample galaxies that can lie in such regions) from the galaxy-centred efficiencies already in limits_regions.csv, and say rule B is the rigorous rule.
- Results, sentence after the limits table: change 'fewer than 2.8% of bright ETGs have any f between 0.5 and 0.9' to 'fewer than about 3.5-4%' (mixture bound 3.4-3.8%), or restrict to single values of f.
- Headline and novelty item (ii): change '0 of 52 ... survive in Howlett+22' to 'of the 52, 9 pass Howlett+22's magnitude, redshift and Halpha cuts; about 6 would be expected in the catalogue and none is'.
- Headline: change 'largely explained by finger-of-god redshift errors, a small photometric offset and the known environmental offset' to 'about 45% accounted for by finger-of-god and photometry; the remainder has the sign and rough size of the environmental offset of the plane, whose cause is not established'. In the Results bullet compare the -0.055 dex remainder with the group-redshift trend (-0.031 +- 0.007), not the individual-redshift one.
- Wherever the f = 0.9 limit (0.90%) appears, describe the tested population (689 galaxies, z below 0.05, r <= 15.1, high surface brightness) and keep the caveat that it disappears under the pessimistic S/N scaling.
- Add the dim/bright tail table (beyond 0.6 dex: 11 dim against 1 bright across both samples) and name S06, D02, D03, D04, D05 as the objects with an apparent deficit of 75% or more and no identified artefact; replace 'same tail shape' with the two rates (0.046% SDSS, 0.11% 6dFGSv below -0.45 dex).
- Implications: replace 'leaves little room' with the numbers (at most about 3-4% of bright early types at f of about 0.5, about 0.3% at f of about 0.75).
- Label the WISE gamma bounds as based on point-source (profile-fit) magnitudes.