Where is everybody? · Working papers
Waste heat from quiet elliptical galaxies
Revised after a second, separate analysis run for this project tried to break it. Neither analysis is an outside expert.
Partial star-harvesting in quiescent galaxies: mid-infrared excess limits at covering fractions of 1 to 50 percent (revised)
Revised 2026-10-12 after referee review. Entry point:
code/run_all.py. Every number below is in
data/report_numbers.txt.
Result in one paragraph. Among 113,158 SDSS early-type galaxies with AllWISE photometry, the 95% upper limit on the fraction that turn at least 30% of their starlight into waste heat is 1.7e-4 at 300 K (1.3e-4 to 5.9e-4 across analysis variants, including a second photometry), 6.9e-4 at worst in 150-400 K (1.6e-3 with a conservative model tolerance) and 4.1e-3 over the whole 100-600 K band (7.8e-3 conservative; set by 100 K, where only W4 sees the signal). At 50% the limit is 2.7e-5 at 300 K (no candidate; 6.9e-5 conservative) and 4.5e-4 over 100-600 K (1.2e-3). At 10% it is 3.1% at 300 K (1.3% to 7.4%) and 14% over 100-600 K (22%). At 3% it is 14% to 66% depending on temperature, and at 1% there is no constraint. In the 78,340 galaxies with no catalogue sign of conventional power, the 30% limit is 3.8e-5 at 300 K (no candidate) and 9.2e-4 at 100 K. Main caveats: these are fractions of red early-type galaxies only; the waste heat is a single-temperature blackbody assumed to follow the starlight; the limit curve falls by two orders of magnitude between f = 0.1 and 0.3, so the roughly 20% uncertainty in the covering-fraction scale is a factor of 2 to 5 in the limit at fixed f; below f of about 0.1 the limit is set by the galaxies' own mid-infrared emission, and below 0.03 also by the unsubtracted stellar photosphere and by WISE depth. Against the published record this is an extension, not a large tightening: it is comparable to Huang et al. (2026) at f = 0.2-0.3 and adds a temperature grid, per-galaxy normalisation and a curve down to f = 0.05.
1. Question
If a galaxy-wide civilisation intercepts a fraction f of a galaxy's starlight and re-radiates it at temperature T, the galaxy gains a mid-infrared component of luminosity f times its stellar luminosity. Early-type galaxies have little dust, so they are the cleanest place to look. For f = 0.01 to 0.5 and T = 100 to 600 K: what fraction of quiescent galaxies can host such reprocessing given public WISE photometry, and below what f does natural emission, not sensitivity, set the answer?
2. Data
| Source (access) | Rows | Use and cuts |
|---|---|---|
| SDSS DR17 early types, sample of the fp_kiii study (SkyServer SQL) | 221,433 parent, 114,210 kept | Main Galaxy Sample, r <= 17.77, 0.02 <= z <= 0.12, fracDeV >= 0.8, concentration >= 2.6, b/a >= 0.3, red-sequence g-r, 70 <= sigma <= 420 km/s, spectral S/N >= 10, theta_e > 0.5 arcsec, D4000 >= 1.6 |
| AllWISE Source Catalog (IRSA TAP, 6 arcsec match) | 113,644 matched; 113,158 valid | valid = source within 3 arcsec, W1 S/N >= 5, finite W2-W4 fluxes and errors |
| MPA-JHU emission lines (SkyServer) | 114,210 | S/N-gated classes: lineless 80,752, retired 24,955 (H-alpha EW 0.5-3 A), composite 3,921, AGN 3,433, star-forming 501, no usable measurement 648 |
| FIRST 10 arcsec, NVSS 20 arcsec (CDS XMatch) | 4,251 and 3,696 | radio counterparts, q22 |
| GALEX AIS (CDS XMatch, 4 arcsec) | 39,122 NUV matches | UV excess: NUV-r < 5 |
| Legacy Surveys DR9 forced WISE photometry (NOIRLab Data Lab) | 114,117 matched; 39,346 usable | cross-check only |
| Brown et al. 2014 SED atlas; WISE response curves | 16 passive ellipticals | stellar template, band synthesis |
| unWISE coadd FITS cut-outs (Legacy Surveys viewer); AllWISE stars (VizieR II/328) | 365 galaxies, 192 stars | image-level profile-fit test (new) |
| Legacy Surveys JPEG cut-outs | 85 objects | visual vetting |
Median galaxy: z = 0.084, M_r = -21.3, W1 = 1.0 mJy, sigma(W3) = 0.14 mJy, sigma(W4) = 1.0 mJy. W3 exceeds 3 sigma for 39% of galaxies, W4 for 4%.
Not obtained or not usable. AllWISE elliptical-aperture magnitudes
exist for only 30,271 galaxies and are not aperture-matched across
bands. Legacy forced W3/W4 errors are too small by factors of 1.7-1.9
(W3) and 2.3-3.7 (W4), measured here; the usable Legacy subsample
(39,346 of 94,745 matched, after a blending cut) is W3-bright selected
(median AllWISE W3/W1 of 0.35 against 0.26), so it is a cross-check
only. Published WISE PSF model files could not be fetched, so PSFs were
built from stars. IRSA returned HTTP 503 throughout the revision: a
cold-cache rerun of the AllWISE download is untested, and
run_all.py --analysis-only restarts from the merged table
in data/. No mid-infrared spectroscopy or far-infrared data
were used.
3. Method
Signal. With g = f/(1-f), the waste-heat flux in band b of a galaxy with W1 flux F1 is S_b = g R_b(T,z) F1 / (1 + g R_1). R_b is the flux of a blackbody of luminosity L at T, redshifted to z and passed through the WISE response, divided by the W1 flux of a stellar template of bolometric luminosity L (median of 16 passive ellipticals of Brown et al. 2014: L_bol/(nu L_nu)(W1) = 9.35, range 8.67-9.89). At z = 0.08, R_W3 and R_W4 are 5.0 and 36 at 150 K, 17 and 26 at 300 K, 11 and 6.8 at 600 K (where W2 also rises, R = 6.1).
Photometry. AllWISE profile-fit fluxes, used as signed fluxes with their errors. They exist for 99% of the sample including non-detections, and the test uses ratios to W1 measured the same way. Profile fitting loses flux in resolved galaxies; section 4.2 tests on images what that does to the band ratios of a host.
Test. For each galaxy and (f,T): testable if 0.8 S_b >= 5 sigma_b in W3 or W4; compatible if F_b >= 0.8 S_b - 2 sigma_b in W2, W3 and W4; candidate if both. The test is one-sided: a candidate is a galaxy that cannot be excluded as a host of at least f. The factor 0.8 is a 20% tolerance for model and photometry error; all limits are also given for a tolerance of 0.4 ("conservative").
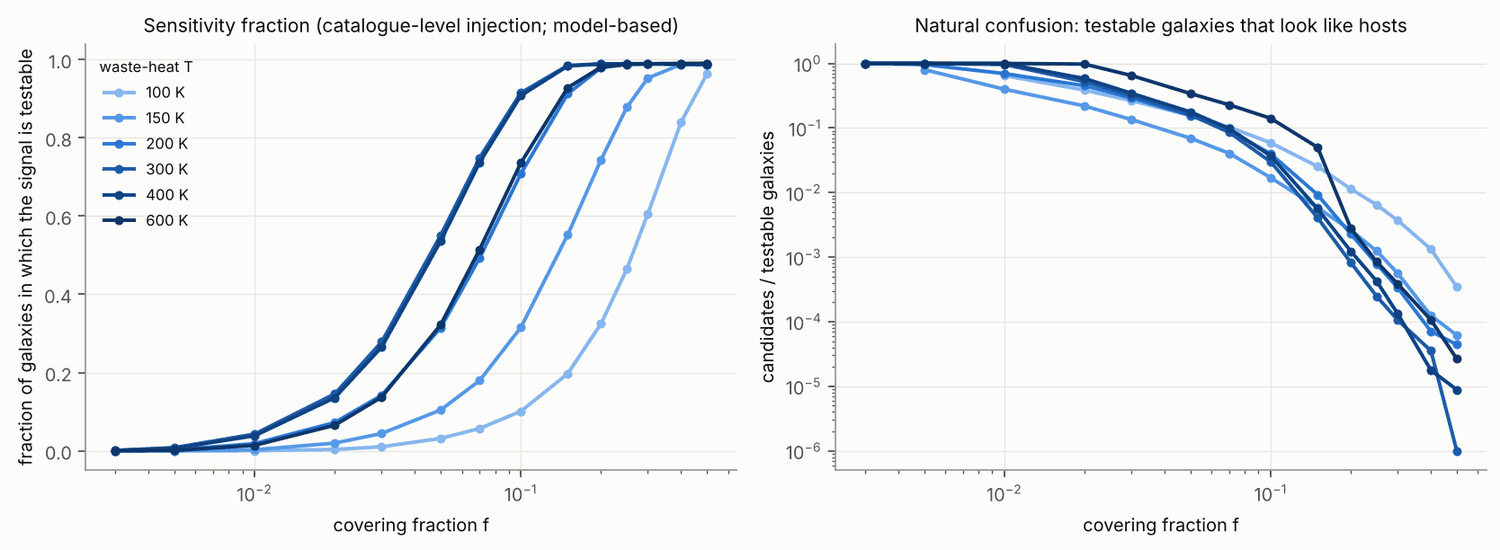
Sensitivity fraction. The predicted signal is added to every galaxy's real catalogue fluxes and the classification rerun. Because injection and threshold come from the same model, a testable injected host is recovered by construction (recovery 0.996-1.000). The resulting number is therefore a model-based sensitivity fraction (the share of galaxies in which the signal would exceed 5 sigma), not an image-level completeness. The limit is the Clopper-Pearson 95% bound on candidates/testable, divided by the recovery.
Two populations. "All outliers" counts every
candidate in the full sample. "Unexplained only" restricts numerator and
denominator to the clean subsample of 78,340 galaxies with no catalogue
sign of conventional power: lineless or retired spectrum with a valid
H-alpha fit, no FIRST/NVSS source, no UV excess, H-delta_A < 3,
unflagged and unblended W3/W4, and W1-W2 < 0.5 (waived where the
hypothesis itself predicts red W1-W2). All 37 clean candidates at f =
0.3 and a frozen random 48 at f = 0.1, 300 K were inspected on optical
and unWISE cut-outs (code/vetting_manual.csv).
4. Results
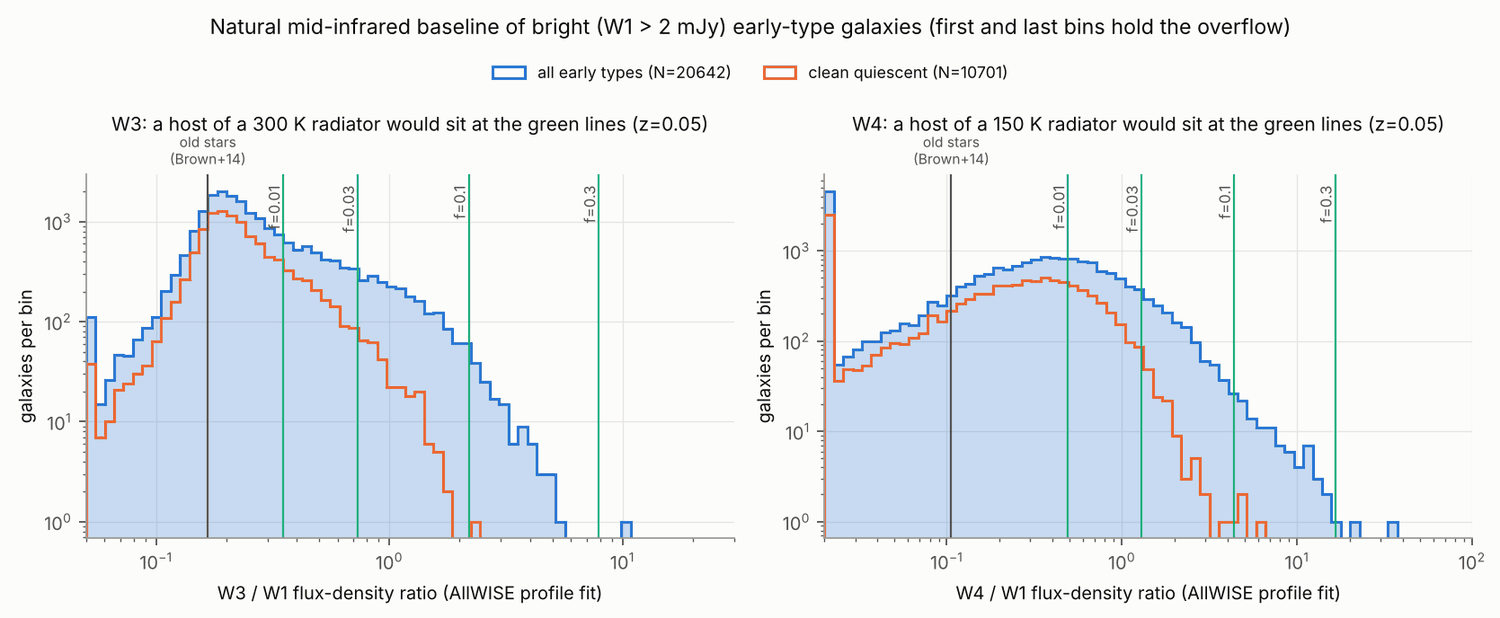
4.1 Natural baseline (Fig. 1)
For the 20,642 galaxies with W1 > 2 mJy the median W3/W1 flux ratio is 0.235 against 0.167 for the old-star template; W4/W1 is 0.26 against 0.106.
| Class | N (bright) | median W3/W1 | median W4/W1 |
|---|---|---|---|
| lineless | 11,609 | 0.195 | 0.16 |
| retired (weak lines) | 7,182 | 0.348 | 0.39 |
| star-forming | 82 | 1.04 | 1.35 |
| composite | 854 | 1.07 | 1.37 |
| AGN | 821 | 0.73 | 1.06 |
About 70% of the median 12 micron flux is the stellar photosphere. Expressed as the covering fraction of a 300 K radiator:
| median | 84th | 95th | 99th | 99.9th | |
|---|---|---|---|---|---|
| total W3 emission, all | 1.3% | - | 5.8% | 9.9% | 16% |
| excess over the photosphere, all | 0.37% | 2.1% | 4.9% | 9.2% | 16% |
| excess over the photosphere, clean | 0.26% | 1.1% | 2.2% | 4.2% | 6.9% |
Summed over all early types, the flux-weighted mean reprocessed fraction is below 1.1% (150-200 K), 1.6% (300 K), 2.1% (100 and 400 K) and 3.2% (600 K) even if all natural emission were waste heat (clean subsample 0.6% to 2.3%). The 100-300 K values rest on W4 and are uncertain by up to 40%: the Legacy photometry gives 35% more on its W3-bright subsample.
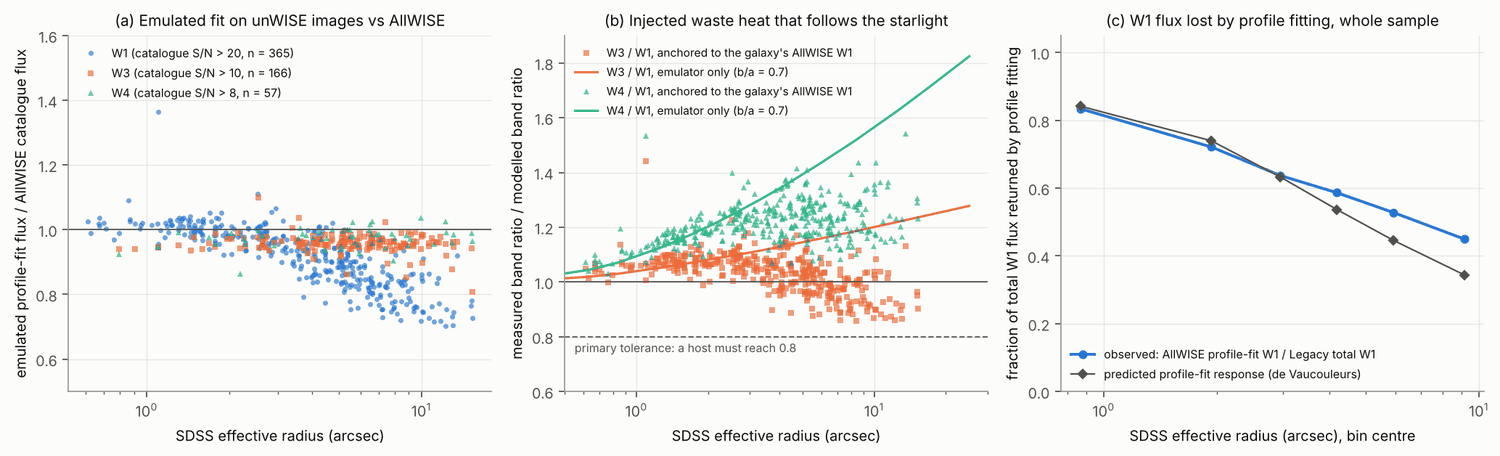
4.2 Does profile fitting return the modelled band ratios? (Fig. 5, new)
Effective PSFs for W1-W4 were built from 48 isolated unsaturated AllWISE stars per band on unWISE coadds (FWHM 6.3, 6.7, 6.7 and 12.4 arcsec; star-to-star scatter 1-2%). A linear profile fit with these PSFs was run on cut-outs of 365 sample galaxies (45 per effective-radius bin plus 95 that are bright in W3 or W4).
| Check | Result |
|---|---|
| Emulated fit / AllWISE catalogue, W3 (S/N > 10, n = 166) and W4 (S/N > 8, n = 57) | 0.96 and 0.98, flat with galaxy size |
| Emulated fit / AllWISE catalogue, W1, for theta_e < 2.5, 2.5-5, >= 5 arcsec | 1.01, 0.94, 0.83: AllWISE returns more W1 than a uniform-weight fit in large galaxies |
| W1 returned by AllWISE over Legacy total W1, whole sample, six size bins from 0.5-1.5 to above 7 arcsec | 0.83, 0.72, 0.64, 0.59, 0.53, 0.45; the de Vaucouleurs response model predicts 0.84, 0.74, 0.63, 0.54, 0.45, 0.34 |
| Injected de Vaucouleurs source (galaxy's own r_e and b/a): measured over modelled W3/W1 | emulator alone 1.02-1.24 (median 1.13); anchored to each galaxy's AllWISE W1: median 1.04, 5th-95th percentile 0.90-1.13, minimum 0.86 |
| Same for W4/W1 | emulator alone 1.04-1.70 (median 1.35); anchored: median 1.21, 5th-95th percentile 1.10-1.36, minimum 1.03 |
| Host test rerun with image-level injected waste heat | recovered 358/358 (f = 0.3, 150 K), 365/365 (0.3, 300 K), 244/244 (0.1, 150 K), 353/353 (0.1, 300 K), 309/309 (0.3, 100 K), 365/365 (0.3, 600 K) |
So for waste heat that follows the starlight, profile fitting returns W3/W1 within about -14% and +13% of the model (the low end only for galaxies with theta_e above 5 arcsec, 6% of the sample) and W4/W1 3% to 36% high, because the W4 beam is twice as wide. No galaxy falls below the 0.8 threshold, so the 20% tolerance is kept as primary and the W4-driven limits (100-200 K) are on the conservative side. This is an emulation on coadds, not a rerun of the AllWISE pipeline, and it says nothing about waste heat distributed differently from the stars.
What it does not explain: in W3- or W4-bright galaxies, Legacy forced photometry gives W3/W1 1.05-1.20 times, and W4/W1 1.35-1.54 times, the profile-fit ratio, and the referee measured about 1.15 times in W3 with the standard AllWISE aperture. All alternatives are redder than profile fitting, so this systematic is one-sided: if it applied to waste heat, the covering-fraction scale here would be about 10% optimistic. An aperture check on the images shows the natural W3 emission of 136 bright galaxies is on average as extended as the starlight (0.95 of the stellar extent), though 29% are more extended, so extended dust is at most part of the reason. The difference is carried as a systematic through the tolerance 0.3 and 0.4 limits and the Legacy variant.
4.3 Sensitivity fractions and limits (Figs. 2, 3)
Sensitivity fraction (share of all galaxies in which the signal is testable):
| T | f=0.01 | 0.03 | 0.1 | 0.3 |
|---|---|---|---|---|
| 100 K | 0.0001 | 0.010 | 0.10 | 0.61 |
| 150 K | 0.003 | 0.044 | 0.32 | 0.95 |
| 200 K | 0.018 | 0.14 | 0.71 | 0.99 |
| 300 K | 0.043 | 0.28 | 0.92 | 0.99 |
| 400 K | 0.038 | 0.27 | 0.91 | 0.99 |
| 600 K | 0.014 | 0.14 | 0.74 | 0.99 |
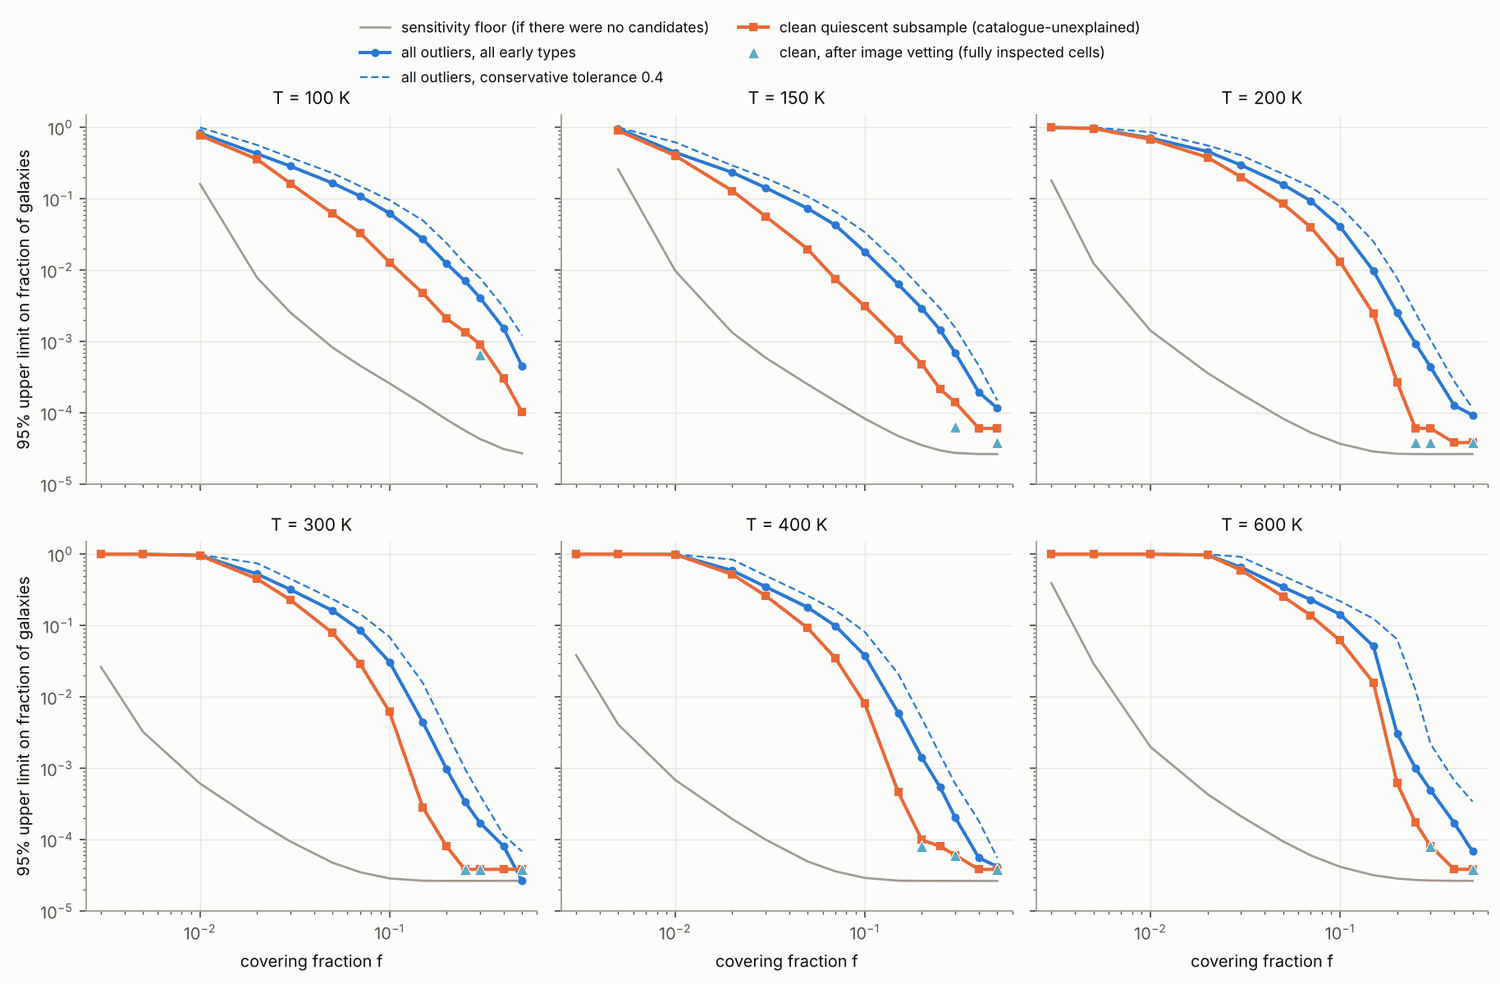
95% upper limit on the fraction of early types hosting at least f at T, all outliers: primary / conservative tolerance, with the candidates of the primary test in brackets.
| T | f=0.01 | 0.03 | 0.1 | 0.3 | 0.5 |
|---|---|---|---|---|---|
| 100 K | 0.83 | 0.29 / 0.38 | 6.3% / 9.6% | 4.1e-3 / 7.8e-3 (257) | 4.5e-4 / 1.2e-3 (38) |
| 150 K | 0.45 | 0.14 / 0.20 | 1.8% / 3.4% | 6.9e-4 / 1.6e-3 (61) | 1.2e-4 / 1.5e-4 (7) |
| 200 K | 0.71 | 0.30 / 0.41 | 4.1% / 7.8% | 4.4e-4 / 1.1e-3 (38) | 9.3e-5 / 1.2e-4 (5) |
| 300 K | 0.97 | 0.32 / 0.45 | 3.1% / 6.9% | 1.7e-4 / 4.2e-4 (12) | 2.7e-5 / 6.9e-5 (0) |
| 400 K | 1.0 | 0.35 / 0.50 | 3.8% / 8.2% | 2.0e-4 / 6.1e-4 (15) | 4.2e-5 / 5.6e-5 (1) |
| 600 K | 1.0 | 0.66 / 0.92 | 14% / 22% | 5.0e-4 / 2.2e-3 (43) | 6.9e-5 / 3.4e-4 (3) |
Unexplained outliers only (clean subsample, primary tolerance; candidates / testable):
| T | f=0.03 | 0.1 | 0.3 | 0.3 after image vetting | 0.5 |
|---|---|---|---|---|---|
| 100 K | 0.16 | 1.3% (76/7,108) | 9.2e-4 (30/44,480) | 6.5e-4 (20) | 1.0e-4 (3) |
| 150 K | 0.057 | 0.31% (52/21,044) | 1.4e-4 (5/74,700) | 6.4e-5 (1) | 6.1e-5 (1) |
| 200 K | 0.20 | 1.3% (642/52,035) | 6.1e-5 (1/78,162) | 3.8e-5 (0) | 3.9e-5 (0) |
| 300 K | 0.23 | 0.62% (404/70,981) | 3.8e-5 (0/78,204) | 3.8e-5 (0) | 3.9e-5 (0) |
| 400 K | 0.26 | 0.81% (523/69,647) | 6.1e-5 (1/78,204) | 6.1e-5 (1) | 3.8e-5 (0) |
| 600 K | 0.60 | 6.2% (2,700/45,229) | 8.2e-5 (2/77,123) | 8.2e-5 (2) | 3.8e-5 (0) |
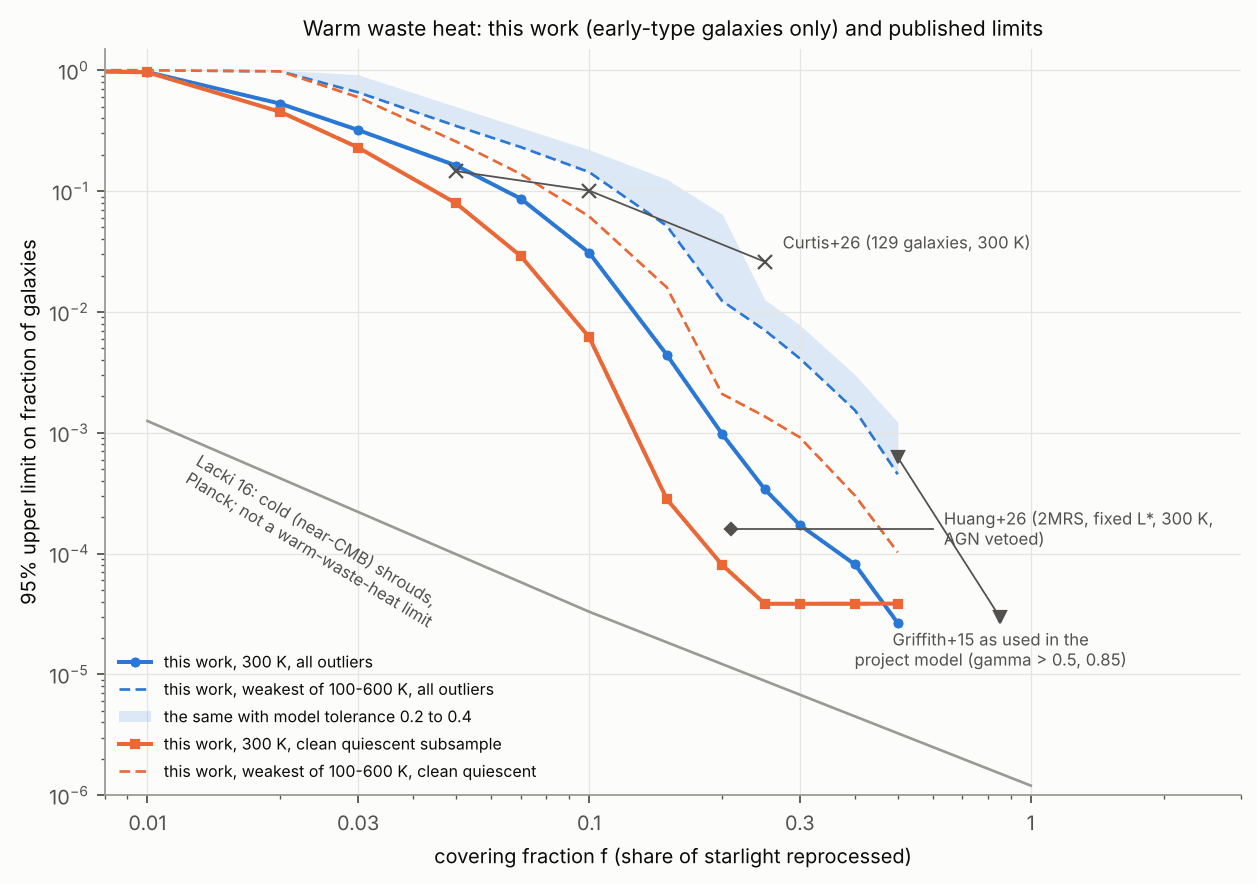
Limit curve by covering fraction (all outliers) and N_eff = 3/limit,
for early-type galaxies only
(data/headline_limits.csv; by temperature in
data/neff_by_temperature.csv):
| f | 300 K | weakest of 150-400 K | weakest of 100-600 K | the same, conservative | N_eff, 100-600 K: primary / conservative |
|---|---|---|---|---|---|
| 0.05 | 0.16 | 0.18 | 0.35 | 0.50 | 8.7 / 6.0 |
| 0.1 | 0.031 | 0.041 | 0.14 | 0.22 | 21 / 14 |
| 0.15 | 4.4e-3 | 9.8e-3 | 0.052 | 0.125 | 58 / 24 |
| 0.2 | 9.8e-4 | 2.9e-3 | 0.012 | 0.064 | 243 / 46 |
| 0.25 | 3.4e-4 | 1.4e-3 | 7.1e-3 | 0.013 | 426 / 238 |
| 0.3 | 1.7e-4 | 6.9e-4 | 4.1e-3 | 7.8e-3 | 729 / 385 |
| 0.4 | 8.1e-5 | 1.9e-4 | 1.5e-3 | 3.0e-3 | 2.0e3 / 995 |
| 0.5 | 2.7e-5 | 1.2e-4 | 4.5e-4 | 1.2e-3 | 6.6e3 / 2.5e3 |
The band envelope is set by 600 K up to f = 0.15 and by 100 K above. At 300 K the all-outlier limit falls to 10%, 1%, 0.1% and 1e-4 at f = 0.065, 0.13, 0.20 and 0.37 (conservative: 0.084, 0.16, 0.25, 0.43). These are fractions of the observed sample; hosts dimmed by (1-f) partly leave the magnitude-limited sample, so divide by 0.97, 0.85 and 0.67 at f = 0.1, 0.3 and 0.5 for a fraction at fixed pre-harvest luminosity.
4.4 Accounting for the outliers
- f = 0.3, 300 K: 12 candidates. Eight have emission lines (seven AGN-class, six of them with W1-W2 >= 0.87; one composite); the four lineless ones carry W4 artefact or blend flags and sit in scattered-light features. None is unexplained.
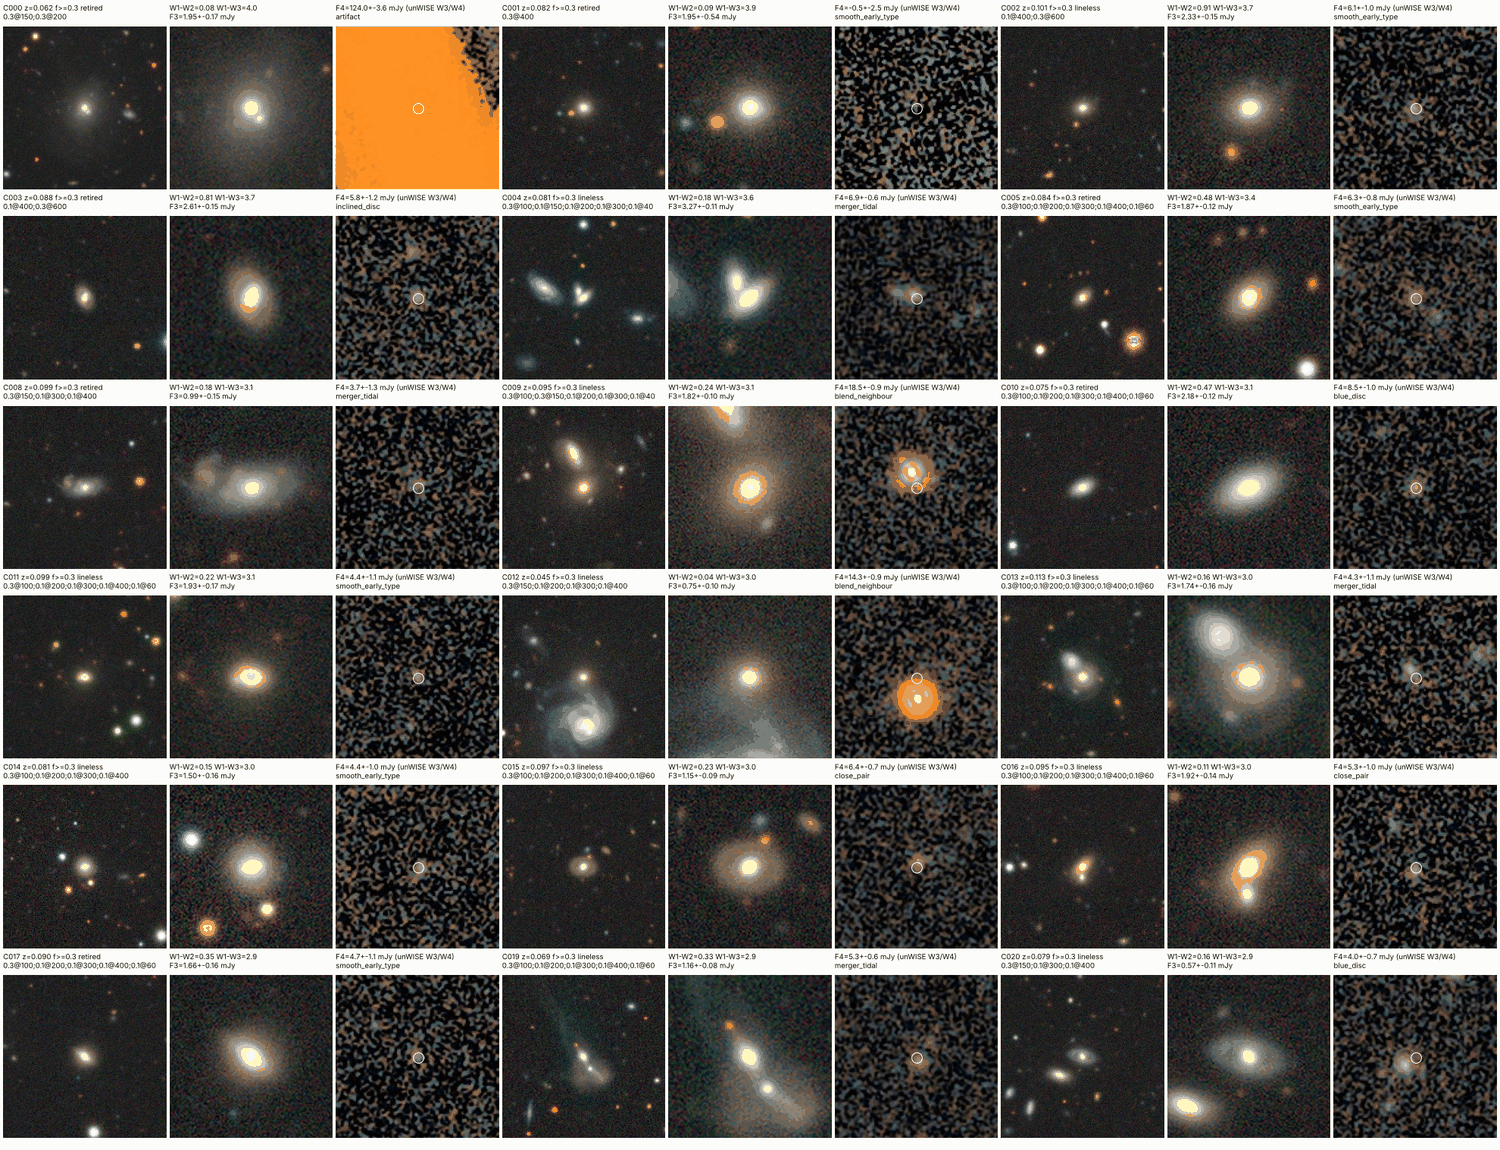
- f = 0.3, clean, any T: 37 galaxies
(
figures/supp_clean_candidates.png). Images explain 13 firmly (one W4 scattered-light band, seven with the source centred on a neighbour, five mergers); 15 have a possible but unproven explanation (ten disc galaxies, five close pairs); nine show nothing unusual. All 24 unremoved objects stay in the vetted limits. - f = 0.1, 300 K: 3,136 candidates: composite 1,200, AGN 807, retired 700, lineless 276, star-forming 137, no line data 16; 87% carry a catalogue flag. The 404 clean ones lean towards weak star formation (57% retired against 19% in the clean sample; median D4000 1.73 against 1.88). Of 48 inspected, 4 are firmly explained, 30 possibly (mostly discs) and 14 are smooth.
- Radio: of 12,343 candidates at f >= 0.1, 438 have a measured q22 (median 0.56, none above 2). Four radio-undetected candidates have q22 lower limits above 2 and all are W4 artefacts. FIRST's depth tests the mid-infrared/radio relation only for sources far brighter in W4 than the typical candidate.
4.5 What sets the limit
- f >= 0.3 (clean, 200-400 K) and f = 0.5 at 300 K (all): sample size; no or almost no candidates.
- f of 0.05 to 0.25: natural emission. At f = 0.1 the all-outlier limit is 220 to 3,400 times the zero-candidate floor (22 to 930 times for the clean subsample) although 71-92% of galaxies are testable at 200-400 K. Deeper photometry would not help here.
- f <= 0.03: three things jointly. The primary test does not subtract the photosphere, and at f = 0.01 the 300 K threshold (0.14 x W1) lies below the photosphere alone (0.17 x W1), so nearly every testable galaxy passes (4,700 candidates against 4,190 expected from photosphere plus noise). Real excess scatters by more than the signal. And WISE depth leaves only 4% (f = 0.01) and 28% (f = 0.03) of galaxies testable. Subtracting the bluest template photosphere in W3 and W4 gives:
| f=0.01 | 0.03 | 0.05 | |
|---|---|---|---|
| 300 K, primary | 0.97 | 0.32 | 0.16 |
| 300 K, photosphere subtracted | 0.38 | 0.19 | 0.11 |
| weakest of 100-600 K, photosphere subtracted | 0.52 | 0.29 | 0.21 |
The conclusion stands: no useful constraint at 1%, a weak one at 3%. The photosphere must not be subtracted in W2: the observed W2/W1 of bright sample galaxies lies below even the bluest template in 81-86% of cases, so a W2 subtraction would wrongly exclude hosts of 400-600 K waste heat. A first-pass variant did this; it is kept only as a labelled diagnostic.
5. Robustness checks
All-outlier limits at 300 K (clean subsample in brackets for the primary row):
| Variant | f=0.1 | f=0.3 | f=0.5 |
|---|---|---|---|
| primary | 3.1% (0.62%) | 1.7e-4 (3.8e-5) | 2.7e-5 (3.9e-5) |
| tolerance 0 / 0.3 / 0.4 | 1.3% / 4.7% / 6.9% | 1.3e-4 / 2.5e-4 / 4.2e-4 | 4.1e-5 / 2.7e-5 / 6.9e-5 |
| testability 4 or 7 sigma; compatibility 3 sigma | 3.4%, 2.8%; 5.0% | 1.7e-4, 1.6e-4; 2.3e-4 | 2.7e-5 |
| bolometric correction -8% / +8% | 3.9% / 2.6% | 2.4e-4 / 1.5e-4 | 2.7e-5 |
| photosphere subtracted (W3, W4) | 2.2% | 1.6e-4 | 2.7e-5 |
| profile-fit response applied to thresholds | 2.3% | 1.4e-4 | 2.7e-5 |
| W3 only / W4 only | 3.3% / 4.3% | 1.8e-4 / 1.8e-3 | 2.7e-5 / 1.8e-4 |
| Legacy forced W3 only (39,346 galaxies) | 7.4% | 5.9e-4 (15 candidates) | 1.2e-4 (1) |
| AllWISE on the same galaxies, W3 only | 6.0% | 2.3e-4 (4 candidates) | 7.7e-5 (0) |
| point-like / resolved in WISE | 3.2% / 3.0% | 1.6e-4 / 2.8e-4 | 4.5e-5 / 6.5e-5 |
| z < 0.06 / z >= 0.06 | 1.5% / 3.5% | 3.6e-4 / 1.7e-4 | 1.4e-4 / 3.3e-5 |
The Legacy photometry gives 15 candidates where AllWISE gives 4 in the same galaxies at f = 0.3 (134 against 62 at f = 0.2); this is the largest unexplained difference in the study. At 600 K the limit between f = 0.15 and 0.25 is very sensitive to the tolerance (3.1e-3 against 6.5e-2 at f = 0.2) because the W2 signal there is close to the unsubtracted W2 photosphere. At 100 K, 7 sigma testability cuts the clean f = 0.3 candidates from 30 to 6. Other checks: the sample's r/W1 colour is 0.97 of the template's, supporting the bolometric correction; injecting the signal with the measured profile-fit response leaves every limit unchanged; a scratch rerun of the analysis reproduces the tables byte for byte.
6. Limitations
- Red, concentrated SDSS early types at 0.02 < z < 0.12 only; spirals are not constrained.
- Single-temperature blackbody following the starlight. Grey bodies, temperature mixtures, waste heat concentrated in the outskirts and anything colder than about 100 K are not covered.
- The f scale is uncertain by about 20% (bolometric correction 8%; profile-fit response -14% to +13% in W3; unexplained, one-sided 5-20% photometry-method difference). Near f = 0.1-0.3 this is a factor of 2 to 5 in the limit at fixed f; the conservative column is the safe reading.
- The sensitivity correction is model-based. The image-level test is an emulation on 365 galaxies, not the AllWISE pipeline, and does not simulate deblending or artefact flagging.
- Limits come from the testable subset and assume hosts share the sample's W1 and depth distribution; at f <= 0.03 that subset is small and bright.
- The clean subsample depends on incomplete catalogues (3 arcsec fibre spectra, GALEX for 34%, radio to 1-2.5 mJy). Image vetting is by one inspector (an AI model) on JPEG cut-outs and is complete only at f = 0.3.
- A cold-cache rerun needs IRSA, which was down; everything after the
catalogue merge reruns from
data/.
7. Closest prior work and what is new
- Huang, Tao & Zhang 2026 (AJ 171, 131; arXiv:2601.07297): 19,617 2MRS galaxies, AGN and starbursts vetoed, one fixed stellar luminosity for all; 95% limit of 1.6e-4 for at least 21% reprocessing at 300 K (their sample-size floor).
- Curtis et al. 2026 (arXiv:2608.12458): SED fits with injection-recovery for 129 galaxies; fewer than 2.6% of galaxies at f = 25% (abstract), 10.1% at 10% and 14.6% at 5% (full text, as supplied by the referee); per-galaxy caps with a median of 0.3% in quiescent hosts without a dominant AGN.
- Griffith et al. 2015 (ApJS 217, 25): about 1e5 resolved WISE galaxies, none above 85%, 50 above 50%; no limit curve.
- Lacki 2016 (arXiv:1604.07844): Planck limits on near-CMB shrouds only.
- Garrett 2015; Chen & Garrett 2021: mid-infrared/radio tests. Ko et al. 2013, 2016: mid-infrared excess is common in quiescent red-sequence galaxies, so the natural floor found here is known astrophysics expressed as a covering fraction.
Matched-f comparison (all outliers; factor by which this work is tighter in brackets):
| Published limit | This work, 300 K | weakest of 150-400 K | weakest of 100-600 K |
|---|---|---|---|
| Curtis, f = 0.05: 14.6% | 16% | 18% | 35% |
| Curtis, f = 0.10: 10.1% | 3.1% (3.3) | 4.1% (2.5) | 14% (looser) |
| Curtis, f = 0.25: 2.6% (project model value) | 3.4e-4 (76) | 1.4e-3 (18) | 7.1e-3 (3.7; 2.1 conservative) |
| Huang, f >= 0.21: 1.6e-4 | 9.8e-4 at 0.2, 3.4e-4 at 0.25, 1.7e-4 at 0.3, 2.7e-5 at 0.5 | 2.9e-3 to 1.2e-4 | 1.2e-2 to 4.5e-4 |
| Griffith, f = 0.5, as used in the project model: 6.3e-4 | 2.7e-5 (23) | 1.2e-4 (5.4) | 4.5e-4 (1.4; looser by 2 conservative) |
Against Huang et al. the all-outlier 300 K limit is 6 times looser at f = 0.2, equal at 0.3 and 6 times tighter at 0.5. Their veto of AGN and starbursts makes the clean subsample the closer analogue: 8.1e-5 at f = 0.2 and 3.8e-5 from 0.25, two to four times tighter, which is simply the larger sample.
New here: about 113,000 spectroscopically quiescent galaxies, each normalised to its own W1 luminosity and redshift; a temperature grid from 100 to 600 K; the split between sensitivity floor and natural floor; an unexplained-only limit with a matching denominator; and an image-level test of profile-fit band ratios for star-following emission.
8. Implications for the Fermi Paradox
- The Lacki curve belongs to the very-cold band only. The project model already keeps separate warm and very-cold curves; this study confirms that the separation is needed. For warm waste heat in early types the limit is 3% to 14% at f = 0.1 (against 3e-5 on the cold curve) and absent at f = 0.01 (against 1e-3).
- A warm curve for the model, with conditions. The model's warm band is 100-600 K, so the matching numbers are the band envelope: N_eff of 21, 58, 243, 426, 729, 2.0e3 and 6.6e3 at f = 0.1, 0.15, 0.2, 0.25, 0.3, 0.4 and 0.5 (conservative: 14, 24, 46, 238, 385, 995, 2.5e3). The model now has nothing below f = 0.25, 115 at 0.25 and 4.8e3 at 0.5. The gain is therefore a factor of 2 to 4 at f = 0.25, none at 0.5, and new coverage from f = 0.1 to 0.2. The 150-400 K and 300 K curves are much tighter (N_eff 2.1e3 and 8.8e3 at f = 0.25) and may be used only with an explicit temperature prior. Every one of these numbers counts early-type galaxies: using them as a per-galaxy quantity assumes that the chance of hosting does not depend on morphology.
- Below f of about 0.05 the population is not constrained by WISE photometry. One early type in six (f = 0.05, 300 K) to essentially all (f = 0.01) cannot be told from hosts. The available statements are integral (mean reprocessed fraction below 1.1-1.6% at 150-300 K, uncertain by up to 40%) or come from other work: for a few tens of nearby quiescent galaxies with full SEDs, Curtis et al. report model-dependent per-galaxy caps with a median of 0.3%. Harvesting of 1-5% at room temperature is therefore not excluded for the population at large.
- Where better data would help. For f >= 0.05 the search is limited by natural emission and deeper photometry will not move it; mid-infrared spectroscopy or far-infrared SEDs that separate dust from a featureless blackbody would. For f <= 0.03 depth and photosphere modelling also matter.
Figures: fig1_baseline.png,
fig2_sensitivity.png, fig3_limits.png,
fig4_comparison.png,
fig5_profile_fit_response.png; supplementary contact sheet
supp_clean_candidates.png.
9. Response to referee
| Referee point | Action |
|---|---|
| 1. "Tightened by factors of 5 to 150" is unsupported; compare at matched f and with Huang et al. | Accepted. Claim removed. Section 7 compares at matched f with Curtis, Huang and Griffith; the opening paragraph says comparable to Huang at f = 0.2-0.3. f = 0.25 and 0.4 added to the grid. |
| 2. N_eff was offered for 150-400 K but the model band is 100-600 K; early types only | Accepted. headline_limits.csv carries the 100-600 K
envelope (primary and conservative) and
neff_by_temperature.csv the resolved table; the early-type
condition is stated with every N_eff. |
| 3. For T <= 200 K, tolerance 0.2 is smaller than the stated W4 uncertainty: use 0.4 or test on images | Both done. The image-level injection (section 4.2) shows profile-fit W4/W1 is 3-36% high, not low, for star-following emission, so 0.2 stays primary; tolerance-0.4 values are quoted beside every limit and in the opening paragraph. |
| 4. Variant range omitted the Legacy result; no f = 0.5 variants | Accepted. Ranges are now 1.3e-4 to 5.9e-4 (f = 0.3) and 2.7e-5 to 6.9e-5 (f = 0.5; 1.2e-4 on the Legacy subsample); all variants run at f = 0.2, 0.25 and 0.5; like-for-like AllWISE numbers on the Legacy subsample added. |
| 5. "Injection-recovery completeness" is true by construction | Accepted. Renamed sensitivity fraction in text, tables, columns and Fig. 2; recovery 0.996-1.000 stated in the method. |
| 6. The 1% floor was attributed to dust; it is mostly photosphere | Accepted. Floor given as excess over the photosphere; photosphere-subtracted limits added (corrected values, see below); section 4.5 says the limit at f <= 0.03 is set jointly by photosphere, scatter and depth. |
| 7. "Fully consistent with existing data" too strong; "deeper photometry will not help" too broad | Accepted. Now "not excluded for the population by WISE photometry", with the Curtis per-galaxy caps cited; the photometry statement is restricted to f >= 0.05. |
| 8. The profile-fit colour systematic is one-sided | Accepted in substance: the sentence that profile fitting "sits between the alternatives" is removed, the one-sidedness and its 10% effect on the f scale are stated, and tolerance 0.3 limits are tabulated. The proposed remedy is not adopted as primary; see below. |
| 9. Legacy error factors of 2.6 and 7 are not what the pipeline measures; subsample selection undocumented | Accepted. The old values predated the blending cut. Now 1.9 and 3.7 (the larger of the measured estimates); the Legacy limit at f = 0.3 moved from 6.2e-4 to 5.9e-4. Selection (39,346 of 94,745, W3-bright) documented. |
| 10. 648 failed H-alpha fits classed lineless | Accepted. Now "no data" and excluded from the clean subsample: 78,817 to 78,340 galaxies; clean candidates at f = 0.1, 300 K from 408 to 404; no f = 0.3 candidate affected. |
| 11. Inconsistent numbers | Fixed: 220 to 3,400 throughout; stack values carry the 40% W4 caveat and are quoted as f. |
| 12. The model already separates warm and very-cold curves | Accepted. Implication 1 reworded as a confirmation. |
Not accepted, with reasons. (a) Making tolerance 0.3 primary, or stating flatly that the f scale is 10% high: the image-level test gives a median measured/modelled W3/W1 of 1.04 (minimum 0.86) for star-following emission and recovers every image-level injected host, so the scale is not biased low for the hypothesis tested. The Legacy and aperture offsets concern the natural emission of W3-bright galaxies and remain unexplained, which is why the tolerance 0.3 and 0.4 limits are tabulated and the effect is stated conditionally. (b) The referee's photosphere-subtracted values (0.48 and 0.20 at 300 K) came from a variant that also subtracted a template W2; that subtraction is invalid (section 4.5), and the corrected values are 0.38 and 0.19. (c) "89% of Curtis et al.'s quiescent caps below 3%" could not be verified from the abstract and is not quoted.
Key numbers
| Quantity | Value | Uncertainty | Note |
|---|---|---|---|
| Sample: early-type galaxies with valid AllWISE photometry (clean subsample) | 113,158 (78,340) | parent 114,210 SDSS DR17 early types at 0.02<z<0.12; clean = no catalogue sign of AGN, star formation, radio source, UV excess or bad W3/W4 photometry; 648 failed H-alpha fits now excluded from clean | |
| 95% upper limit, fraction of early types hosting f >= 0.3 at 300 K, all outliers | 1.7e-4 | 1.3e-4 to 4.2e-4 across model/threshold variants on AllWISE (tolerance 0 to 0.4); 5.9e-4 with Legacy forced W3 on its W3-bright subsample; 1.8e-3 if W4 alone is used | 12 candidates of 113,156 testable; all 12 are AGN-class or W4 artefacts |
| 95% upper limit, f >= 0.3, weakest over 150-400 K, all outliers | 6.9e-4 | 1.6e-3 with tolerance 0.4 | set by 150 K (61 candidates) |
| 95% upper limit, f >= 0.3, weakest over 100-600 K (project model warm band), all outliers | 4.1e-3 | 7.8e-3 with tolerance 0.4 | set by 100 K, where only W4 sees the signal (257 candidates of 69,256 testable); N_eff = 729 (385) |
| 95% upper limit, f >= 0.5, all outliers: 300 K / weakest over 100-600 K | 2.7e-5 / 4.5e-4 | 6.9e-5 / 1.2e-3 with tolerance 0.4 | zero candidates at 300 K in the primary test; N_eff over the band 6.6e3 (2.5e3 conservative), against 4.8e3 in the project model |
| 95% upper limit, f >= 0.1, all outliers: 300 K / weakest over 100-600 K | 3.1% / 14% | 300 K: 1.3% to 7.4% across variants; band: 22% with tolerance 0.4 | limited by natural emission: 220 to 3,400 times the zero-candidate floor |
| 95% upper limit, f >= 0.03 and f >= 0.01, all outliers, range over 100-600 K | 14% to 66% (f = 0.03); 45% to 100% (f = 0.01) | with the W3/W4 photosphere subtracted, 300 K: 19% and 38%; only 28% and 4% of galaxies are testable at 300 K | |
| 95% upper limit, f >= 0.3, clean subsample (unexplained outliers only), by temperature 100/150/200/300/400/600 K | 9.2e-4 / 1.4e-4 / 6.1e-5 / 3.8e-5 / 6.1e-5 / 8.2e-5 | after image vetting: 6.5e-4 / 6.4e-5 / 3.8e-5 / 3.8e-5 / 6.1e-5 / 8.2e-5 | 0 candidates of 78,204 testable at 300 K; 30 of 44,480 at 100 K |
| 95% upper limit, f >= 0.1, clean subsample, 300 K | 0.62% | 0.17% to 2.1% across model/threshold variants | 404 candidates of 70,981 testable; they lean towards weak star formation and discs |
| N_eff = 3/limit for early types, weakest over 100-600 K, at f = 0.1, 0.15, 0.2, 0.25, 0.3, 0.4, 0.5 | 21, 58, 243, 426, 729, 2.0e3, 6.6e3 | conservative (tolerance 0.4): 14, 24, 46, 238, 385, 995, 2.5e3 | early-type galaxies only; project model currently has 0 below f = 0.25, 115 at 0.25 and 4.8e3 at 0.5 |
| Covering fraction at which the 300 K all-outlier limit falls to 10%, 1%, 0.1%, 1e-4 | f = 0.065, 0.13, 0.20, 0.37 | 0.084, 0.16, 0.25, 0.43 with tolerance 0.4 | clean subsample: 0.045, 0.090, 0.13, 0.19 |
| Natural 12 micron emission expressed as a 300 K covering fraction: excess over the stellar photosphere, bright early types (W1 > 2 mJy) | median 0.37%, 95th percentile 4.9%, 99th 9.2% | clean subsample 0.26%, 2.2%, 4.2%; total emission including photosphere: median 1.3% | |
| Flux-weighted mean reprocessed fraction of all early types, 95% upper limit | 1.1% (150-200 K), 1.6% (300 K), 2.1% (100 and 400 K), 3.2% (600 K) | up to 40% at 100-300 K (W4 photometry) | assumes all natural mid-infrared emission is waste heat |
| Image-level profile-fit response to star-following emission, measured/modelled W3/W1 and W4/W1 (365 galaxies, anchored to AllWISE W1) | W3: median 1.04, minimum 0.86; W4: median 1.21, minimum 1.03 | W3 5th-95th percentile 0.90-1.13; W4 1.10-1.36 | no galaxy below the 0.8 tolerance; image-level host recovery 100% in six (f,T) cases; emulation on unWISE coadds, not the AllWISE pipeline |
| Comparison with Huang et al. 2026 (1.6e-4 for f >= 0.21 at 300 K) | all outliers: 9.8e-4 at f=0.2, 3.4e-4 at 0.25, 1.7e-4 at 0.3, 2.7e-5 at 0.5 | 6 times looser at 0.2, equal at 0.3, 6 times tighter at 0.5; like-for-like clean subsample 8.1e-5 at 0.2 and 3.8e-5 from 0.25 (2 to 4 times tighter) |
Changes made after the referee report
- Removed the claim that the limits tighten prior work by factors of 5 to 150. Added a matched-f comparison with Curtis et al. 2026, Huang et al. 2026 and Griffith et al. 2015 (data/prior_work_comparison.csv, Fig. 4, report section 7); the headline now says the result is comparable to Huang et al. at f = 0.2-0.3.
- Added f = 0.25 and 0.4 to the grid and envelopes over 150-400 K and over the project model's 100-600 K warm band, for primary and conservative tolerance, to data/headline_limits.csv; added data/neff_by_temperature.csv. Every N_eff is labelled early-type galaxies only.
- New step code/s09_image_injection.py: image-level test of profile-fit band ratios on unWISE coadd cut-outs (empirical PSFs from 48 stars per band, emulated PSF fit, de Vaucouleurs injection for 365 galaxies, host test rerun on image-level injected fluxes). New Fig. 5 and five new tables in data/.
- Tolerance 0.3 and 0.4 limits are now computed on the full grid and the tolerance-0.4 values are quoted beside every headline number; two new engine variants apply the measured profile-fit response to the injection and to the thresholds.
- All variants now run at f = 0.2, 0.25 and 0.5 as well; the quoted variant ranges include the Legacy photometry (5.9e-4 at f = 0.3, 300 K); like-for-like AllWISE limits on the Legacy subsample were added.
- Renamed 'injection-recovery completeness' to 'catalogue-level sensitivity fraction' in text, table columns and Fig. 2, and stated that recovery is 0.996-1.000 by construction.
- Natural floor now given as excess over the stellar photosphere as well as total emission; photosphere-subtracted limits added at f = 0.01 to 0.05; the statement that deeper photometry will not help is restricted to f >= 0.05.
- Found and fixed an invalid step in the inherited photosphere-subtracted variant: it subtracted a template W2 that is redder than the observed W2/W1 of 81-86% of bright sample galaxies. Subtraction is now W3/W4 only; the old version is kept as a labelled diagnostic and a template check was added to data/phot_checks.json.
- Legacy error-inflation factors corrected from 2.6 (W3) and 7.2 (W4) to the measured 1.9 and 3.7; the selection of the usable Legacy subsample (39,346 of 94,745, W3-bright) is now documented with numbers.
- 648 galaxies with failed H-alpha fits are now classed 'no data' instead of 'lineless' and excluded from the clean subsample (78,817 to 78,340 galaxies; clean candidates at f = 0.1, 300 K from 408 to 404; no f = 0.3 candidate affected).
- Vetting set B is frozen from code/vetting_manual.csv so the inspected objects do not change when the clean sample changes; the contact sheet moved to figures/supp_clean_candidates.png.
- Numbers made consistent (limit/floor ratio 220 to 3,400; stack limits quoted as f with a 40% W4 caveat); implications rewritten (Lacki curve statement is a confirmation of the model's existing separation; population at f < 0.05 'not excluded by WISE photometry' with Curtis et al. per-galaxy caps cited).
- run_all.py reordered (image-level test after the master table; digest before figures) and the full pipeline rerun: 13.6 minutes with cached downloads. A separate analysis-only rerun in a scratch copy reproduced every table byte for byte except the neighbour-list columns of candidates_clean.csv, which need the network step.
Referee points not accepted
- Adopting tolerance 0.3 (or 0.4) as the primary analysis, or stating flatly that the covering-fraction scale is 10% high: not adopted. The image-level injection test gives a measured/modelled W3/W1 of 1.04 in the median (5th percentile 0.90, minimum 0.86) and W4/W1 of 1.21 (minimum 1.03) for star-following emission, and 100% recovery of image-level injected hosts, so profile fitting is not biased low for the hypothesis tested. The Legacy and aperture colour offsets the referee measured concern the natural emission of W3-bright galaxies and remain unexplained; the report states that this systematic is one-sided and that the f scale would be about 10% optimistic if it applied to waste heat, and tabulates tolerance 0.3 and 0.4 limits beside the primary ones.
- The referee's photosphere-subtracted limits at 300 K (0.48 at f = 0.01 and 0.20 at f = 0.03) are not quoted. They came from the first-pass variant that also subtracted a template W2 photosphere, which is invalid for this sample (observed W2/W1 lies below the bluest template in 81-86% of bright galaxies). With subtraction restricted to W3 and W4 the values are 0.38 and 0.19; the referee's conclusion that the photosphere, not dust, sets the f = 0.01 result is accepted.
- The referee's statement that 89% of the Curtis et al. quiescent per-galaxy caps lie below 3% is not quoted, because I could verify only the abstract (median cap 0.3%); the per-fraction limits 14.6% and 10.1% are quoted as supplied by the referee from the full text and marked as such.
Figures
Code
Every number above is produced by these scripts from public data. The data tables themselves are not hosted here; the scripts download them.
mirq_common.py run_all.py s01_download.py s02_build.py s03_model.py s04_baseline.py s05_limits.py s06_vetting.py s07_figures.py s08_report_numbers.py s09_image_injection.py
Referee report
A second, separate analysis re-ran the code, recomputed the main numbers by its own route and tried to break the result. Like the first, it was run by Claude for this project; it is not an outside expert. In its report “the analyst” is the first analysis, which wrote the paper, and file names that are not linked on this page are its own working files. The paper above is the version revised in response.
Verdict: sound with fixes. Results reproduced: yes.
WHAT I RAN.
Full rerun of the entry point from the merged tables: copied code/ and data/master_slim.csv.gz + model_grid.npz to a scratch copy and ran
run_all.py --analysis-only --no-images(271 s, single thread). limits_primary.csv, limits_variants.csv, limits_vetted.csv, headline_limits.csv, limit_crossings.csv, feq_percentiles.csv, stack_limits.csv, baseline_by_class.csv, fmax_percentiles.csv, phot_checks.json, vetting_summary.json, limits_summary.json, candidates_f0.1plus.csv and report_numbers.txt are byte-identical to the analyst's. Only candidates_clean.csv differs (neighbour-list columns, because I skipped the network step). Every number I checked in the report tables (limits, counts, completeness, crossings, N_eff, variants, stack values, floor ratios) matches these files.Independent recomputation (referee/indep.py), different route: raw allwise_match.csv re-matched by me (113,365 within 3 arcsec, 113,158 valid: same as analyst); my own signal model that does not use the analyst's code or the response curves (monochromatic Planck function at T/(1+z) times the published Wright et al. colour corrections, stellar K-correction as a power law, bolometric correction 9.0 instead of 9.35). Result: R_W3(300 K, z=0.08) = 16.2 (16.8 when rescaled to the analyst's 9.35; analyst 17). Candidates / 95% limit: f=0.3, 300 K: 19 of 113,156, 2.5e-4 (analyst 12, 1.7e-4; my model is 4% less sensitive, equal to the analyst's 'kbol_low' variant which gives 18, 2.4e-4). f=0.1, 300 K: 3,813 of 101,876, 3.8% (analyst 3.1%). f=0.5, 300 K: 0 of 113,158, 2.65e-5 (identical). f=0.3, 150 K: 80, 9.0e-4 (analyst 61, 6.9e-4). A pure colour cut gives the same order: W1-W3 >= 4.33 with W3 S/N >= 3: 14 galaxies (1.2e-4). The headline numbers therefore reproduce to within the analyst's stated model systematic.
Other checks: (a) AllWISE DN zero points 20.5/19.5/18.0/13.0 reproduce w?mpro to 0.0006 mag in all four bands. (b) My own integration of five Brown et al. templates gives L_bol/(nu L_nu)(W1) = 8.6 to 9.7, matching model_templates.csv to about 1%; a back-of-envelope from BC_K = 2.4 and K-W1 = 0.15 gives 8.7. (c) 3,000 random sample galaxies cross-matched to the VizieR copy of AllWISE (II/328) through CDS XMatch: 2,980 matches, same as the master table, magnitudes equal to rounding. (d) Joins: 114,210 unique ids, no row duplication; only 46 galaxies share an AllWISE source with another sample galaxy. (e) Images: I downloaded optical and unWISE W3/W4 cut-outs for the four lineless f=0.3, 300 K candidates (all sit in obvious W4 scattered-light bands or a latent blob) and for six of the thirteen 'image-explained' clean candidates (two have the mid-infrared source centred on a neighbour, four are mergers or tidal systems). The analyst's classifications hold in all ten. (f) Citations: arXiv API confirms Huang, Tao & Zhang 2026 (AJ 171, 131; f95 about 1.6e-4 for at least 21% at 300 K), Curtis et al. 2026 (arXiv:2608.12458; full text confirms 14.6%, 10.1%, 2.6% at 5, 10, 25%), Griffith et al. 2015, and Lacki 2016 (full text confirms 1.2e-6, 1 in 810,000, and 'very roughly' 1 in 30,000 at tau 0.1 and 1 in 800 at 0.01, all for near-CMB blackboxes in Planck). Ko et al. 2013 and 2016 exist as described.
NOT TESTED: a cold-cache run of the download step. IRSA TAP still returns HTTP 503 today, as the analyst reported.
Strongest objection
The covering-fraction axis rests on AllWISE point-source (profile-fit) photometry of resolved galaxies, a single-temperature blackbody, and a catalogue-level injection that cannot fail, while the limit curve is extremely steep between f=0.1 and 0.3 (two orders of magnitude). An expert would say: (i) the photometry choice alone moves W3/W1 by 5-20% and W4/W1 by up to 40%, and the analyst's own Legacy photometry gives four times as many f=0.3 candidates in the same galaxies; (ii) nothing verifies that profile fitting returns the modelled band ratios for extended waste heat, since no image-level injection was done; (iii) below f of about 0.2 the 'limit' is simply the known frequency of dusty, star-forming and active early types re-expressed as a covering fraction, and it applies to early types only.
Does the conclusion survive? Yes, as a band rather than a curve of sharp numbers. Under every variant I ran or checked (tolerance 0 to 0.4, bolometric correction +-8%, 3 sigma compatibility, Legacy photometry, my independent model): 30% reprocessing at 150-400 K is limited to between about 1e-4 and 1.6e-3 of early types counting every outlier; 50% at 300 K to below about 3e-5 to 7e-5; 10% is limited only at the 1-8% level; 3% and below are effectively unconstrained. The image checks confirm that the f=0.3, 300 K outliers are AGN or WISE artefacts. For hosts whose waste heat follows the starlight the profile-fit test is, if anything, conservative for the natural contaminants. What does not survive is the headline comparison with prior work ('5 to 150 times tighter') and the use of the 150-400 K, early-type-only curve as the project model's N_eff for a 100-600 K band covering all galaxies.
Errors found
- major. Headline claim that 'the published warm
limits at f of 0.25-0.5 are tightened by factors of roughly 5 to 150' is
not supported against the full published record. It compares only with
the two values the project model currently holds (Curtis et al. at
f=0.25, Griffith et al. at f=0.5) and ignores Huang, Tao & Zhang
2026, which the study itself cites and plots.
- Evidence: Huang et al. give 1.6e-4 for at least 21% at 300 K. This study's all-outlier 300 K limit is 9.8e-4 at f=0.2 (6 times looser) and 1.7e-4 at f=0.3 (equal); it is tighter only at f=0.4-0.5 (8e-5, 2.7e-5 against a 1.5e-4 plateau). The study's own Fig. 4 shows the Huang point below the blue all-outlier curve. The factor 150 comes from dividing Curtis at f=0.25 (2.6e-2) by this study at f=0.3 (1.7e-4); at matched f=0.25 the factor is about 60 at 300 K and about 18 for the weakest of 150-400 K.
- Fix: Replace with: 'tightens the values the project model currently adopts by about 20-60 at f=0.25 and 5-25 at f=0.5 (150-400 K); relative to Huang et al. 2026 it is comparable at f=0.2-0.3 and up to 6 times tighter at f=0.5, 300 K, with the difference that each galaxy is normalised to its own luminosity and AGN are not vetoed'.
- major. The N_eff curve offered to the project model
is the weakest limit over 150-400 K, but the model's warm band is
defined as 100-600 K (models/model4.py line 127: p_warm = 'waste heat
emerges at 100-600 K'). At the band edges the limits are 3 to 25 times
weaker, so the offered curve overstates what the data exclude for that
band. It is also an early-type-only limit being offered for a per-galaxy
(Milky Way equivalent) quantity.
- Evidence: Envelope over 100-600 K from limits_primary.csv (all outliers): f=0.1: 14% (600 K), N_eff 21; f=0.15: 5.2%, 58; f=0.2: 1.2% (100 K), 243; f=0.3: 4.1e-3 (100 K), 729; f=0.5: 4.5e-4, 6.6e3. The report offers 74, 310, 1.0e3, 4.3e3, 2.6e4. Against the model's current 115 at f=0.25 and 4.8e3 at f=0.5 the full-band envelope is only about 3.7 and 1.4 times tighter.
- Fix: Give the model either the 100-600 K envelope (21, 58, 243, 729, 6.6e3) or a temperature-resolved table with an explicit temperature prior, and state that it applies to early-type hosts only (the model must either scale by the early-type share or assume host probability is independent of morphology). Add the envelope to data/headline_limits.csv.
- major. For the W4-driven temperatures (100-200 K)
the primary model tolerance (20%) is smaller than the analyst's own
stated photometric uncertainty on W4/W1 (40%; Legacy forced W4/W1 is 1.4
times the profile-fit ratio). If the Legacy ratio is the right one for
emission that follows the starlight, a true host would measure 0.71 of
the predicted W4 and fail the 0.8 threshold, so the quoted 100-200 K
limits are not demonstrably conservative.
- Evidence: Report section 3 and limitations ('40% for the W4-driven 100-150 K cases'); phot_checks.json colour_ratio_w4_median 1.40-1.42. The analyst's eps=0.4 variant gives, at f=0.3: 7.8e-3 (100 K), 1.6e-3 (150 K), 1.1e-3 (200 K) instead of 4.1e-3, 6.9e-4, 4.4e-4; at f=0.1: 9.6%, 3.4%, 7.8% instead of 6.3%, 1.8%, 4.1%. A PSF argument suggests profile fitting should if anything overestimate W4/W1 for extended emission (12 arcsec beam against 6), but this was not shown.
- Fix: Either headline the eps=0.4 values for T <= 200 K, or demonstrate with an image-level injection on a few dozen resolved galaxies (unWISE coadds, star-following profile) that profile-fit W4/W1 is not biased low, and then keep eps=0.2.
- minor. The 'injection-recovery completeness' is a
catalogue-level operation that is close to tautological: the model flux
is added to the catalogue flux and tested against 0.8 times the same
model flux. Recovery efficiency is 0.996-1.000 everywhere, so
'completeness' is simply the fraction of galaxies for which the
predicted signal exceeds 5 sigma. It does not test the one thing that
could fail, namely whether profile-fit photometry of resolved galaxies
returns the modelled W3/W1 and W4/W1 for a real extended source.
- Evidence: limits_primary.csv recov_eff column; s05_limits.py _classify. The 10% amplitude scatter cannot matter against a 20% tolerance.
- Fix: Call it 'sensitivity (testability) fraction from catalogue-level injection' rather than completeness, and say in the headline description that the correction is model-based, not image-based.
- minor. The reason given for 'no constraint at 1%'
is misattributed to natural dust. About 70% of the median 12 micron flux
is the stellar photosphere (template W3/W1 = 0.167 of the observed
0.235), which is predictable from W1 and was not subtracted in the
primary test. At f=0.01 the 0.8 x signal threshold (0.137 x W1) lies
below the photosphere alone, so every galaxy is 'compatible' by
construction. WISE depth also matters there: only 4% (f=0.01) and 28%
(f=0.03) of galaxies are testable at 300 K.
- Evidence: Analyst's own photosphere-subtracted variant: 300 K limits 0.48 (f=0.01) and 0.20 (f=0.03) instead of 0.97 and 0.32. feq_percentiles.csv: excess over the template is equivalent to f = 0.37% at the median (0.26% clean), 4.9% at the 95th and 9.2% at the 99th percentile, against 1.3%, 5.8%, 9.9% for total emission.
- Fix: State the floor as excess over the photosphere (median 0.4%, 95th percentile 4.9%, 99th 9.2%), report the photosphere-subtracted limits at f <= 0.03 alongside the primary ones, and restrict 'deeper photometry will not help' to f >= 0.05. The qualitative conclusion (no useful constraint at 1%, weak at 3%) stands.
- minor. The quoted variant range for the f=0.3, 300
K all-outlier limit ('1.2e-4 to 4.2e-4') omits the analyst's own
Legacy-photometry variant (6.2e-4), and the Legacy cross-check is not
like-for-like: its fracflux_w3 < 0.5 cut keeps only 39,346 of 94,745
matched galaxies and preferentially keeps W3-bright ones.
- Evidence: Among the Legacy-usable galaxies the AllWISE candidate rate at f=0.1, 300 K is 5.4% against 3.0% for the whole sample (median AllWISE W3/W1 0.35 against 0.22). In the same 39,150 galaxies Legacy photometry gives 16 candidates at f=0.3 where AllWISE gives 4. Also, no variant was run at f=0.5: I find 0 candidates for eps up to 0.3, 3 candidates at eps=0.4 (6.9e-5) and 1 with Legacy photometry.
- Fix: Quote the range as 1.2e-4 to 6.2e-4 at f=0.3 and 2.7e-5 to about 7e-5 at f=0.5 (300 K); note the W3-bright selection of the Legacy subsample; add f=0.5 to the variants table.
- minor. The report says the Legacy W3/W4 errors are
underestimated 'by factors of about 2.6 and 7 (measured here)', but the
pipeline's own re-measurement gives smaller numbers.
- Evidence: data/phot_checks.json empirical_error_scale: W3 1.69 (from the 2.3rd percentile) and 1.85 (16th); W4 3.73 and 2.26. The adopted 2.6 and 7.2 are hard-coded in s05_limits.py. With 1.8 and 3.7 the Legacy W3-only limits change little (f=0.3: 5.6e-4; f=0.1: 7.4%).
- Fix: Correct the sentence to the measured 1.7-1.9 (W3) and 2.3-3.7 (W4), or show where 2.6 and 7.2 come from.
- minor. The statement that the profile-fit W3/W1
ratio 'sits between the alternatives' leans on the AllWISE
elliptical-aperture magnitudes (0.75 times), which are not
aperture-corrected across bands. The two PSF-aware comparisons both say
profile fitting gives a W3/W1 that is low by 5-20% for quiescent
galaxies, which uses up most of the 20% tolerance before the 8%
bolometric-correction spread is added.
- Evidence: My check on master.csv: an uncorrected 13.75 arcsec circular aperture gives W3/W1 of 0.73-0.87 times the profile-fit ratio in every class, including point-like sources, so the 0.75 is at least partly aperture loss. Legacy forced photometry: 1.05-1.21 (analyst). AllWISE standard curve-of-growth-corrected aperture: 1.15 (lineless), 1.13 (retired), 1.0 (SF, composite, AGN).
- Fix: Describe the systematic as one-sided (profile-fit W3/W1 probably 5-20% low for star-following emission), and either adopt eps=0.3 as primary (f=0.3, 300 K: 19 candidates, 2.5e-4; f=0.2: 1.6e-3) or state that the nominal f values should be read as about 10% larger.
- minor. Implication 3 ('a civilisation harvesting
1-5% of an elliptical's starlight at room temperature is fully
consistent with existing data') overlooks the per-galaxy result of
Curtis et al. 2026, which the study cites for other numbers.
- Evidence: Curtis et al. (arXiv:2608.12458, abstract and conclusions): per-galaxy 95% caps with a median of 0.3% for quiescent atlas galaxies without a dominant AGN, 89% of them below 3%, from full SED fits. This is the same order as this study's own median excess over the photosphere (0.26-0.37%).
- Fix: Reword to: 'not excluded for the population at large by WISE photometry; for a few tens of nearby quiescent galaxies with full SEDs Curtis et al. report model-dependent per-galaxy caps below 1-3%'.
- minor. 648 galaxies whose MPA-JHU H-alpha
measurement failed (flux = 0, error <= 0) are classed 'lineless'
rather than 'nodata', so they can enter the clean subsample without a
line measurement.
- Evidence: sdss_lines.csv joined to the sample: 648 rows with h_alpha_flux_err <= 0; s02_build.py sets 'nodata' only where the flux is NaN.
- Fix: Treat err <= 0 as nodata. Effect on the clean sample is under 1%.
- minor. Small inconsistencies between the summary of
results and the report: the f=0.1 all-outlier limit is '100 to 3400
times above the floor' in the table of key numbers but 220 to 3,400 in
the report (the tables give 219 to 3,445); the stack values (1.1-1.6%)
are quoted without the photometric systematic that the report assigns to
W4/W1.
- Evidence: limits_primary.csv ul_all/ul_zero at f=0.1; stack_limits.csv (the 150-300 K values are W4-driven).
- Fix: Use 220 to 3,400 in both places; quote the stack as 'about 1.1-1.6%, uncertain by up to 40% from the W4 photometry'.
Overclaims
- 'The published warm limits at f of 0.25-0.5 are tightened by factors of roughly 5 to 150': true only against the Curtis and Griffith values in the project model, at mismatched f for the factor 150; against Huang et al. 2026 the all-outlier limit is 6 times looser at f=0.2, equal at 0.3 and at most 6 times tighter at 0.5.
- N_eff of 74-97 (f=0.1), 310-680, 1.0e3-3.1e3, 4.3e3-1.7e4, 2.6e4-1.1e5 offered for the model's warm band: these are for 150-400 K or 300 K only. Over the model's 100-600 K band the values are 21, 58, 243, 729, 6.6e3, and they describe early types only.
- 'Completeness-corrected' and 'injection-recovery': the injection is at catalogue level with recovery efficiency 0.996-1.000 by construction; the correction is a model-based sensitivity fraction.
- 'Natural dust, not WISE depth, sets the limit everywhere below f of about 0.2-0.3' and 'the median early type already emits as much as a 300 K radiator covering 1.3%': at f <= 0.03 most of that emission is the unsubtracted stellar photosphere (median excess over it is 0.4%), and only 4-28% of galaxies are testable, so depth and test design share the blame there.
- 'A civilisation harvesting 1-5% of an elliptical's starlight at room temperature is fully consistent with existing data': true for WISE photometry of the population, but Curtis et al. report per-galaxy caps of median 0.3% for quiescent atlas galaxies.
- 'Deeper photometry will not help': supported for f >= 0.05, not for f <= 0.03 where most galaxies are not testable at WISE depth.
- Variant range '1.2e-4 to 4.2e-4' for f=0.3, 300 K: the analyst's own table reaches 6.2e-4 with Legacy photometry.
- The 100-200 K limits (for example 6.9e-4 at f=0.3, 150 K; 1.8% at f=0.1, 150 K) are quoted with a 20% tolerance although the stated W4 photometric uncertainty is 40%; the eps=0.4 values are about twice as large.
- 'No galaxy is compatible with 50% at 300 K': holds for tolerance up to 0.3; three galaxies are compatible at tolerance 0.4 and one with Legacy photometry. The limit moves from 2.7e-5 to about 7e-5, so the statement should carry that range.
Novelty check
Novel: partly. The measurement is new in its specifics, not in kind. Huang, Tao & Zhang 2026 already published a WISE limit curve by waste-heat threshold and temperature for 19,617 2MRS galaxies (plateau about 1.6e-4 above 21% of a fixed Milky Way luminosity at 300 K), and Curtis et al. 2026 already did injection-recovery by covering fraction (129 galaxies, full SEDs) and named large samples as the next step. What this study adds, and I found no prior example of it in arXiv or web searches: a sample of about 113,000 spectroscopically quiescent early types; normalisation of each galaxy to its own W1 luminosity and redshift; a temperature grid from 100 to 600 K; an explicit split between the sensitivity floor and the natural-emission floor; and an unexplained-only limit with a matching denominator. That mid-infrared excess is common in quiescent red-sequence galaxies is known (Ko et al. 2013, 2016), so the 'natural floor' finding is a restatement of known astrophysics in covering-fraction units. The analyst's own 'medium' confidence and prior-work list are fair; the headline comparison with prior limits is not (see errors).
- Huang, Tao & Zhang 2026, AJ 171, 131 (arXiv:2601.07297): WISE/CatWISE limits for 19,617 2MRS galaxies, f95 about 1.6e-4 for at least 21% at 300 K
- Curtis et al. 2026, arXiv:2608.12458 (G-HAT V): SED-fit injection-recovery on 129 galaxies; under 14.6%, 10.1%, 2.6% at 5, 10, 25%; per-galaxy caps median 0.3% in quiescent hosts
- Griffith et al. 2015, ApJS 217, 25 (G-HAT III): about 1e5 resolved WISE galaxies, none above 85%, 50 above 50%
- Lacki 2016, arXiv:1604.07844: Planck limits on near-CMB blackboxes (1.2e-6; very roughly 1 in 30,000 at tau 0.1, 1 in 800 at 0.01)
- Garrett 2015 and Chen & Garrett 2021: mid-infrared/radio correlation tests
- Ko et al. 2013 (arXiv:1302.6644) and 2016 (arXiv:1602.07772): mid-infrared excess in quiescent red-sequence and early-type galaxies
- Suazo et al. 2022 (Project Hephaistos I): the stellar-scale analogue of a partial-coverage limit curve
Required changes
- Headline, last sentence: delete 'tightened by factors of roughly 5 to 150'. Replace with the matched-f comparison against the model's current values (about 20-60 at f=0.25, 5-25 at f=0.5 for 150-400 K) and add that against Huang, Tao & Zhang 2026 the all-outlier limit is comparable at f=0.2-0.3 and up to 6 times tighter at f=0.5, 300 K.
- Implications item 2 and data/headline_limits.csv: add the envelope over the full 100-600 K band (95% limits 14%, 5.2%, 1.2%, 4.1e-3, 4.5e-4 at f=0.1, 0.15, 0.2, 0.3, 0.5; N_eff 21, 58, 243, 729, 6.6e3) and say that this, not the 150-400 K curve, matches the model's warm band unless the model adopts a temperature prior. Keep the 'early types only' label on every N_eff and state that the model must not apply it to all galaxies without an explicit assumption.
- Results tables, T = 100, 150, 200 K: either replace the primary values with the eps=0.4 variant (f=0.3: 7.8e-3, 1.6e-3, 1.1e-3; f=0.1: 9.6%, 3.4%, 7.8%) or add an image-level injection test showing profile-fit W4/W1 is not biased low for star-following emission. Until then quote both values in the headline (for example '6.9e-4 to 1.6e-3 at 150 K').
- Headline and key numbers: quote the f=0.3, 300 K all-outlier limit as 1.7e-4 with a range of 1.2e-4 to 6.2e-4 (include the Legacy variant), and the f=0.5, 300 K limit as 2.7e-5 with a range to about 7e-5. Add f=0.5 to limits_variants.csv.
- Section 3 and the title-level description: rename 'injection-recovery completeness' to a catalogue-level sensitivity (testability) fraction and state that recovery is 0.996-1.000 by construction; keep the limitation about no image-level injection but move it next to the method, not only in the limitations list.
- Section 4.1 and 4.4, and the headline sentence on the 1% case: give the natural floor as excess over the stellar photosphere (median 0.37% all, 0.26% clean; 95th percentile 4.9%; 99th 9.2% at 300 K) next to the total-emission numbers, add the photosphere-subtracted limits at f=0.01 and 0.03 (0.48 and 0.20 at 300 K), and say that at f <= 0.03 the limit is set jointly by the unsubtracted photosphere, the scatter in real excess and WISE depth (4% and 28% testable).
- Implications item 3: change 'fully consistent with existing data' to 'not excluded for the population by WISE photometry', and cite the Curtis et al. per-galaxy caps (median 0.3% in quiescent atlas galaxies). Item 4: restrict 'deeper photometry will not move the limit' to f >= 0.05.
- Section 3 (photometry) and limitations: replace 'the profile-fit ratio sits between the alternatives' with the one-sided statement that PSF-aware comparisons put profile-fit W3/W1 5-20% low for quiescent galaxies and that the elliptical-aperture ratio is not aperture-corrected; either make eps=0.3 the primary tolerance or say the nominal f scale should be read about 10% high.
- Section 2 'Not obtained' and s05_limits.py docstring: correct the Legacy error-inflation statement to the values the pipeline measures (1.7-1.9 for W3, 2.3-3.7 for W4) or document the source of 2.6 and 7.2; note that the Legacy-usable subsample is W3-bright selected (fracflux_w3 < 0.5 keeps 39,346 of 94,745).
- s02_build.py line_classes: classify rows with h_alpha_flux_err <= 0 (648 galaxies) as 'nodata' and rerun; report the (small) change in the clean subsample.
- Key numbers: change '100 to 3400 times above the zero-candidate sensitivity floor' to 220 to 3,400 to match the report and the tables; attach 'uncertain by up to 40% (W4 photometry)' to the stack values of 1.1-1.6%.
- Implications item 1: note that the project model already keeps separate warm and very-cold curves (model4.py warm_curve and verycold_curve), so the point is a confirmation that the Lacki curve must stay confined to the very-cold band, not a correction of the model.