Where is everybody? · Working papers
How hard have we looked for a second origin of life?
Revised after a second, separate analysis run for this project tried to break it. Neither analysis is an outside expert.
How thoroughly have we already looked for a second origin of life? (revised after referee review)
Summary. The search record for a second origin of life (Earth's single tree plus all Solar System data) is far from the "thorough search" that Model 4.1 treats as a future observation, and what it is worth today is small and of undetermined sign. Scored as a pure null, it raises P(no other civilisation has ever arisen in the Galaxy) from 0.778 ± 0.0014 (Monte Carlo) by +0.003 if a habitat's detection chance does not grow with the number of origins in it, +0.009 if each origin persists independently, and +0.026 if every origin is a separate chance of detection (the model's own functional form, which I regard as an upper bound). On those three readings the chance that the evidence in hand would have shown a second origin, if life starts easily, is 3%, 9% and 25%, against 87% for the model's thorough search. But the record is not a pure null: if the Cheyava Falls potential biosignature is given a likelihood ratio above about 1.1 to 1.4 in favour of past life, the net effect is zero or negative (-0.013 to -0.020 at a ratio of 2). So the evidence in hand moves the answer by between about -0.02 and +0.03, against +0.09 for a thorough null and -0.21 for a confirmed detection. Main caveats: every completeness factor (76 rows) is my structured judgement, not a measurement, and the database counts describe effort without setting any factor; the ranges quoted "over factor draws" are narrower than the spread from likelihood structure and from the scoring of Mars; shifts are paired differences (Monte Carlo error 0.0001 to 0.001), absolute values carry ±0.0014.
Question
Model 4.1 treats "a thorough search finds no second origin" as a hypothetical observation worth +0.09 on P(no other civilisation ever). How much of that search has already been done, what is the record to date worth, and what will the funded missions add?
Data
Fetched on 2026-10-12 by code/fetch_public_counts.py and
code/fetch_pubmed_counts.py (raw responses cached;
--refresh re-downloads). Single entry point:
code/run_all.py.
| Source | What was taken | Rows |
|---|---|---|
| MGnify API | totals; 491 biome classes; pipeline-5.0 analysis summaries; genome catalogue | 23,552 analyses; 56,782 genomes |
| GTDB R232 | taxon counts; genome metadata | 901,341 genomes |
| NCBI, ENA, PRIDE, MetaboLights | record counts | 60 count rows |
| PubMed | 18 method queries plus 5 union queries | 23 |
Model 4.1 (models/model4.py, copied, run
unmodified) |
8 seeds x 60,000, plus 4 camps x 4 seeds | 480,000 + 960,000 |
data/completeness_factors.csv |
my judgements (low / most likely / high, with basis) | 76 |
Cuts: assemblies under 1,000 contigs dropped (16,762 of 18,341 kept); read sets under 10,000 reads dropped (4,937 of 5,211). Host-associated assemblies were fetched at every fourth API page. The model file's md5 at the final run is 77ebee72...; it differs from the first-pass file (24028ed6...) in three comment lines only, and the per-seed results are identical. Mission status (checked by web search): NASA's FY2026 appropriation "does not support the existing Mars Sample Return program" (no funded return of Perseverance's cores); Rosalind Franklin launches no earlier than late 2028; Tianwen-3 returns at least 500 g about 2031; MMX is scheduled to launch 20 October 2026 and had not flown on the date of this report; Europa Clipper tours 2031-2034 with no life-detection instrument; Dragonfly arrives late 2034; ESA's Enceladus lander is in study (landing about 2052 if adopted). I found no 2026 resolution of the Cheyava Falls features.
Method
Lambda is the model's abiogenesis parameter (expected independent origins per 5.6-Gyr window of an Earth-like planet; the "fast camp" is lambda 1 to 1000). For each habitat h: q = probability it was habitable long enough; o = its opportunity in units of that window; c = probability that the evidence in hand would already have shown an independent origin had one happened, built as c = 1 - prod_groups[1 - s d], d = 1 - prod_pathways(1 - success x f x p), with s = the life persists or is preserved where that group of searches looks, f = share of such places sampled, p = probability of recognition. For Earth, c = persist x c_alive, with c_alive summed over four classes (sequence-readable or not, abundant or rare).
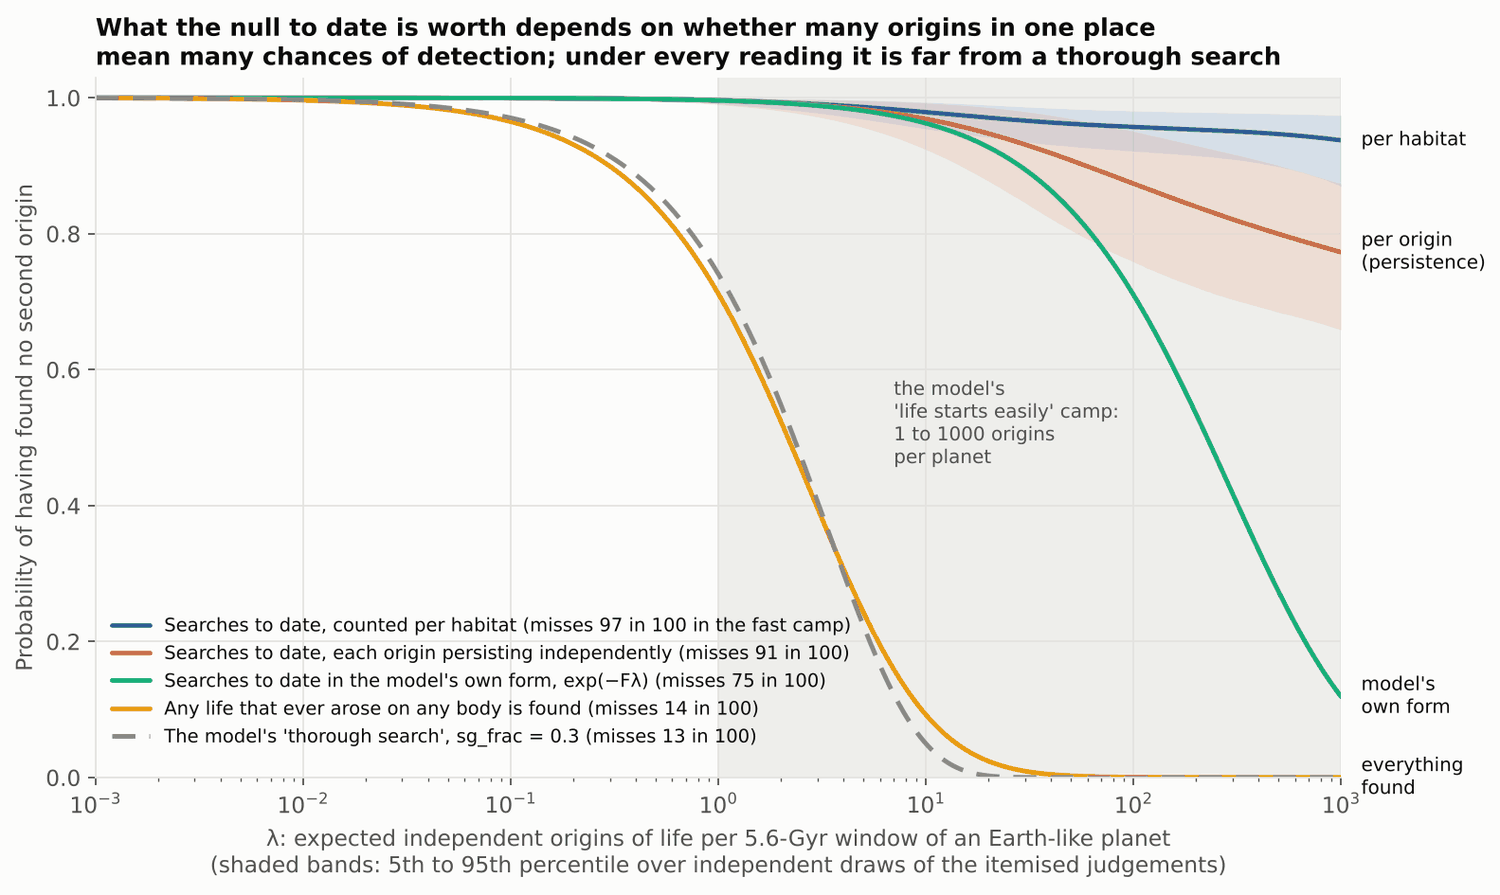
How detection grows with the number of origins in one habitat is a modelling choice that the factor table does not settle, and it matters because the whole update comes from the fast camp. Three structures are carried side by side (mu = o x lambda):
- Per habitat (first pass): L_h = 1 - q c (1 - exp(-mu)). Fates are fully correlated; ten origins on Mars are no easier to find than one.
- Per origin for persistence: each origin survives or
is preserved independently (Poisson thinning by s, or by
persiston Earth); sampling and recognition still act once per habitat. - Per origin for every factor: L_h = 1 - q + q exp(-mu c), essentially exp(-F lambda) with F = sum of q c o. This is the model's own form, exp(-sg_frac x lambda), with sg_frac = F.
All three agree for lambda much less than 1. F (median 0.0029) is therefore only a small-lambda exposure: it is not comparable with the model's sg_frac = 0.3 in the fast camp, and the like-for-like comparison is the detection chance D_fast = 1 - mean of L over the fast camp. My view of the structures: the share of a planet sampled and an instrument's recognition probability do not improve because life started many times, so the third is an upper bound; persistence is the open case. Incumbent advantage argues for correlated fates on Earth, while the Raup & Valentine (1983) calculation I cite for the persistence factor is per origin with independent fates and supports the larger number.
Factor uncertainty is propagated by 20,000 draws (triangular or log-triangular, independent). The model's kept samples are re-weighted by the likelihood. Check: the model's internal "thorough null" (0.8712) and "confirmed" (0.5716) results are reproduced to four decimals. Cheyava Falls is scored by multiplying the likelihood by 1 + (LR - 1) x sB x P(Mars had a native origin | lambda), where LR is the likelihood ratio of the features for life in that mud against none, and sB (0.1 / 0.4 / 0.8, a new row in the factor table) is the probability that a Martian biosphere lived there.
Results
Earth. The sequence census is enormous and blind to anything without standard nucleic acids.
| Quantity | Value |
|---|---|
| NCBI SRA experiments, metagenomic source | 9,341,864 |
| MGnify samples (amplicon / shotgun) | 435,812 (363,761 / 48,945) |
| Metagenome-derived genome assemblies, NCBI | 894,647 |
| GTDB species clusters; share with no cultured isolate | 199,923; 80% of bacteria, 89% of archaea |
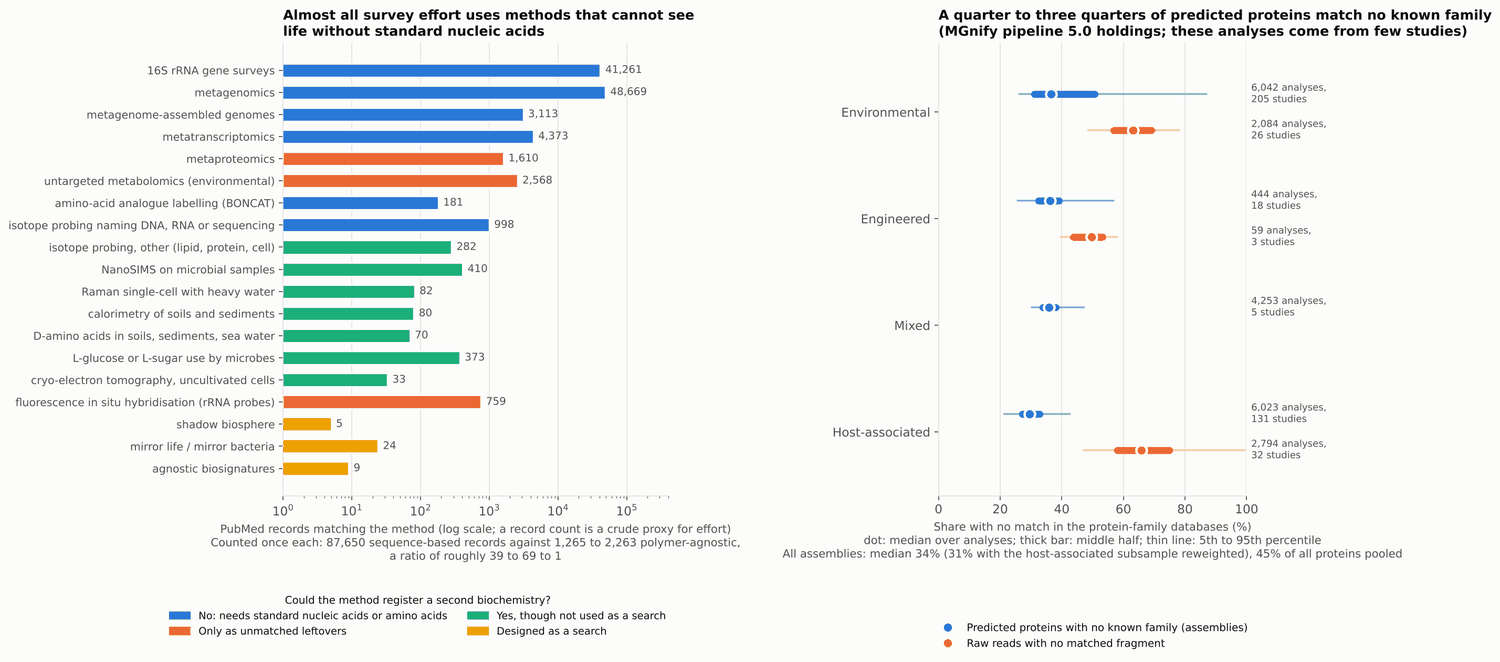
| Predicted proteins with no known family, MGnify assemblies | unweighted median 34% (5-95%: 25-73%); 31% with host-associated reweighted; 45% of all proteins pooled |
| Raw reads with no matched protein fragment | median 64% |
These percentages describe MGnify pipeline-5.0 holdings, not the biosphere: the 16,762 assemblies come from 359 studies (two supply a quarter) and the 4,937 read sets from 60. I did no follow-up on the unassigned share; the literature that did finds ordinary life: 1.17 billion unmatched proteins fall into 106,198 families (Pavlopoulos et al. 2023), and the candidate phyla radiation and obelisks (Zheludev et al. 2024) use standard nucleic acids.
| Method class (PubMed, each record counted once) | Records | Could it register a second biochemistry? |
|---|---|---|
| 16S surveys, metagenomics, MAGs, metatranscriptomics | 87,650 | No |
| Metaproteomics; untargeted metabolomics | 1,610; 2,568 | Only as unmatched leftovers |
| Isotope probing, NanoSIMS, Raman-heavy-water, calorimetry, D-amino acids, L-sugars, cryo-tomography | 2,263; 1,265 without the 998 isotope-probing records that name DNA, RNA or sequencing | Yes, but none designed as a search |
| Explicit: "shadow biosphere", mirror life, agnostic biosignatures | 37 | Yes |
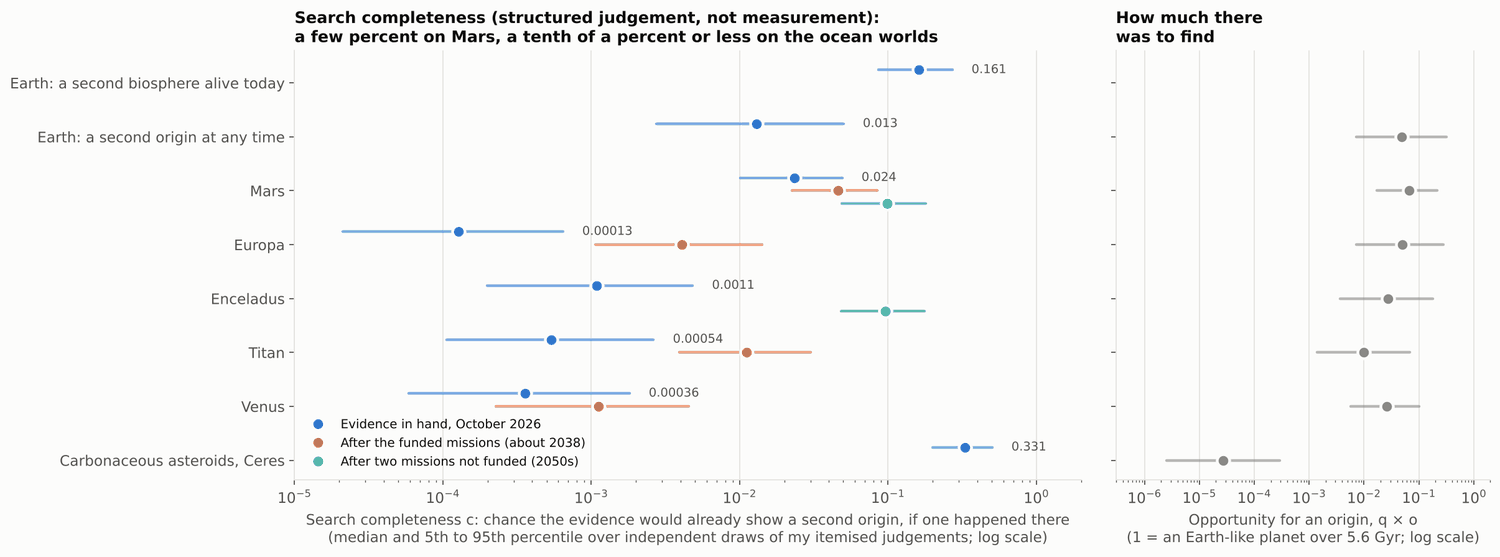
Sequence-based effort outnumbers polymer-agnostic effort by roughly 40 to 70 to 1 (a crude proxy). Judged result: c_Earth = 0.16 (0.09-0.27) for a second biosphere alive today; 0.013 (0.003-0.05) for a second origin at any time, the second being the first times persistence (0.1, range 0.01-0.5: out-competed, or fused into one tree by early gene exchange). See Figure 1.
Solar System (median, 5-95% over independent factor draws; Figure 2).
| Habitat | q | o | c today | c after funded missions (~2038) | c with unfunded missions (2050s) |
|---|---|---|---|---|---|
| Earth (second origin ever) | 1 | 0.049 | 0.013 (0.003-0.05) | same | same |
| Mars | 0.94 | 0.072 | 0.024 (0.010-0.049) | 0.046 (0.023-0.085) | 0.099 (0.049-0.18), cores returned |
| Europa | 0.76 | 0.068 | 0.0001 | 0.004 (Clipper, 2031-34) | same |
| Enceladus | 0.76 | 0.037 | 0.001 | same | 0.096 (lander, ~2052) |
| Titan | 0.33 | 0.031 | 0.0005 | 0.011 (Dragonfly, from 2035) | same |
| Venus | 0.33 | 0.083 | 0.0004 | 0.001 | same |
| Asteroids, Ceres | 0.87 | 0.00003 | 0.33 (0.20-0.50) | same | same |
Behind the Mars row: rover work is taken to have sampled a quarter of ancient habitat types with a recognition probability of 0.05; Viking's GC-MS would have missed up to several million cells per gram and perchlorate destroys organics on heating; Cassini could not tell cells from abiotic organics (Affholder et al. 2022: over 100 plume passes needed); Venus phosphine is contested; returned asteroid samples are well studied (Bennu's amino acids are racemic) but small bodies offer almost no opportunity.
What the record is worth, scored as a pure null (Figure 3).
| Detection chance if life starts easily, D_fast | Shift in P(no other civilisation ever) | Same shift in the model's own form needs sg_frac = | |
|---|---|---|---|
| Per habitat | 0.03 (0.014-0.058) | +0.0029 ± 0.0001 | 0.0002 |
| Per origin for persistence | 0.09 (0.040-0.155) | +0.0087 ± 0.0003 | 0.0007 |
| Per origin for every factor (model's form, sg_frac = F) | 0.25 (0.10-0.42) | +0.026 ± 0.001 | 0.003 |
| Model's "thorough search" | 0.87 | +0.093 | 0.3 |
Ranges in brackets are over independent factor draws; ± is Monte Carlo over seeds. Hybrids fall between: Earth per origin with other bodies per habitat gives +0.007; Earth fully per origin with others per origin for persistence gives +0.015. Earth's single tree contributes +0.001 to +0.005 and Mars +0.0015 to +0.004. Under my opportunity judgements the Solar System's habitats sum to 0.24 (0.11-0.53) of one Earth-window, 0.32 (0.15-0.69) with a second origin on Earth, so finding any life that ever arose on every body gives D_fast 0.87 and P = 0.871: that is what sg_frac = 0.3 corresponds to. Finding everything that still survives or is preserved gives 0.851 to 0.860.
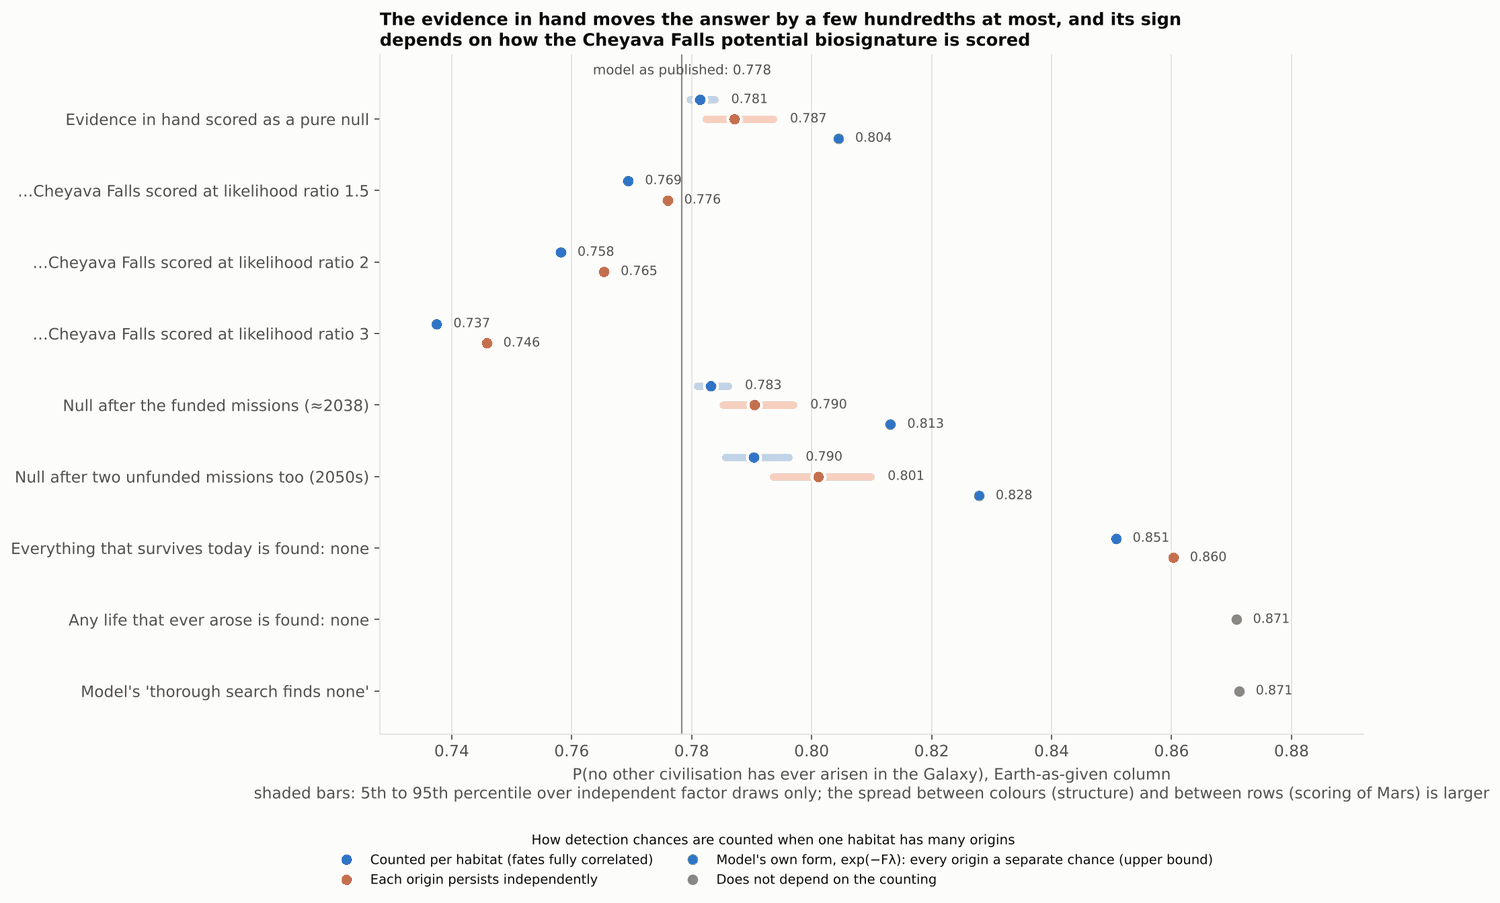
The record with Cheyava Falls, and after future nulls (Earth-as-given column; Figure 4). Values are for per habitat / per origin for persistence / the model's form; brackets are 5-95% over independent factor draws only.
| Scenario | P(no other civilisation ever) | P(life starts easily) |
|---|---|---|
| No update | 0.778 ± 0.0014 | 0.199 |
| Evidence in hand as a pure null | 0.781 (0.780-0.784) / 0.787 (0.782-0.794) / 0.804 | 0.194 / 0.182 / 0.149 |
| ...Cheyava Falls at likelihood ratio 1.5 | 0.769 / 0.776 | 0.217 / 0.204 |
| ...at likelihood ratio 2 | 0.758 / 0.765 | 0.239 / 0.225 |
| ...at likelihood ratio 3 | 0.737 / 0.746 | 0.279 / 0.263 |
| Null after funded missions, ~2038 | 0.783 (0.781-0.786) / 0.790 (0.785-0.797) / 0.813 | 0.190 / 0.176 / 0.132 |
| Null after two unfunded missions too, 2050s | 0.790 (0.786-0.796) / 0.801 (0.794-0.810) / 0.828 | 0.176 / 0.155 / 0.103 |
| Any life that ever arose is found: none | 0.871 | 0.021 |
| Model's "thorough search finds none" | 0.871 | 0.020 |
| Model's "independent origin confirmed" (15% false alarms) | 0.572 | 0.60 |
The break-even likelihood ratio, at which Cheyava Falls exactly cancels the null, is 1.12 per habitat and 1.39 per origin (1.07-1.53 and 1.21-2.69 for sB from 0.8 to 0.1). Nobody can currently say the ratio is below that, so the sign of the net update is not determined. The future rows assume the Cheyava cores, if returned, come back negative.
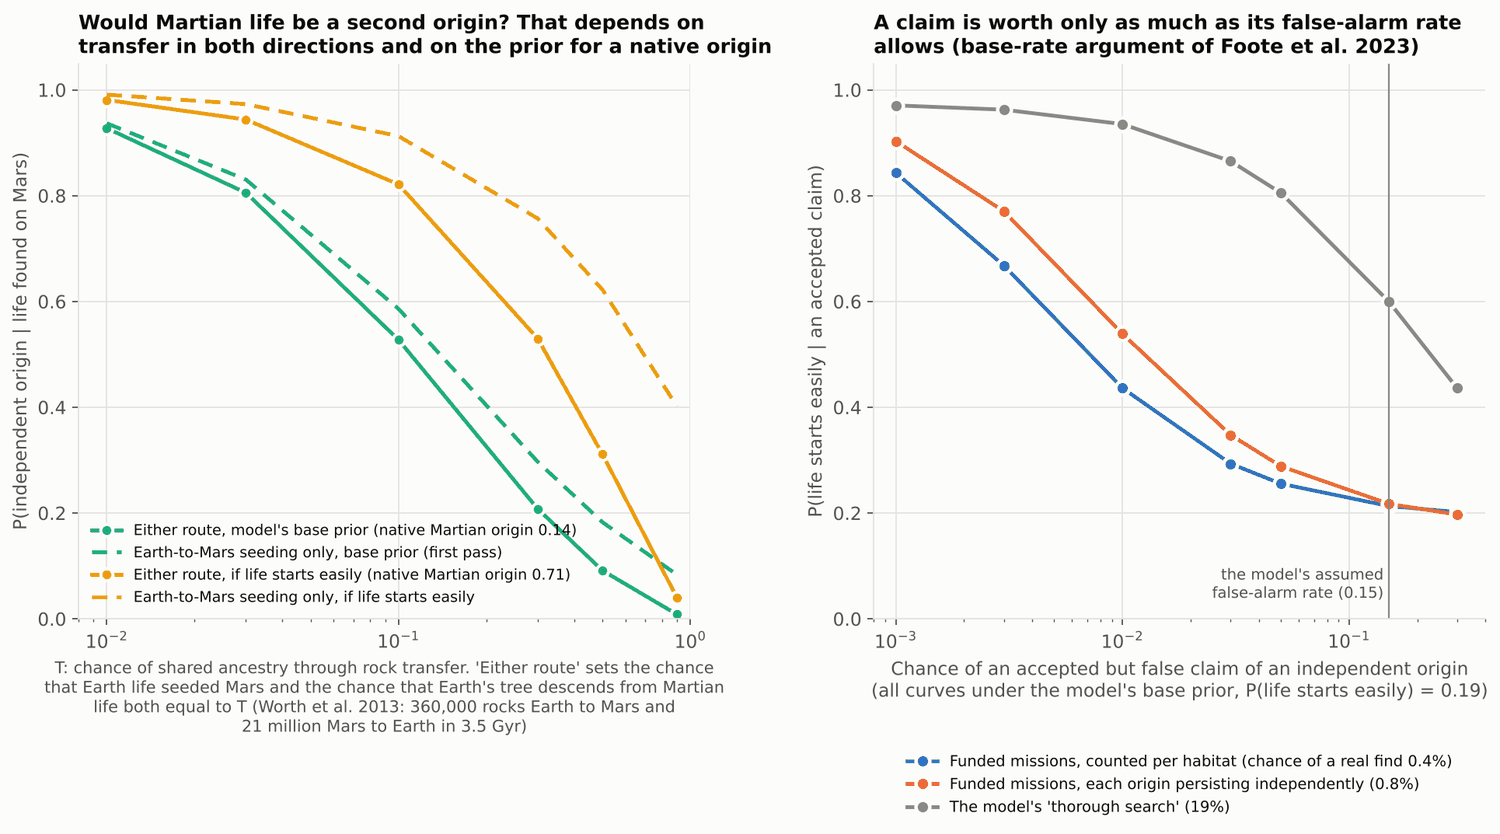
Forecast and claims (under the model's base prior, P(life starts easily) = 0.19). The funded missions have a 0.4% (per habitat) to 0.8% (per origin) chance of a true detection of an independent origin, 2.3% to 4.3% if life starts easily; with the unfunded pair, 2.2% to 3.3% (11% to 18%). A clean detection would give P = 0.37. A claim from the funded missions would be real 82-89% of the time at a false-alarm rate of 0.1%, 30-44% at 1%, and 2.5-4.3% at the model's 15%; this is the base-rate argument of Foote et al. (2023) with this model's numbers.
Independence (Figure 5). Worth et al. (2013, published Tables 4 and 5) simulate 360,000 ± 40,000 unsterilised 3-m rocks from Earth reaching Mars in 3.5 Gyr and 21,000,000 ± 500,000 the other way (58 times more), but about 6 reaching Europa and about 1 each Titan and Enceladus. Shared ancestry can therefore arise by either route. With T1 the probability that Earth life seeded Mars and T2 the probability that Earth's tree descends from Martian life, P(independent | life found on Mars) = <pM (1 - T1/2)(1 - T2)> / <pM + (1 - pM) T1>, where pM is the probability of a native Martian origin: 0.14 under the model's base posterior, 0.71 within the fast camp. Setting T1 = T2 = T:
| T | 0.01 | 0.1 | 0.3 | 0.9 |
|---|---|---|---|---|
| Base prior | 0.93 | 0.53 | 0.21 | 0.01 |
| If life starts easily | 0.98 | 0.82 | 0.53 | 0.04 |
| Base prior, Earth-to-Mars route only (first pass) | 0.94 | 0.59 | 0.30 | 0.08 |
With one per-rock probability of taking hold in both directions, the Mars-to-Earth route dominates: at 1e-8 per rock the answer is 0.79, at 1e-7 it is 0.10. For Europa and Enceladus it exceeds 0.99, and for Titan 0.97, for any assumed transfer probability up to 0.001; those values are assumptions, not published estimates. Independence would show as different chirality, a different amino-acid or base set, or a different genetic code; a fossil-only find such as Cheyava Falls may never be resolvable.
Robustness checks
- Common-mode error in my judgements (pure null, per habitat / per origin): every completeness 3 times higher +0.009 / +0.024; 10 times higher +0.026 / +0.050; every factor at its high end at once +0.055 / +0.074; opportunities 3 times higher +0.004 / +0.012.
- Other camps (pure null to date): life-starts-easily prior 60%: 0.580 to 0.584 / 0.593; early life credited 13 to 1 (Kipping 2025): 0.612 to 0.616 / 0.622; gradual evolution (Mills et al. 2025): 0.391 to 0.398 / 0.412. If the fast camp is narrowed to 1-10 origins per planet the three structures agree (+0.001): the structural spread comes entirely from lambda above 10.
- Other observer-counting conventions: +0.003 to +0.004 per habitat, +0.008 to +0.012 per origin.
- Seeds: the baseline is 0.778 ± 0.0014 over 8 seeds (range 0.773-0.783). The referee's three independent seeds give 0.772 and shifts of +0.003, +0.010 and +0.030 for the three structures; my likelihood curves reproduce these on the referee's samples (+0.0033, +0.0100, +0.031), so the difference from my values is seed scatter.
- The per-origin formula was checked against a brute-force simulation.
- Earth-to-Mars seeding at T = 0.3 weakens the Cheyava term (ratio 2 gives -0.012 / -0.005).
Limitations
- Every q, o, s, f, p and sB is my judgement; the result is a structured expert-judgement estimate with fresh database counts, not an empirical measurement. The table is itemised so each row can be challenged and rerun.
- Independent factor draws understate correlated error; structure and the scoring of Cheyava Falls move the answer more than the factor draws do.
- The likelihood ratio for Cheyava Falls is unknown; I give break-even values, not an estimate.
- PubMed counts are a crude proxy; MGnify is a subset of all sequencing and its analyses are concentrated in few studies.
- The independence formula treats T2 as a free input; under lithopanspermia the model's own Earth evidence (early life) would also need reinterpreting, which is not done here.
- The model's SIA column was not reproduced. Launch dates slip; "about 2038" assumes current schedules.
Closest prior work and what is new
Spiegel & Turner (2012) showed that Earth's early start is weak evidence and that a single independent origin would be far stronger; Chen & Kipping (2018) and Kipping (2020, 2025) develop the Bayesian abiogenesis rate (Chen & Kipping compare experiments but set Mars aside). Balbi & Grimaldi (2020) and Angerhausen et al. (2025) quantify what exoplanet nulls teach. Foote et al. (2023) make the false-positive, base-rate argument for life-detection claims; a 2026 Nature Astronomy paper led by ten Kate (seen only through its news summary) argues that false negatives are neglected. Affholder et al. (2021, 2022) treat Enceladus quantitatively; Scharf & Cronin (2016) frame origins per planet; Neveu et al. (2018) give the Ladder of Life Detection; Davies et al. (2009), Cleland & Copley (2005) and Carr (2022) argue the shadow-biosphere and Mars cases qualitatively; Raup & Valentine (1983) treat multiple origins; Bostrom (2008) drew the Fermi consequence. Neither I nor the referee found a prior itemised, numerical completeness of the second-origin search tied to a Fermi model.
New here: (1) that itemised estimate, as structured judgement with current database counts and mission status; (2) its mapping onto the model, including the finding that the answer depends on how detection scales with the number of origins (+0.003 to +0.026 for the same factor table) and the equivalent sg_frac of today's record (0.0002 to 0.003, against 0.3); (3) the break-even likelihood ratio for Cheyava Falls (1.1 to 1.4); (4) model-specific numbers for the value of each funded step and of a claim. Not new: that a second origin would be decisive (Spiegel & Turner), the base-rate argument (Foote et al.), and the reading of sg_frac = 0.3 as finding everything that ever arose, which is the model's own definition combined with my opportunity judgements.
Implications for the Fermi Paradox
The absence of a confirmed second origin so far is almost no evidence about whether life is hard to start. The record in hand moves P(no other civilisation ever) by a few hundredths at most, and its sign depends on one unresolved rock. The model's +0.09 "thorough search finds none" branch corresponds to finding any life that ever arose on every Solar System body; nulls from every funded mission would add +0.005 to +0.012 (up to +0.035 in the model's own form), and with the two unfunded missions +0.012 to +0.023 (up to +0.050). To represent today's record inside the model's own likelihood, sg_frac should be about 0.0002 to 0.0007 (0.003 at most), not a sizeable fraction of 0.3, together with a term for Cheyava Falls. The informative branch remains a detection, which under the base prior is 0.4-0.8% likely by 2038, needs a false-alarm rate well under 1%, and on Mars needs shared ancestry in either direction ruled out. The two largest single steps are both unfunded: returning Perseverance's cores, which would also settle Cheyava Falls, and landing on Enceladus.
Response to referee
| Referee point | What I did |
|---|---|
| F is not the counterpart of sg_frac (major) | Accepted. Claim deleted; "about 1% of a thorough search" replaced by the detection-chance comparison (3%, 9%, 25% against 87%). The model's own form is now a third structure in every table (+0.026 on my 8 seeds, +0.030 on the referee's). |
| The record is not a null; Cheyava Falls (major) | Accepted. Moved into Results; headline restated as a net update of undetermined sign; break-even ratio reported (1.12 per habitat, 1.39 per origin; 1.07-2.69 over sB and structure). sB is a named row in the factor table with a range; the hack line is gone; factor draws are kept paired. |
| Persistence applied per habitat (major) | Accepted. The per-origin alternative is carried through every table (+0.009 today, +0.012 funded, +0.023 unfunded; exact Poisson expectation). Factor-table rows for persist and s now state the structure. |
| Ranges "over factors" understate uncertainty | Accepted. Relabelled "independent factor draws only" in text, tables and Figure 4; envelope given. |
| "Thorough = perfect census" overclaimed; inconsistent "perfect" | Accepted. Reworded; two consistent ceilings replace the mixed one (any life ever: 0.871; everything surviving: 0.851-0.860). |
| PubMed ratio double-counted | Accepted. Union queries added (87,650; 2,263; 1,265 without nucleic-acid isotope probing); ratio 40 to 70 to 1. |
| MGnify statistics unweighted, few studies; rRNA line | Accepted. Study counts, reweighted median and pooled share added; rRNA line removed from the report and Figure 1; "ordinary life" attributed to the literature. |
| Independence ignores Mars-to-Earth; prior dependence; ocean-world T | Accepted. Two-route formula, 58-times asymmetry, base-prior and fast-camp rows, per-rock values, ocean-world T labelled as assumptions. |
| Absolute values over-precise | Accepted. Baseline quoted ± 0.0014; shifts identified as paired differences. |
| Forecast and claim values unconditional | Accepted. Given for both structures, stated as conditional on the base prior, Foote et al. (2023) credited. |
| Citations | Accepted. Worth et al. cited from the published tables only (I checked them myself); "decisive second origin" attributed to Spiegel & Turner; Foote et al. cited; MMX "scheduled to launch 20 October 2026". |
| Judgement, not measurement, to be stated up front | Accepted (first paragraph, Limitations, Figure 2 title). |
Not adopted as written: (a) I report the model's own form but do not treat it as an equally plausible structure, because it implies that sampling coverage and instrument recognition improve with the number of origins; it is labelled an upper bound. (b) I quote my 8-seed shifts (+0.009, +0.026) rather than the referee's 3-seed values (+0.010, +0.030); the difference is seed scatter, and both are given. (c) Instead of a single T for shared ancestry I use two (one per direction) and report the equal case. (d) F is kept in the outputs as a small-lambda exposure, relabelled. (e) The referee's suggested envelope of 0.75-0.81 is replaced by the computed one, 0.758-0.804 for a Cheyava ratio up to 2.
Key numbers
| Quantity | Value | Uncertainty | Note |
|---|---|---|---|
| Baseline P(no other civilisation ever in the Galaxy), Earth-as-given column | 0.778 | +/- 0.0014 Monte Carlo (8 seeds x 60,000; per-seed range 0.773-0.783); referee's 3 independent seeds give 0.772 | Shifts below are paired differences, known to 0.0001-0.001 |
| Shift from the record to date scored as a pure null, detection counted once per habitat | +0.0029 | +/- 0.0001 Monte Carlo; 5-95% over independent factor draws only: +0.001 to +0.005; x3 completeness +0.009; x10 +0.026 | First-pass headline; the low end of the structural range |
| Same, each origin persisting independently (persistence per origin, sampling and recognition per habitat) | +0.0087 | +/- 0.0003 Monte Carlo; 5-95% over factor draws: +0.004 to +0.015; referee's seeds +0.010; x3 completeness +0.024 | Hybrid structures give +0.007 and +0.015 |
| Same, every origin a separate chance of detection (the model's own form with sg_frac = F = 0.0029) | +0.026 | +/- 0.001 Monte Carlo; referee's seeds +0.030 | Regarded as an upper bound: it lets sampling coverage and instrument recognition improve with the number of origins |
| Chance the evidence in hand would have shown a second origin if life starts easily (D_fast): per habitat / per origin persistence / model's form | 0.03 / 0.09 / 0.25 | 5-95% over independent factor draws: 0.014-0.058 / 0.040-0.155 / 0.10-0.42 | Model's thorough search (sg_frac 0.3): 0.87. This replaces the first-pass 'about 1% of a thorough search' |
| sg_frac that reproduces today's pure-null shift inside the model's own likelihood | 0.0002 / 0.0007 / 0.003 | For the three structures; the model's 'thorough search' uses 0.3 | |
| Break-even likelihood ratio for the Cheyava Falls potential biosignature (cancels the whole null update) | 1.12 per habitat; 1.39 per origin | 1.07-1.53 and 1.21-2.69 for sB from 0.8 to 0.1 | sB = P(a Martian biosphere lived in that mud), factor-table row 0.1 / 0.4 / 0.8 |
| Net shift with Cheyava Falls scored at likelihood ratio 1.5 / 2 / 3 | -0.009 / -0.020 / -0.041 per habitat; -0.002 / -0.013 / -0.033 per origin | P(alone) 0.769 / 0.758 / 0.737 and 0.776 / 0.765 / 0.746 | |
| Envelope of the net update from the evidence in hand | about -0.02 to +0.03 | Structures x Cheyava likelihood ratio 1 to 2; -0.04 at ratio 3. Model's thorough null +0.093; confirmed detection -0.207 | |
| P(life starts easily) after the record to date, pure null | 0.194 / 0.182 / 0.149 | baseline 0.199 +/- 0.0015; factor-draw range 0.189-0.197 and 0.170-0.192 for the first two | With Cheyava Falls at ratio 2: 0.239 / 0.225 |
| P(no other civilisation ever) after nulls from the funded missions (about 2038) | 0.783 / 0.790 / 0.813 | factor draws only: 0.781-0.786 / 0.785-0.797 | Shifts +0.005 / +0.012 / +0.035; with the two unfunded missions (2050s): 0.790 / 0.801 / 0.828 |
| Ceilings: nothing found after finding any life that ever arose on every body / everything that survives or is preserved today | 0.871 / 0.851-0.860 | Model's own 'thorough search finds none': 0.871 (reproduced to four decimals from the model's internal calculation). Solar System opportunity sums to 0.24 (0.11-0.53) of an Earth-window under my judgements | |
| c_Earth: second biosphere alive today / second origin at any time | 0.16 / 0.013 | 0.09-0.27 / 0.003-0.050 (independent factor draws) | Structured judgement; persistence factor 0.1 (0.01-0.5) |
| c_Mars today / after funded missions / with Perseverance's cores returned | 0.024 / 0.046 / 0.099 | 0.010-0.049 / 0.023-0.085 / 0.049-0.18 | Europa 0.0001 -> 0.004 (Clipper); Titan 0.0005 -> 0.011 (Dragonfly); Enceladus 0.001 -> 0.096 (unfunded lander); Venus 0.0004 -> 0.001 |
| Chance the funded missions make a true detection of an independent origin (model's base prior) | 0.4% per habitat; 0.8% per origin | 2.3% / 4.3% if life starts easily; with the unfunded pair 2.2% / 3.3% (11% / 18%); a clean detection gives P(alone) 0.37 | |
| Share of accepted claims from funded missions that would be real | 82-89% at a false-alarm rate of 0.1%; 30-44% at 1%; 2.5-4.3% at 15% | Base-rate argument of Foote et al. 2023 with this model's numbers; the model assumes 15% | |
| P(independent origin | life found on Mars), shared ancestry possible by either route with T1 = T2 = T = 0.01 / 0.1 / 0.3 / 0.9 | 0.93 / 0.53 / 0.21 / 0.01 (base prior); 0.98 / 0.82 / 0.53 / 0.04 (if life starts easily) | P(native Martian origin) 0.14 base, 0.71 fast camp; Mars-to-Earth transfer is 58 times more efficient (Worth et al. 2013); per-rock probability 1e-8 both ways gives 0.79, 1e-7 gives 0.10 | |
| Sequence-based versus polymer-agnostic survey effort (PubMed, each record counted once) | 87,650 versus 1,265-2,263 (roughly 40 to 70 to 1) | 998 of 1,280 isotope-probing records name DNA, RNA or sequencing; 37 records are explicit searches; crude proxy | |
| Predicted proteins with no known family, MGnify pipeline-5.0 assemblies | median 34% unweighted; 31% with host-associated reweighted; 45% pooled | 5-95% over analyses: 25-73% | 16,762 assemblies from 359 studies (two supply a quarter); read-level median 64% over 4,937 read sets from 60 studies; descriptive of the holdings only |
| Sequence census | 9,341,864 metagenomic SRA experiments; 435,812 MGnify samples; 894,647 metagenome-derived assemblies; 199,923 GTDB species clusters | Counts on 2026-10-12; 80% of bacterial and 89% of archaeal species clusters have no cultured isolate |
Changes made after the referee report
- Likelihood structure: completeness.py now computes the null likelihood under three structures (per habitat; per origin for persistence with exact Poisson thinning; per origin for every factor = the model's own form) and update.py carries them through every scenario, camp, forecast and claim table. The pure-null shift is reported as +0.003 / +0.009 / +0.026 instead of a single +0.003.
- Dropped the claim that F = sum(q c o) is the counterpart of sg_frac and that the record is 'about 1% of a thorough search'; the comparison is now the detection chance in the fast camp (3%, 9%, 25% against 87%), plus the sg_frac that reproduces each shift in the model's own form (0.0002, 0.0007, 0.003).
- Cheyava Falls moved from robustness checks into the Results table; net update restated as of undetermined sign; break-even likelihood ratio computed (1.12 per habitat, 1.39 per origin; 1.07-2.69 over sB and structure); sB added to the factor table with a range (0.1 / 0.4 / 0.8), the hack line replaced, and factor draws kept paired with the likelihood.
- Headline and Implications rewritten as a bounded statement (about -0.02 to +0.03) with the main caveats, including 'judgement, not measurement', in the first paragraph.
- All ranges over factor draws relabelled 'independent factor draws only' in text, tables and Figure 4; baseline quoted as 0.778 +/- 0.0014 and shifts identified as paired differences.
- The inconsistent 'perfect search' case replaced by two ceilings defined the same way for every body: any life that ever arose is found (0.871) and everything that survives or is preserved is found (0.851-0.860); 'thorough = perfect census' reworded as the model's definition plus my opportunity judgements (0.24, range 0.11-0.53).
- Independence: two-route formula (Earth-to-Mars and Mars-to-Earth), the 58-times asymmetry stated, results given under the base prior and within the fast camp, per-rock parametrisation added, ocean-world transfer probabilities labelled as assumptions.
- PubMed: five union queries added (87,650 sequence-based; 2,263 polymer-agnostic; 1,265 without the 998 nucleic-acid isotope-probing records); ratio restated as roughly 40 to 70 to 1; Figure 1 splits the isotope-probing bar.
- MGnify statistics: study counts (359 and 60), share from the two largest studies, host-associated-reweighted median (31%) and pooled share (45%) added; the rRNA line removed from the report and Figure 1; 'follow-up finds ordinary life' attributed to the literature.
- Factor table: persistence and s rows now state how they are applied in each structure; MMX row corrected to 'scheduled to launch 20 October 2026'; 76 rows, with the first 75 numerically unchanged.
- Citations: Worth et al. 2013 cited from the published tables only (checked first-hand); 'a single independent origin would be decisive' attributed to Spiegel & Turner 2012; Foote et al. 2023 cited for the base-rate argument.
- Forecast and claim-value results now given for both main structures and stated as conditional on the model's base prior.
- Added common-mode, hybrid-structure and narrowed-fast-camp checks; cross-checked the revised likelihood curves on the referee's independent samples and the per-origin formula against brute-force simulation.
- All five figures regenerated; Figure 3 shows the three structures, Figure 4 shows structure and Cheyava scoring side by side, Figure 5 shows both transfer routes and both priors. Everything rerun from code/run_all.py (exit 0).
Referee points not accepted
- Partly rejected: treating the model's own form exp(-F lambda) as a like-for-like alternative. I report it in every table as the referee asked (+0.026 on my seeds, +0.030 on theirs), but label it an upper bound: it implies that sampling coverage and instrument recognition improve with the number of origins in a habitat (95% detection at lambda = 1000 from today's record), which the itemised f and p factors do not support.
- Not adopted as written: the referee's per-origin and model-form shifts (+0.010, +0.030). I quote my 8-seed values (+0.009, +0.026) and give theirs alongside; my curves reproduce their numbers on their 3-seed samples, so the difference is seed scatter in the model, not a disagreement.
- Not adopted as written: a single T for shared ancestry. I use two probabilities, one per transfer direction, and report the equal case, because the two routes enter the formula differently and the Mars-to-Earth one dominates.
- Not adopted: dropping F. It is kept in the outputs, relabelled as the small-lambda exposure, because it is the one summary all three structures share; it is no longer compared with sg_frac.
- The referee's suggested envelope of about 0.75-0.81 is replaced by my computed one: 0.758-0.804 for a Cheyava likelihood ratio up to 2 (0.737 at a ratio of 3).
Figures
Code
Every number above is produced by these scripts from public data. The data tables themselves are not hosted here; the scripts download them.
completeness.py earth_stats.py fetch_public_counts.py fetch_pubmed_counts.py figures.py model_samples.py run_all.py update.py
Referee report
A second, separate analysis re-ran the code, recomputed the main numbers by its own route and tried to break the result. Like the first, it was run by Claude for this project; it is not an outside expert. In its report “the analyst” is the first analysis, which wrote the paper, and file names that are not linked on this page are its own working files. The paper above is the version revised in response.
Verdict: sound with fixes. Results reproduced: yes.
WHAT I RAN.
Rerun of the analyst's code. Copied code/ and the factor table to scratch and reran completeness.py and update.py against the saved model samples. Every headline number reproduces to the quoted precision: exposure F median 0.0029 (0.0008-0.0103), mean 0.0039; D_fast 0.029 (0.014-0.058); c_Earth alive today 0.161 (0.086-0.271), ever 0.013 (0.003-0.050); c_Mars 0.0235 / 0.046 / 0.099; P(fast) 0.1994 -> 0.1937; P(alone) 0.7784 -> 0.7813 (+0.0029, paired MC se 0.0001); funded 0.7832; unfunded 0.7904; perfect 0.8671; model thorough 0.8712; confirmed 0.5716; x3 +0.0086; x10 +0.0261; all-high +0.0553; camps and forecast tables as reported. The model file md5 matches (24028ed6...).
Independent route. I ran the unmodified model with my own seeds (201-203, 60,000 each, nice -n 10) and wrote my own implementation of the likelihood from completeness_factors.csv (mycode/ref_like.py, different RNG, 3,000 factor draws). Result: baseline P(alone) 0.7721 (per seed 0.768, 0.774, 0.774), P(fast) 0.210; null to date +0.0032 (per seed +0.0034, +0.0032, +0.0031); F median 0.0028 (0.0008-0.0102); D_fast 0.031; funded +0.0052; unfunded +0.0131; model thorough null 0.8724. So the shift is confirmed independently. The absolute baseline differs by 0.006 from the analyst's 0.778, which is within seed scatter (analyst's 8 seeds range 0.773-0.783, se 0.0014). Back-of-envelope also agrees: slope of P(alone) per unit D_fast is about 0.08-0.09, times D_fast 0.03 gives +0.003.
Structural variants the analyst did not run (same samples, same factor table):
- Model's own likelihood form exp(-F*lambda) with sg_frac set to the analyst's F (0.0028 median / 0.0038 mean): D_fast 0.24 / 0.28, P(alone) shift +0.030 / +0.036. Ten times the headline.
- Persistence and preservation applied per origin (Poisson thinning of persist and s; f and p kept per habitat): D_fast 0.089, shift +0.010 today, +0.014 after funded missions, +0.026 with the unfunded pair. Earth alone goes from +0.0011 to +0.0057; other bodies from +0.0021 to +0.0047.
- Cheyava Falls: with the analyst's own formula (sB = 0.4, T = 0) the likelihood ratio at which the positive evidence exactly cancels the whole null update is 1.13 (1.07 for sB 0.8, 1.26 for sB 0.2, 1.53 for sB 0.1). At LR 1.5 the net update is -0.009; at LR 2, -0.020.
Data checks. Live re-queries on 2026-10-12: MGnify samples 435,812 (identical); NCBI assemblies derived from metagenomes 894,647 (identical); SRA metagenomic experiments 9,342,785 (analyst 9,341,864, grew during the day); GTDB VERSION v232 released 15 April 2026, release notes say 901,341 genomes and 199,923 species clusters (identical). PubMed counts reproduce exactly per query; the union of the four sequence queries is 87,650 (not the summed 97,416), the union of the seven polymer-agnostic queries is 2,263, and about 980 of the 1,280 stable-isotope-probing records mention DNA, RNA or sequencing. From the analyst's MGnify table I recompute median unmatched protein share 0.338 (5-95% 0.246-0.725), read-level 0.644, rRNA-bearing 0.9927, no duplicate analyses; but the 16,762 assemblies come from only 359 studies (two studies supply 4,161 of them), the read-level set from 60 studies; weighting the one-in-four Host-associated subsample gives a median of 0.31 and the protein-weighted pooled share is 0.45.
Citation and status spot-checks (web). Confirmed: FY2026 appropriation text 'does not support the existing Mars Sample Return (MSR) program' (with about $110M for Mars Future Missions); NASA's 16 April 2026 announcement of Falcon Heavy for Rosalind Franklin, NET late 2028; MMX launch scheduled 20 October 2026 on H3 (not yet flown as of today); Tianwen-3 launch about end 2028, return about 2031, at least 500 g; ESA L4 Enceladus in study, launch about 2042, landing about 2052, adoption expected about 2034; DAVINCI $99M in FY2026; Hurowitz et al. 2025 'potential biosignature' unchanged, no 2026 resolution found; Affholder et al. 2022 (>0.1 mL, >100 fly-bys, <10 t carbon); Raup & Valentine 1983 conclusion (my check of the 0.128 threshold: correct); Viking 'several million cells per gram' (Glavin/Mahaffy); Worth et al. 2013 transfer numbers match the published Astrobiology version (PMC3870607) exactly: Earth->Mars 360,000 +/- 40,000, Mars->Earth 21,000,000, Earth->Europa 6 +/- 0.9, Mars->Europa 20 +/- 4, Earth->Titan 1 +/- 0.9, Earth->Enceladus 1 +/- 0.7. Note the arXiv v1 preprint the analyst also cites has different Table 5 values (Earth->Enceladus 3 +/- 2, Titan 4 +/- 3, Mars->Europa 5 +/- 0.9).
No fabricated numbers, no broken joins and no code bugs were found. The problems are in the structure of the likelihood, in how the result is framed, and in a few descriptive statistics.
Strongest objection
The headline number is neither robust in size nor in sign, because it is the output of a chosen likelihood structure applied to 75 subjective factors and to a record that is not actually a null.
Size: the analyst's likelihood caps each habitat's detection chance at q*c however many origins the fast camp implies. That is defensible for 'is there a biosphere on Mars', but it is a choice. Feeding the same exposure (F = 0.003) into the model's own likelihood gives +0.030, and applying persistence per origin (which is what the cited Raup & Valentine argument assumes) gives +0.010. So the null-only update is +0.003 to +0.03 depending on structure alone, before any factor is challenged.
Sign: the Mars record contains a published potential biosignature. In the analyst's own formula a likelihood ratio of 1.13 for the Cheyava Falls features cancels the entire null update, and LR 2 gives -0.020. No one can currently say the LR is below 1.13.
Does the conclusion survive? The qualitative one does. In every variant I ran (per-origin persistence, the model's own form, all completeness values ten times higher, Cheyava scored at LR up to 2) the net update on P(no other civilisation ever) stays within about -0.02 to +0.03, against +0.09 for the model's 'thorough search finds none' branch and -0.21 for a confirmed detection. So 'the search to date has told us little, and the model's thorough-null branch is far from realised' stands. The specific claims '+0.003', 'about 1% of a thorough search' and 'missed 97 times in 100' do not survive as stated; they hold only under the per-habitat structure and a pure-null reading of Mars.
Errors found
- major. The exposure F = sum(qco) is
presented as 'the direct counterpart of the model's sg_frac' and the
headline says today's evidence is 'about 1% of the 0.3 the model
assumes'. That equivalence holds only for lambda much less than 1, where
the null carries no information anyway. In the fast camp (lambda 1 to
1000), which is where the whole update comes from, the analyst's
likelihood saturates at qc per habitat while the model's own form
exp(-sg_fraclambda) saturates at 1. The two halves of the headline
therefore come from different functional forms: a reader who puts
sg_frac = 0.003 into the model gets a miss rate of 76%, not 97%, and a
shift of +0.03, not +0.003.
- Evidence: My rerun on independent seeds: analyst's form D_fast 0.031, shift +0.0032; exp(-F*lambda) with F = 0.0028: D_fast 0.238, shift +0.030; with F = 0.0038 (mean): D_fast 0.280, shift +0.036.
- Fix: Stop calling F the counterpart of sg_frac. Lead with D_fast (0.029 versus 0.868, i.e. 3.5%) as the comparison that drives the update, state explicitly that the per-habitat saturating form is a modelling choice that differs from the model's own form, and report the result under the model's form alongside (+0.030).
- major. The evidence in hand is not a null, and the
headline treats it as one. Using the analyst's own Cheyava Falls
formula, a likelihood ratio of only 1.13 in favour of biology cancels
the entire +0.003; at LR 1.5 the net update is -0.009 and at LR 2 it is
-0.020. The report mentions the sensitivity under robustness checks and
limitations, but the headline, key numbers and implications lead with a
signed +0.003 as if the sign were known.
- Evidence: mycode/ref_more.py: LR 1.0 +0.0032; 1.1 +0.0008; 1.15 -0.0004; 1.5 -0.0088; 2 -0.0202; 3 -0.0411; break-even LR 1.13 (sB 0.4), 1.26 (sB 0.2), 1.53 (sB 0.1). Analyst's own table gives 0.760 / 0.741 / 0.646 for LR 2 / 3 / 10.
- Fix: Reframe the headline result as a net update whose sign is not determined: roughly -0.02 to +0.003 on the analyst's structure depending on how the Cheyava Falls potential biosignature is scored (break-even LR about 1.1 to 1.5), and state the break-even LR explicitly. Keep '+0.003' only as 'if the Mars record is scored as a pure null'.
- major. Persistence on Earth (0.1) and the
preservation factors s on other bodies are applied once per habitat,
however many origins occurred. Under the fast camp the model implies
tens to hundreds of origins per habitat, and the argument the analyst
cites for the persistence factor (Raup & Valentine 1983) is
explicitly per-origin with independent fates. The per-habitat choice
caps Earth's detection chance at 0.013 even at lambda = 1000 and is the
low-end structural assumption; it is not disclosed as such.
- Evidence: mycode/ref_like.py and ref_more2.py: Earth alone +0.0011 (per habitat) versus +0.0057 (per origin); other bodies +0.0021 versus +0.0047; total +0.0032 versus +0.0101.
- Fix: Either justify full correlation between origins (incumbent advantage) explicitly, or report the per-origin alternative next to the headline: D_fast 0.089, shift +0.010 today, +0.014 after funded missions, +0.026 with the unfunded pair. State the structural range of the null-only update as +0.003 to +0.03.
- minor. The quoted range 'P(alone) 0.781
(0.780-0.784)' is conditional on the likelihood structure, on
independent factor errors and on scoring Mars as a null. It reads as the
uncertainty of the result but covers only one of three sources, and the
smallest one.
- Evidence: Structural variants +0.010 and +0.030; Cheyava LR 2 gives -0.020; analyst's own x10 case +0.026.
- Fix: Label it 'range over independent factor draws only' and give the wider envelope (about 0.75-0.81 including structure and Cheyava scoring) wherever the number is quoted.
- minor. 'The model's thorough search equals a
perfect census of every habitat' is listed as a new finding. It follows
from the analyst's own opportunity judgements (sum of q*o over Solar
System bodies: median 0.24, 5-95% 0.11-0.53, each o spanning about two
decades) and restates what the model already says: the code comment
defines sg_frac as the 'share of a planet's opportunity sampled', i.e.
perfect detection within that share. The 'perfect' case is also
inconsistent across habitats: Earth is capped by persistence, other
bodies get c = 1 regardless of extinction or preservation.
- Evidence: completeness_summary.json: opportunity_sum_q_o_solar_system 0.105 / 0.244 / 0.530; model4.py line 144.
- Fix: Soften to 'under my opportunity judgements the whole Solar System sums to about 0.25 (0.11-0.54) of an Earth-window, so sg_frac = 0.3 corresponds to finding any life that ever arose on every body'. Note the Earth/other-body inconsistency in the definition of 'perfect'.
- minor. The PubMed '42 to 1' ratio sums overlapping
queries and counts DNA/RNA stable-isotope probing as polymer-agnostic,
which the analyst's own table marks as 'partly'.
- Evidence: Live PubMed re-query today: union 87,650 versus summed 97,416; SIP 1,280 of which about 980 match DNA/RNA/sequencing terms.
- Fix: Use union queries (87,650 sequence-based; 2,263 polymer-agnostic) and state that about three quarters of stable-isotope-probing records are nucleic-acid based, so the ratio is roughly 40 to 70 to 1. Keep it described as a crude proxy.
- minor. The MGnify 'unassigned share' statistics are
unweighted over analyses that come from few studies (16,762 assemblies
from 359 studies, two studies supply 25%; 4,937 read-level analyses from
60 studies) and the one-in-four Host-associated subsample is not
reweighted. '99.3% of assemblies still carry ribosomal RNA genes' says
nothing about the unassigned fraction, since any mixed community
contains standard cells. 'Follow-up finds ordinary life' in the
analyst's own sample is inferred from study titles and tRNA counts, not
from any follow-up.
- Evidence: mycode/earth_chk.py on the analyst's mgnify_analysis_summaries.csv.
- Fix: Present these as descriptive of MGnify pipeline-5.0 holdings, give the study counts, add the weighted median (0.31) and pooled share (0.45), drop or caveat the rRNA line, and attribute the 'ordinary life' conclusion to the cited literature (Pavlopoulos et al. 2023 and others) rather than to this sample.
- minor. Independence section. (a) It ignores
Mars-to-Earth transfer, which by the cited source is 58 times more
efficient than Earth-to-Mars (21,000,000 versus 360,000 rocks), so
shared ancestry via 'Earth life is Martian' is the likelier route and is
not a small omission. (b) The quoted probabilities (0.94 / 0.59 / 0.30 /
0.08) depend on the model's base prior that Mars had a native origin
(0.14-0.15) and would be much higher for anyone who thinks life starts
easily; this is not stated. (c) The '>0.999 for ocean worlds' rests
on assumed establishment probabilities of 1e-4 to 1e-5, not on a
published estimate.
- Evidence: Worth et al. 2013 Table 4 (PMC3870607); my recomputation gives P(native Mars origin) 0.148 overall and 0.72 given the fast camp; independence values 0.94 / 0.84 / 0.60 / 0.31 / 0.09 on my seeds.
- Fix: Redefine T as the probability of shared ancestry by either route, say so in the text, state the prior dependence next to the numbers, and label the ocean-world T values as assumptions.
- minor. Absolute posterior values are quoted to
three decimals (0.778 -> 0.781) although the Monte Carlo error on the
baseline is 0.0014 (8 seeds) and my three independent seeds give 0.772.
Only the paired shift is known to 0.0001.
- Evidence: Analyst per-seed baselines 0.7727-0.7833; my seeds 0.7679, 0.7740, 0.7743 with shifts +0.0034, +0.0032, +0.0031.
- Fix: Quote the baseline as 0.778 +/- 0.0014 (Monte Carlo) and make clear that the +0.003 is a paired difference.
- minor. Citation details. The transfer table is
tagged 'arXiv:1311.2558, Tables 4 and 5' but its outer-moon numbers are
those of the published Astrobiology version; the arXiv preprint differs
(Earth->Enceladus 3 +/- 2, Earth->Titan 4 +/- 3, Mars->Europa 5
+/- 0.9). The statement that Chen & Kipping and Kipping 'note that a
second-origin test would be decisive' is not supported by their
abstracts (Chen & Kipping set Mars aside); the clear statement of
that point is Spiegel & Turner 2012. Foote et al. 2023
(Astrobiology, 'False positives and the challenge of testing the alien
hypothesis') makes the base-rate argument behind the 'false-alarm
threshold' result and is not cited.
- Evidence: pdftotext of arXiv:1311.2558v1 versus PMC3870607; web search of abstracts.
- Fix: Cite the published Worth et al. tables only; attribute the 'independent origin would be decisive' point to Spiegel & Turner 2012 unless a page reference in Kipping is supplied; cite Foote et al. 2023 for the false-positive argument.
Overclaims
- Headline: 'The null result to date moves P(no other civilisation ever) from 0.778 to 0.781 (+0.003; +0.009 if every completeness value is three times too low)'. The sign depends on Cheyava Falls (break-even LR 1.13) and the size on the likelihood structure (+0.003 to +0.03). Defensible wording: 'the evidence in hand moves it by at most a few hundredths in either direction; scored as a pure null, +0.003 to +0.03'.
- 'an exposure of 0.003 ... about 1% of the 0.3 the model assumes for a thorough search': F is not comparable to sg_frac in the regime that matters; the like-for-like figure is the detection chance, 3.5% (or about 10% with per-origin persistence).
- 'they would still have missed a second origin about 97 times in 100': true only under per-habitat saturation; 91 in 100 with per-origin persistence, 76 in 100 under the model's own form.
- 'the finding that the model's thorough search equals a perfect census' listed as a new result: it is the model's stated definition plus the analyst's opportunity judgements (0.11-0.54).
- 'P(alone) 0.781 (0.780-0.784) over factors' presented as the uncertainty of the result: it covers independent factor draws only.
- 'The realistic negative branch by the 2050s is about +0.01': +0.012 on the analyst's structure, +0.026 with per-origin persistence; and it assumes the Cheyava Falls cores, if returned, come back negative.
- 'it is only 0.4% likely by 2038' and 'requires a false-alarm rate well under 1%': both are conditional on this model's base prior (P(life starts easily) 0.19) and the per-habitat structure; the base-rate argument itself is Foote et al. 2023.
- 'P(independent origin | life found on Mars) = 0.94 / 0.59 / 0.30 / 0.08' given without saying it assumes the base prior of 0.14 for a native Martian origin and leaves out the 58-times-more-efficient Mars-to-Earth route.
- 'follow-up finds ordinary life' for the analyst's own least-annotated MGnify studies: inferred from study titles and tRNA counts; no follow-up was done here.
- 'Sequence-based effort outnumbers polymer-agnostic effort about 42 to 1': double-counted numerator and a denominator that is mostly DNA/RNA-SIP; 40 to 70 to 1 is what the counts support.
Novelty check
Novel: partly. I found no prior paper that itemises, numerically, how complete the search for a second origin is across Earth and the Solar System and feeds that into a model of the Fermi question; that combination appears to be new, and the searches I ran (Bayesian abiogenesis from null results, shadow-biosphere search completeness, Solar System non-detection inference) turned up nothing closer. But three of the four 'new results' need qualifying. (1) The idea that an independent origin would be the decisive datum and that Earth's single origin says little is Spiegel & Turner 2012 and Kipping 2020/2025; the information content of null results is Angerhausen et al. 2025 and Balbi & Grimaldi 2020 for exoplanets. (2) 'The model's thorough search equals a perfect census' is the model's own definition of sg_frac plus the analyst's opportunity judgements, not a discovery. (3) The false-alarm threshold is the standard base-rate argument already made for life detection by Foote et al. 2023; only the specific numbers are model-specific. What is new is the itemised table and the mapping to the model, and that table is 75 judgement rows, not a measurement. It should be reported as a structured expert-judgement estimate with fresh database counts, not as an empirical result.
- Spiegel & Turner 2012, PNAS 109, 395 (arXiv:1107.3835): early life is weak evidence; a single independent origin would be much stronger evidence
- Chen & Kipping 2018, Astrobiology 18, 1574 (arXiv:1806.08033): information gain on the abiogenesis rate from different experiments; sets Mars aside
- Kipping 2020, PNAS 117, 11995 (arXiv:2005.09008) and Kipping 2025 (13:1 odds for rapid abiogenesis)
- Angerhausen et al. 2025 (arXiv:2504.06779): what null results in biosignature surveys teach
- Balbi & Grimaldi 2020, PNAS: information impact of future biosignature searches
- Foote, Sinhadc, Mathis & Walker 2023, Astrobiology (arXiv:2207.00634): false positives and priors in life-detection claims, with Venus and Enceladus as cases
- Affholder et al. 2021 (Nature Astronomy) and 2022 (PSJ 3, 270): Bayesian treatment of Enceladus plume data and detectability of a small biosphere
- Scharf & Cronin 2016, PNAS: quantifying the origins of life on a planetary scale
- Davies et al. 2009; Cleland & Copley 2005; Carr 2022: qualitative shadow-biosphere and Mars arguments
- Raup & Valentine 1983, PNAS 80, 2981: multiple origins and the survival of one
- Neveu et al. 2018: Ladder of Life Detection
- Worth, Sigurdsson & House 2013; Mileikowsky et al. 2000: rock transfer and survival
Required changes
- Headline and 'Implications' paragraph: replace the signed '+0.003' with a bounded statement. Suggested: 'Scored as a pure null, the search to date adds +0.003 to +0.03 to P(no other civilisation ever), depending on whether detection chances are counted per habitat or per origin; if the Cheyava Falls potential biosignature is given a likelihood ratio above about 1.1-1.5 the net effect is negative (-0.02 at LR 2). Either way the evidence in hand moves the answer by a few hundredths at most, against +0.09 for the model's thorough-null branch.'
- Method section: delete 'the direct counterpart of the model's sg_frac' for F. State that the likelihood used, prod_h[1 - q c (1 - exp(-o lambda))], differs from the model's exp(-sg_frac lambda) in the fast camp, and add one row to the update table for each structural alternative: model's own form with sg_frac = F (P(alone) shift +0.030, D_fast 0.24) and per-origin persistence (+0.010, D_fast 0.089; funded +0.014; unfunded +0.026).
- Replace 'about 1% of a thorough search' everywhere (headline, key numbers, Results, 'what is new') with the detection-chance comparison: 3.5% on the per-habitat structure, about 10% per origin.
- Persistence factor row (Earth, persist) and the s rows: state explicitly that they are applied once per habitat, why (incumbent advantage implies correlated fates), and that the Raup & Valentine figure is a per-origin, independent-fates calculation that would support the larger number.
- Move the Cheyava Falls sensitivity out of 'Robustness checks' into the Results table as its own rows, and add the break-even likelihood ratio (1.13 at sB = 0.4; 1.07-1.53 for sB 0.8-0.1). Replace the hack line 'sB = float(terms[...].mean() * 0 + 0.4)' in update.py with a named constant and add sB to the factor table with a range.
- Every place a range is quoted 'over factors' (key numbers, Results tables, Figure 4 caption): add 'independent factor draws only; structure and the scoring of Mars add more, see rows above'.
- Reword new-result (2): 'Under my opportunity judgements the Solar System's habitats sum to about 0.25 (0.11-0.54) of one Earth-window, so the model's sg_frac = 0.3 corresponds to detecting any life that ever arose on every body.' Note that 'perfect' is defined differently for Earth (capped by persistence) and for other bodies (c = 1).
- Independence section: redefine T as the probability of shared ancestry by either direction, state that Mars-to-Earth transfer is 58 times more efficient in Worth et al. 2013, state that the quoted probabilities assume the base prior of about 0.14 for a native Martian origin (0.72 within the fast camp), and label the ocean-world establishment probabilities (1e-4, 1e-5) as assumptions.
- PubMed table: use union queries (87,650 and 2,263), note that about 980 of 1,280 stable-isotope-probing records are nucleic-acid based, and give the ratio as 'roughly 40 to 70 to 1'.
- Earth table: add that the MGnify percentages are unweighted medians over 16,762 assemblies from 359 studies (two studies supply a quarter) and 4,937 read sets from 60 studies; add the Host-associated-weighted median (0.31) and the pooled share (0.45); delete the '99.3% carry rRNA' row or say it is uninformative about the unassigned fraction; attribute 'follow-up finds ordinary life' to the cited literature, not to this sample.
- Quote the baseline as 0.778 +/- 0.0014 (Monte Carlo, 8 seeds) and say the shifts are paired differences; an independent three-seed run gives 0.772.
- Forecast and claim-value lines ('0.4% by 2038', 'false-alarm rate well under 1%', 'a clean detection gives 0.37'): add 'under the model's base prior and the per-habitat structure', and cite Foote et al. 2023 for the base-rate argument.
- Citations: cite the published Astrobiology tables of Worth et al. 2013 only (the arXiv preprint has different outer-moon values); attribute 'a single independent origin would be decisive' to Spiegel & Turner 2012 unless a page reference in Kipping is given; MMX should read 'scheduled to launch 20 October 2026', not 'launches this month', until it has flown.
- State in the first paragraph of the report, not only in Limitations, that the completeness values are structured expert judgement (75 rows authored by the analyst) and that no row is a measurement; the database counts describe effort, they do not set any factor.