Where is everybody? · Working papers
How well has the Solar System been searched for artefacts?
Revised after a second, separate analysis run for this project tried to break it. Neither analysis is an outside expert.
How well has the Solar System been searched for artefacts? A completeness function by location and object size (revised after review)
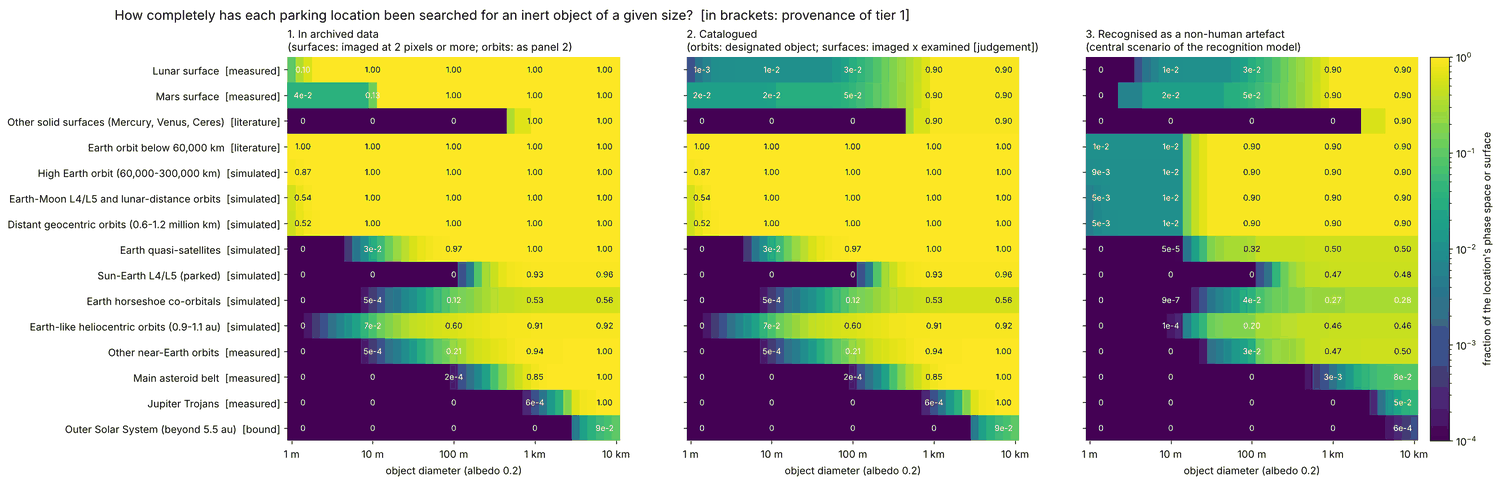
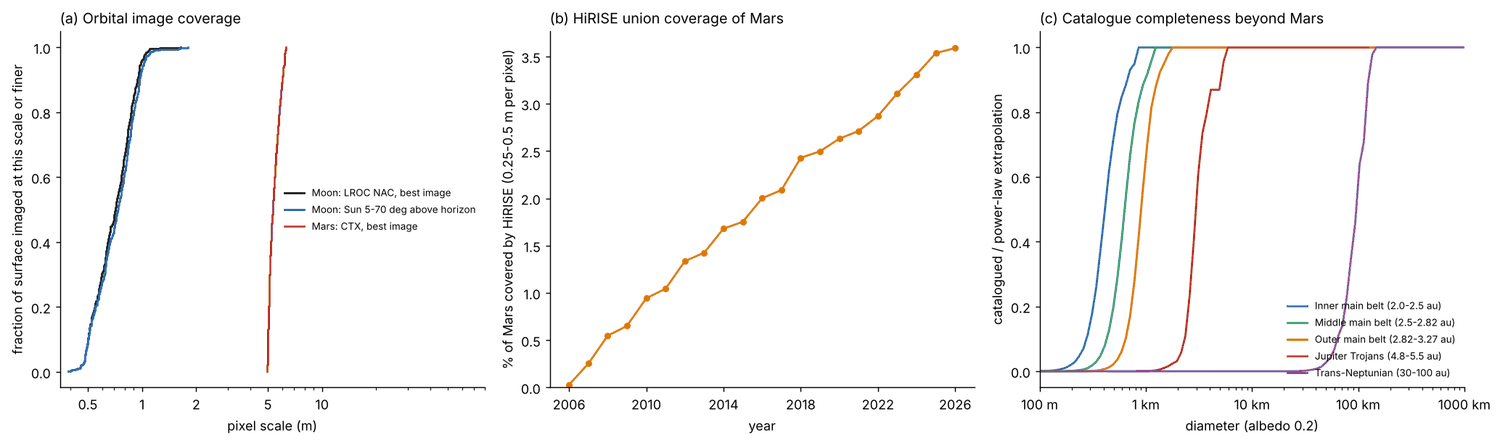
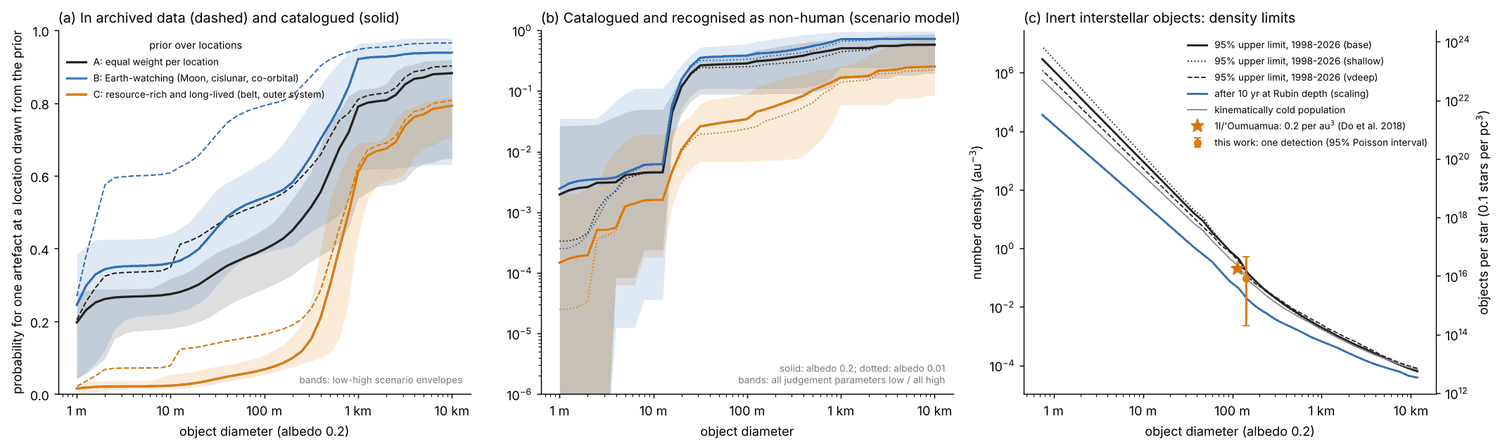
Summary. An inert artefact parked in the Solar System would, in most places and at most sizes, not have been noticed. This revision separates three tiers: in archived data, catalogued, and recognised as non-human. Measured directly: all 500 random lunar points have LROC imagery at 2 m per pixel or finer (96% at 1 m or finer) and HiRISE covers 3.59% +- 0.01% of Mars, but no metre-scale catalogue of either surface exists, and the only published search aimed at artificial objects that I found covers 1.7e-6 of the Moon. A survey simulator fitted to the discovery record of near-Earth asteroids, with survey coverage versus solar elongation now measured from 35,162 real first observations (coverage at 45-60 deg is 0.46%, 95% range 0.31-0.68%, of that near opposition), gives sizes catalogued with 50% probability of about 1 m in geocentric orbits out to 1.2 million km (0.3-4 m; calibrated on two minimoons), 30 m (24-40 m) for quasi-satellites, 50 m (40-150 m) on Earth-like heliocentric orbits and 0.35 km (0.3-0.6 km) at Sun-Earth L4/L5; catalogues give 0.2 km on other near-Earth orbits, 0.4-0.9 km in the main belt and 3 km for Jupiter Trojans; beyond Jupiter 50% is never reached (9% at 10 km). The probability that one artefact has been catalogued is 20-25% at 1 m and 28-36% at 10 m under two Earth-centred priors (almost all from geocentric orbits) and 2% under a belt/outer prior. The probability that it has also been recognised as non-human is 0.2-0.6% at 1-10 m, 28-38% at 100 m and 50-71% at 1 km (Earth-centred priors), or 0.01-0.2%, 3% and 17% (belt/outer prior), under stated judgement parameters (attribution 1%, range 0-10%; examined fraction 1%); these are scenario values, not measurements. Main caveats: the simulator fails a discovery-magnitude test at every assumed depth (carried as a +-1.5 mag systematic); the geocentric numbers extrapolate a trailing-loss law far beyond its fitted range; the priors are arbitrary. The first version's 'never above 67% at L4/L5', its geocentric '0.84 m (0.67-3.7 m)' and any reading of 0.2-0.6% as a measured number are withdrawn.
Question
If an inert artificial object of a given size were parked at a given place in the Solar System, what is the probability that existing surveys and image archives (to October 2026) would hold it, have catalogued it, and have recognised it as non-human? The answer is the factor a Fermi-paradox argument needs before it can use 'no artefacts have been seen here'.
Data
All downloads were made on 2026-10-12 and can be repeated by the code.
- JPL Small-Body Database: 42,718 near-Earth asteroids (42,721 in a later query) with orbits, epochs, first-observation dates and physical parameters; characterisation counts by absolute magnitude; hyperbolic objects.
- JPL Horizons: daily ephemerides 1998-2026 for 308 Earth-like and co-orbital asteroids; 4,031 single-date positions on the night of first observation.
- Minor Planet Center: NEA.txt, MPCORB (1,572,538 objects), 18 editorial notices since 2010 that deleted designations.
- Population models: Granvik et al. (2018) orbit realisation; NEOMOD2 Table 3 (25 half-magnitude bins, transcribed by hand and checked by the referee), which also tabulates Harris & Chodas (2021).
- PDS Orbital Data Explorer: LROC NAC at 500 random lunar points, CTX and HiRISE at 400 martian points; the HiRISE cumulative index (103,491 RED images).
- GCAT (J. McDowell): human objects in heliocentric and deep-space orbits. Project Pluto (B. Gray): index of artificial objects mistaken for asteroids and the list of high-orbit objects tracked from survey astrometry.
Method
- Three tiers. In archived data: surfaces imaged at 2 pixels or more across the object; for orbits this tier is set equal to tier 2 because unlinked detections are not modelled (a lower bound). Catalogued: a designated or listed orbital object; for surfaces, imaged coverage times the fraction examined in a way that would log a discrete feature (a judgement parameter, because no such catalogue exists). Recognised: catalogued and identified as a non-human artefact.
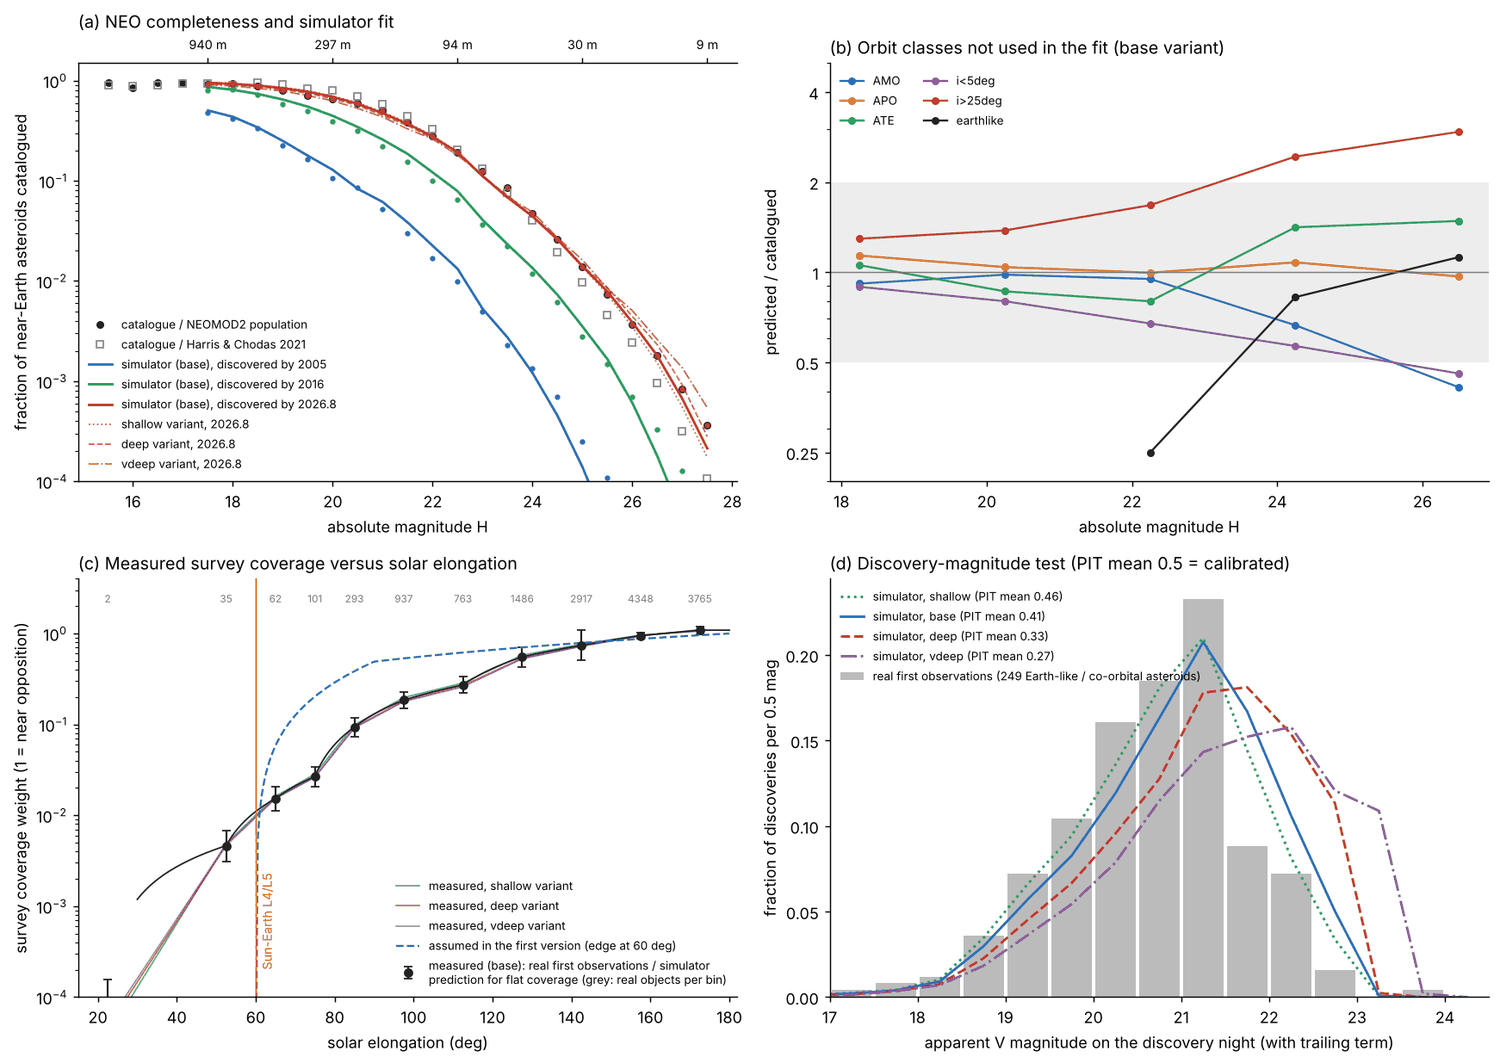
- Survey simulator. Daily two-body propagation 1998.0-2026.8; five eras, each with a limiting V magnitude, a logistic roll-off and a fitted nightly success probability; trailing loss from NEOMOD2; declination limit -30 deg. The five probabilities are fitted to the fraction of near-Earth asteroids catalogued by 2005, 2011, 2016, 2021 and 2026.8 in 21 magnitude bins. Depths are not fitted (degenerate with the probabilities). Variants: base (published depths, 21.0-21.8 after 2005), shallow (-0.5 mag), deep (+1.0; the first version's baseline), vdeep (+1.5), hard22p5 (nothing fainter than 22.5), plus Harris & Chodas populations and an ecliptic-concentrated variant.
- Measured elongation coverage (new). For every near-Earth asteroid designated since 1998 whose first observation falls in its designation half-month (35,290), the solar elongation and magnitude on that night were computed: two-body propagation for 12,061 short-arc orbits whose epoch is near discovery (checked against Horizons on 60 objects: median error 0.07 deg, maximum 0.8), Horizons for all 2,867 long-arc objects screened below 105 deg, and Horizons for a random 1,000 of the remaining 20,234 (weight 20.2 each; 2 of the 1,000 were truly below 90 deg). The 291 objects closer than 0.005 au were left out. The weight in each elongation bin is the number of real first observations (17.25 <= H < 27.75) divided by the number the simulator predicts for coverage independent of elongation, normalised above 150 deg; because the prediction depends on the weight through survival, it is iterated to a fixed point (three iterations; closure 4% for base, below 1% for the other variants), separately for each depth variant.
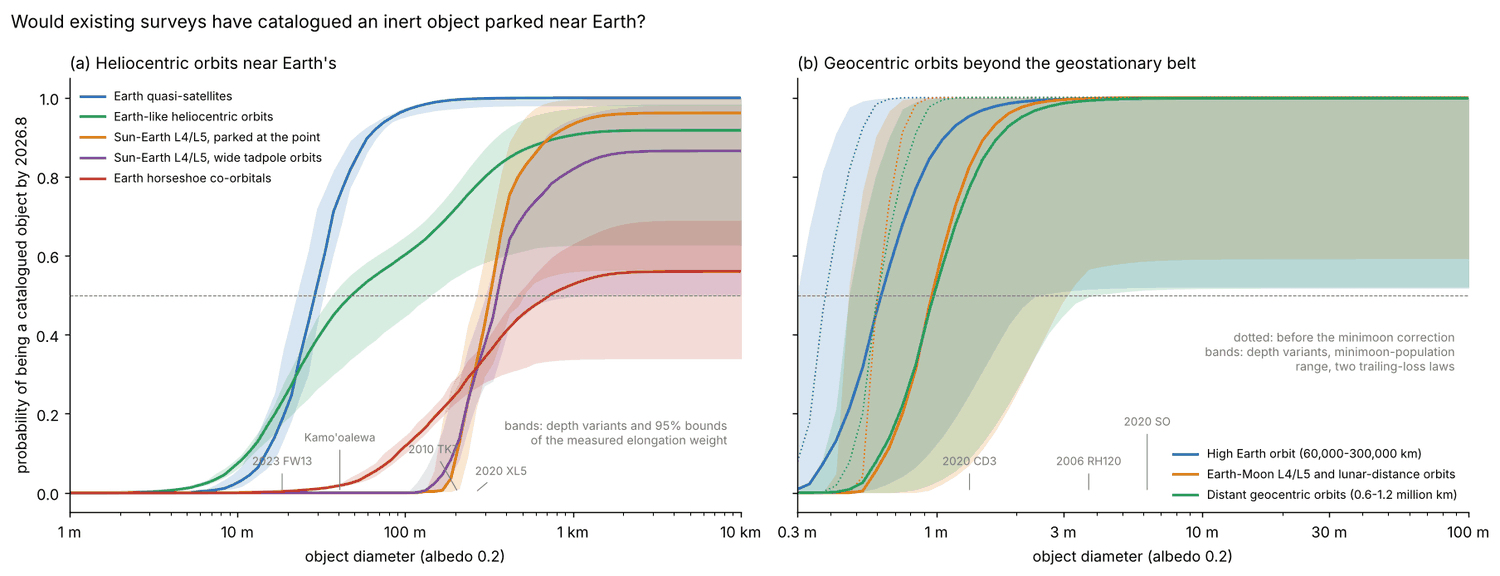
- Parked classes. 500 synthetic objects each: Sun-Earth L4/L5 (parked; wide tadpoles), horseshoes, quasi-satellites, Earth-like heliocentric orbits, and three geocentric shells. Published dedicated Earth-Trojan searches are added for L4/L5 (efficiency 0.18 for H below about 19.5 at each point).
- Geocentric correction. The simulator at face value predicts 7-13 minimoon discoveries since 2005; two are known. A factor on the nightly probability is solved so that exactly two are returned. Its range combines the Poisson error on two objects with an assumed factor-4 uncertainty of the minimoon population; the lower end is floored so that the simulator does not contradict (95%) the fraction of catalogued human objects in high Earth orbit that surveys have picked up. The trailing-loss law is fitted below 10 deg/day and is used here at 2.4-213 deg/day; a theoretical law is run as an alternative.
- Belts and beyond. Turnover of the MPCORB absolute-magnitude distribution against the bright-end power law; beyond 5.5 au a photometric bound.
- Recognition scenario. Measured inputs (fraction of objects with arcs of 45 days or more; fraction with any physical characterisation, by absolute magnitude; the 12 artificial objects among 18 deletion notices since 2010 and how each was recognised) combined with judgement parameters, each with low / central / high values. Low and high set every parameter low or high together: scenario envelopes, not confidence intervals.
- Priors over 15 locations. A: equal weight per location (Earth-centric by construction: 10 of 15 bins are near Earth); B: Earth-watching; C: belt and outer system (0.4 main belt, 0.2 outer system).
- Interstellar objects. Hyperbolic trajectories injected into the same simulator give an effective volume.
Results
1. Survey coverage versus solar elongation (measured)
| Elongation (deg) | Real first observations | Weight (1 = opposition) | 95% range | First version assumed |
|---|---|---|---|---|
| below 45 | 2 | 0 | below 0.0002 | 0 |
| 45-60 | 35 | 0.0046 | 0.0031-0.0068 | 0 |
| 60-70 | 62 | 0.015 | 0.011-0.021 | 0.06 |
| 70-80 | 101 | 0.027 | 0.021-0.034 | 0.20 |
| 80-90 | 293 | 0.093 | 0.073-0.118 | 0.38 |
| 90-105 | 937 | 0.19 | 0.15-0.23 | 0.53 |
| 105-120 | 763 | 0.27 | 0.22-0.33 | 0.62 |
| 120-135 | 1,486 | 0.55 | 0.43-0.71 | 0.70 |
| 135-150 | 2,917 | 0.74 | 0.51-1.08 | 0.79 |
| above 150 | 8,113 | 1 (norm) | 0.87-0.96 |
Only 0.13% of first observations are below 60 deg and 1.7% below 90 deg. Surveys do reach 45-60 deg, at about half a percent of the opposition rate; the first version's assumed footprint was 3-8 times too generous between 65 and 105 deg and wrongly zero below 60 deg. The weights are nearly the same for every depth variant (0.0046-0.0049 at 45-60 deg).
2. Completeness by location (albedo 0.2)
| Location | Basis | Smallest size with 50% (range) | Note |
|---|---|---|---|
| Lunar surface, in archive | measured | 1.6 m (imaged at 2 pixels) | 100% of points at 2 m or finer |
| Lunar surface, catalogued | judgement | about 0.8 km (0.2-1 km) | 1% at 3-30 m (range 2e-6 to 30%) |
| Mars surface, in archive | measured | 13 m (CTX); 3.6% at 1 m (HiRISE) | catalogued: as the Moon |
| Mercury, Venus, Ceres | literature | 0.6 km (0.5-1.6 km) | 250-500 m per pixel |
| Earth orbit below 60,000 km | literature | 1 m | tracking networks |
| High Earth orbit, 60,000-300,000 km | simulated | 0.7 m (0.3-2.7 m) | |
| Earth-Moon L4/L5 and lunar distance | simulated | 1.05 m (0.5-3.3 m) | |
| Distant geocentric, 0.6-1.2 million km | simulated | 1.05 m (0.5-4.2 m) | |
| Earth quasi-satellites | simulated | 30 m (24-40 m) | |
| Earth-like heliocentric, 0.9-1.1 au | simulated | 50 m (40-150 m) | plateau 0.92 (0.63-0.98) |
| Sun-Earth L4/L5, parked | simulated | 0.35 km (0.3-0.6 km) | plateau 0.96 (0.56-1.0) |
| Earth horseshoes | simulated | 0.75 km, or not reached | plateau 0.56 (0.34-0.69) |
| Other near-Earth orbits | measured | 0.2 km | 0.21 at 100 m, 0.94 at 1 km |
| Main belt | measured | 0.4 / 0.6 / 0.9 km (inner / middle / outer) | 90%: 0.7 / 1.0 / 1.3 km |
| Jupiter Trojans | measured | 3 km | 90%: 5 km |
| Beyond 5.5 au | bound | not reached | 9% (7-12%) at 10 km |
Ranges for simulated rows span the five depth variants, the 95% bounds of the measured coverage, and for geocentric rows the correction-factor range and both trailing laws.
3. Sun-Earth L4/L5
A parked object sits at 54-65 deg elongation. With measured coverage, a 1 km object is catalogued with probability 0.93 (0.65-0.98 across depth variants; 0.56-1.00 including the coverage bounds); at 300 m the probability is 0.43 (0.30-0.61). Published dedicated searches alone give 0.20. For comparison, assumed sharp footprint edges give 1.00 (45 deg), 0.62-0.83 (60 deg), 0.27-0.36 (65 deg) and 0.20 (70 deg): the first version's 0.67 was a knife-edge artefact of placing the edge at exactly 60 deg. The plateau below 1 should not be read as a real chance of missing a multi-kilometre object: such an object would be about 14th magnitude, and shallow all-sky surveys are not in the model.
4. Geocentric orbits
The correction factor that returns two minimoons is 0.07-0.17 (0.11-0.24 with the theoretical trailing law). The first version's rule would have returned 2.4-3.9, as the referee found. Probability that a 1 m object is catalogued: 0.87 in high Earth orbit, 0.54 at lunar distance, 0.52 in distant orbits, with ranges of 0.06 to 1.0. With minimoons alone the lowest factor gives a 50% size of 5-13 m or none; the hardware floor brings that to 2.4-4.2 m. Check: of 26 catalogued human objects of 1 m or more with apogee above 60,000 km, 18 (69%; 95% range 48-86%) are in Gray's list of objects tracked from asteroid-survey astrometry, against a simulator mean of 0.98; four of the eight missing are operating spacecraft.
5. Probability that one artefact has been found
| Prior | Size | In archive | Catalogued (envelope) | Catalogued, no surfaces | Recognised (envelope) | N95 |
|---|---|---|---|---|---|---|
| A | 1 m | 0.21 | 0.20 (0.04-0.28) | 0.20 | 0.0020 (0-0.027) | 1,500 |
| A | 10 m | 0.35 | 0.28 (0.18-0.32) | 0.27 | 0.0045 (0.0002-0.049) | 660 |
| A | 100 m | 0.53 | 0.40 (0.29-0.45) | 0.39 | 0.28 (0.09-0.41) | 9 |
| A | 1 km | 0.81 | 0.79 (0.54-0.84) | 0.61 | 0.50 (0.16-0.70) | 4.3 |
| B | 1 m | 0.27 | 0.25 (0.04-0.38) | 0.25 | 0.0025 (0-0.035) | 1,200 |
| B | 10 m | 0.61 | 0.36 (0.22-0.44) | 0.36 | 0.0062 (0.00004-0.11) | 480 |
| B | 100 m | 0.79 | 0.54 (0.39-0.64) | 0.53 | 0.38 (0.11-0.59) | 6.2 |
| B | 1 km | 0.95 | 0.92 (0.62-0.96) | 0.68 | 0.71 (0.24-0.95) | 2.4 |
| C | 1 m | 0.021 | 0.016 (0.003-0.028) | 0.015 | 0.00015 (0-0.002) | 20,000 |
| C | 10 m | 0.079 | 0.023 (0.015-0.054) | 0.022 | 0.0016 (0.0002-0.019) | 1,900 |
| C | 100 m | 0.16 | 0.068 (0.054-0.11) | 0.064 | 0.034 (0.007-0.090) | 86 |
| C | 1 km | 0.63 | 0.61 (0.44-0.69) | 0.48 | 0.17 (0.06-0.25) | 16 |
N95 is the largest number of such artefacts compatible at 95% with none recognised (central scenario). Every 'recognised' value holds only under the stated judgement parameters (attribution 1%, range 0-10%; examined fraction 1%). At albedo 0.01 the catalogued probability at 1 m falls to 0.035 (A) and 0.025 (B). Nobody can state that no artefact is in the catalogues: 95 objects on the Project Pluto index and 55 in Gray's list are unidentified.
6. Interstellar objects
Three are known (1I, 2I, 3I); no fourth is confirmed as of 2026-10-12 and there is no credible candidate (a June 2026 Rubin community-forum post reported a linkage that the survey's Solar System team judged almost certainly spurious; it was withdrawn). One inert detection in an effective volume of 11.0 au3 gives 0.09 au^-3 for 'Oumuamua-like bodies, with a single-event Poisson interval of 0.002-0.5 (95%); simulator variants span 0.078-0.091 and a cold velocity distribution gives 0.05. Do et al. (2018) found 0.2. Upper limits (95%): 7.5e-5 au^-3 at 10 km, 2.0e-3 at 1 km, 0.68 at 100 m, about 900 at 10 m (extrapolated).
Robustness checks
Discovery-magnitude test (suggested by the referee; 249 real Earth-like and co-orbital asteroids):
| Limit, last era | History-fit rms | Median V | Fainter than 22.0 | Fainter than 22.5 | PIT mean | |
|---|---|---|---|---|---|---|
| Real | 20.81 | 8.4% | 2.0% | |||
| shallow | 21.3 | 0.55 | 20.92 | 11% | 3.3% | 0.46 |
| base | 21.8 | 0.49 | 21.08 | 15% | 5.0% | 0.41 |
| hard22p5 | 21.8 | 0.63 | 21.03 | 12% | 0% | 0.43 |
| deep (old baseline) | 22.8 | 0.41 | 21.36 | 27% | 11% | 0.33 |
| vdeep | 23.3 | 0.32 | 21.63 | 39% | 23% | 0.27 |
A calibrated model gives a PIT mean of 0.50 (standard error 0.015). None passes, and the completeness history prefers exactly the depths this test rejects. The model is mis-specified (one efficiency curve cannot stand for many surveys). The 50% sizes are nonetheless stable because the nightly probabilities are refitted: quasi-satellites 24-33 m and Earth-like orbits 42-118 m across the five variants.
- Discovery dates. 0.3-1.0% of the 306 real discoveries are called impossible as too faint and 1.6% by geometry; the discovery-date distribution is consistent in every variant (KS distance 0.055-0.072, 5% critical value 0.079). First-observation elongations of these objects match the model (below 90 deg: 5 real, 1.6 predicted).
- Orbit classes not used in the fit (base). Predicted over catalogued is 0.66-1.48 for Amors, Apollos and Atens brighter than H = 25.25; faint Amors 0.41, low inclinations 0.46-0.89, inclinations above 25 deg 1.3-2.9.
- Human hardware in heliocentric orbit. 162 objects of 1 m or more; 2.7-3.5 serendipitous detections expected, 3 to 6 found depending on the counting rule. This is an order-of-magnitude check on the total only: the objects actually recovered (2020 SO, J002E3, 2018 CN41, possibly 2024 BY15) get model probabilities of 0.00-0.02, and the expected total comes from objects not known to have been recovered.
- Ten more years at Rubin depth (a scaling exercise): 50% sizes fall to about 12 m (quasi-satellites), 37 m (Earth-like), 0.13 km (L4/L5) and 0.3-0.4 m (geocentric).
Limitations
- The found-and-recognised probability is not measured. It is a detection layer times judgement parameters, and under the Earth-centred priors most of the weight at 1-10 m sits on geocentric rows that rest on two minimoons and an extrapolated trailing law.
- The simulator is a five-parameter hazard model that fails the magnitude test; depth is uncertain by about +-1.5 mag.
- The measured coverage inherits the population model at low elongation, rests on 35 and 62 objects in the two bins that matter for L4/L5, and is a 28-year average (48 of the 111 discoveries at 45-70 deg date from 2005-2010).
- 'Catalogued' for surfaces is a judgement. 'In archive' for orbits is a lower bound.
- Not covered: Sun-Earth L1, L2 and L3 (L1 and L3 cannot be observed from the ground; all three are unstable for an inert object); icy moons and small-body surfaces ('other solid surfaces' means Mercury, Venus and Ceres only); non-optical signatures; concealment.
- The 18 deletion notices are 'notices since 2010', not a census. Of the 95 unidentified objects on the Project Pluto index, 72 have periods of 10-50 hours (transfer-type debris); 9 have periods above 3.5 days and 4 above 10 days.
- The belt recognition factor still contains a judged flagging probability of 0.1 (0.001-1); the characterised fraction is now measured by size (0.94 at 10 km, 0.04 at 1 km in the main belt).
Closest prior work and what is new
The closest work is Pan et al. (2026, Research Square, doi 10.21203/rs.3.rs-10268655/v1): detection probabilities for seven regions taken from published completeness figures, three residence weightings and posterior bounds on the number of probes. Under their weights my catalogued probabilities are 0.0022, 0.0085 and 0.20 at 10 m, 100 m and 1 km (their default scenario: 0.0019, 0.021, 0.18) and 0.21, 0.39 and 0.76 for their 'lurker' scenario (theirs: 0.035, 0.24, 0.43); my recognised probabilities are far lower at 10 m (5e-5 and 0.003). Their bounds (14.3, 3.2, 0.68) are far below the likelihood-only value for their own probabilities (about 1,600, 140 and 16), so they are set mainly by their prior; mine use no prior on the number. They state that recognition is not modelled. Other prior work: Lazio (2026, qualitative); Haqq-Misra & Kopparapu (2012, framework without measured completeness); Freitas & Valdes (1980) and Valdes & Freitas (1983), photographic searches of the Earth-Moon and Sun-Earth libration points to 14th-19th magnitude, which correspond to objects of tens of metres at lunar distance against the roughly 1 m reached now; Gregg & Wiegert (2022, lunar Trojans); Davies & Wagner (2013, proposal to search LROC images); Lesnikowski et al. (2020, 64 km2); Bickel et al. (2020), a neural-network scan of more than 2 million NAC images that mapped 136,610 rockfalls, which shows the archive can be machine-scanned globally but would not flag an artefact; Crawford (2026).
The region-by-size synthesis with location weightings is therefore not new. New: the measured elongation coverage; the measured image coverages (HiRISE 3.59%, LROC at random points); the simulator applied to parked classes together with a test that exposes its mis-specification; and the three-tier split tied to the recognition record. NEO completeness and the interstellar density are updates of published results.
Implications for the Fermi Paradox
'No artefacts have been found in the Solar System' is weak evidence. For one inert object of 1-10 m the probability of being catalogued and recognised is below 1% under every prior (at most 11% with every judgement parameter set high), so hundreds to thousands are compatible with the null result. Even with perfect recognition, 64-98% of such objects would be in no catalogue. The null result has force only for objects of about 100 m or more in geocentric, quasi-satellite or Earth-like orbits, and for kilometre-scale objects near Earth, on the Moon or in the inner belt. Below about 0.4-1 km in the belt, 3 km among the Trojans and 10 km beyond, nothing is constrained. A Fermi model should multiply any 'they would be here' term by a found-probability of this kind. The cheapest gains are in recognition: characterising the handful of unidentified geocentric objects with periods above a few days, and anomaly searches on the lunar archive that already exists.
Response to referee
- L4/L5 knife-edge (major). Accepted. 'Never above 67%' and '0.67 (0.56-0.80)' are deleted. Instead of leaving the coverage unmeasured I measured it (section 1): result 0.93 (0.56-1.0) at 1 km, 50% size 0.35 km (0.3-0.6 km). The referee's edge sensitivity is reproduced and shown, and the report states that the plateau does not apply to multi-kilometre objects. The requested wording 'unmeasured coverage' was not used because it is no longer true.
- Depths too deep (major). Accepted. The discovery-magnitude test is added and reproduces the referee's real-object numbers exactly; the central variant now uses published depths; 'the deep variant fits best' is deleted; the depth systematic is stated as about +-1.5 mag; ranges widened.
- 'Detected' meant two things (major). Accepted. Three tiers throughout; surfaces are 'imaged at 2 pixels or more'; found-probability is shown with and without surfaces (prior B at 10 m: 0.61 in archive, 0.36 catalogued; prior A: 0.35 and 0.28, matching the referee).
- Geocentric uncertainty (major). Accepted. Factor solved self-consistently (0.07-0.17 or 0.11-0.24; referee 0.08-0.22), factor-4 population uncertainty propagated, extrapolation stated, second trailing law added, and the validation against GCAT deepcat done. I quote 'about 1 m (0.3-4 m)' and give 5-13 m or not reached without the hardware floor; the referee's 0.6-7 m lies inside that.
- Pan et al. not cited (major). Accepted. Cited as closest prior work with a numerical comparison; novelty restated.
- Human-hardware 'validation' (major). Accepted. Downgraded to an order-of-magnitude check; recovered objects get 0.00-0.02; the count is given as 3 to 6.
- 'Oumuamua density. Accepted: 0.09 au^-3 with Poisson interval 0.002-0.5.
- 'Only published anomaly search'. Accepted: reworded; Bickel et al. (2020) cited (verified from the abstract; the latitude range is the referee's reading).
- Belt characterisation. Accepted: now a function of absolute magnitude.
- 95 unidentified objects. Accepted: period distribution given; remark restricted to the 9 above 3.5 days.
- Prior A. Accepted: described as Earth-centric; 'other solid surfaces' limited to Mercury, Venus and Ceres.
- Small slips. Corrected: 25 bins; 24 of 306 (8%); Markwardt efficiency 0.18; figure 2c replaced; 'data-driven rows' sentence deleted and provenance listed per row; envelopes relabelled. On Lu et al.: 14.5 is not in the abstract but is in their section 4.2 (differential limit); I use 0.18, between the two.
- Omissions. Added: L1/L2/L3 sentence, Freitas & Valdes, Davies & Wagner, 'notices since 2010'.
- Interstellar candidate. Partly accepted: 'no confirmed fourth' is added, but the forum candidate was judged almost certainly spurious and withdrawn, so I do not call it an open candidate.
- Items the referee allowed me to list as not done. Both were done (hardware validation; coverage below 75 deg).
On the strongest objection: I agree. The recognised probabilities are a structured scenario on top of a simple simulator, and the report now says so wherever they appear. What survives is the contrast of orders of magnitude between sizes and places, not the first version's precision.
Reproducibility
Entry point: code/run_all.py (20 minutes with network
caches; --full re-queries Horizons and ODE, 3-4 hours).
Figures: figures/fig1_completeness_matrix.png (three
tiers), fig2_survey_calibration.png (fit, validation,
measured coverage, magnitude test), fig3_parked_orbits.png,
fig4_surfaces_and_belts.png,
fig5_found_probability.png. Main tables:
data/elong_weight_measured.csv,
parked_elong_sensitivity.csv,
geocentric_kappa.csv, heo_hardware_check.csv,
discovery_magnitude_test.csv,
completeness_table.csv, found_probability.csv,
pan2026_comparison.csv, iso_summary.json.
Key numbers
| Quantity | Value | Uncertainty | Note |
|---|---|---|---|
| Lunar surface imaged at 2 m per pixel or finer (LROC NAC, 500 random points) | 100% | 95% lower bound 99.2%; 96.0% (93.9-97.4%) at 1 m or finer; median best scale 0.71 m | Tier 1 (in archived data) only. No metre-scale catalogue of lunar features exists. |
| Mars covered by HiRISE (union of 103,491 RED footprints) | 3.59% | +-0.01% Monte Carlo; referee's independent method 3.56% +- 0.015% | 1.25% at 0.3 m per pixel map scale or finer; CTX covers 100% at 7 m or finer |
| Fraction of the Moon covered by the only published search aimed at artificial objects that I found | 1.7e-6 | 64 km2 (Lesnikowski et al. 2020) | Near-global automated scans exist for natural features (Bickel et al. 2020: more than 2 million NAC images, 136,610 rockfalls) and would not flag an artefact |
| Measured survey coverage weight at 45-60 deg solar elongation, relative to opposition | 0.0046 | 95%: 0.0031-0.0068 (35 real first observations; Poisson and Monte Carlo) | 60-70 deg: 0.015 (0.011-0.021); 70-80 deg: 0.027; 80-90 deg: 0.093; 90-105 deg: 0.19. First version assumed 0 below 60 deg and 0.06-0.53 at 65-97 deg |
| Sun-Earth L4/L5 (parked): probability a 1 km object is catalogued | 0.93 | 0.56-1.00 over five depth variants and the 95% bounds of the measured coverage | Replaces 'never above 67%'. With an assumed sharp footprint edge instead: 1.00 (45 deg), 0.62-0.83 (60 deg), 0.27-0.36 (65 deg), 0.20 (70 deg, dedicated searches only). The plateau below 1 for multi-kilometre objects is a model property, not a real chance of missing a V~14 object |
| Sun-Earth L4/L5 (parked): size catalogued with 50% probability (albedo 0.2) | about 0.35 km | 0.3-0.6 km | 0.7 km at albedo 0.05, 1.5 km at albedo 0.01 |
| Geocentric orbits 60,000 km to 1.2 million km: size catalogued with 50% probability | about 1 m (0.7 m high Earth orbit; 1.05 m lunar-distance and distant orbits) | 0.3-4 m (depth variants, two trailing-loss laws, minimoon factor 0.008-1 floored by human hardware); 5-13 m or not reached if the hardware floor is dropped | Simulated, calibrated on two minimoons; trailing-loss law fitted below 10 deg/day and used at 2.4-213 deg/day |
| Minimoon correction factor on the nightly probability (solved so the simulator returns 2 minimoons) | 0.07-0.17 (empirical trailing law); 0.11-0.24 (theoretical law) | range 0.008-1 after Poisson error on 2 objects, factor-4 population uncertainty and hardware floor | First-version rule 2/N would have returned 2.4-3.9 minimoons, as the referee found |
| Earth quasi-satellites: 50% size | 30 m | 24-40 m | simulated |
| Earth-like heliocentric orbits (0.9-1.1 au): 50% size | about 50 m | 40-150 m; plateau for large objects 0.92 (0.63-0.98) | simulated |
| Earth horseshoe co-orbitals: plateau probability for large objects | 0.56 | 0.34-0.69; 50% reached at 0.5-1.5 km or not at all | simulated; decades spent behind the Sun |
| Other near-Earth orbits: catalogue completeness (catalogue / NEOMOD2) | 0.21 at 100 m, 0.53 at 200 m, 0.94 at 1 km | Harris & Chodas 2021 populations give 0.23, 0.61, 0.95 | an update of published completeness with the October 2026 catalogue, not a new result |
| Main belt and Jupiter Trojans: 50% catalogue size | 0.4 / 0.6 / 0.9 km (inner / middle / outer belt); 3 km (Trojans) | 90%: 0.7 / 1.0 / 1.3 km; 5 km | from the turnover of the MPCORB absolute-magnitude distribution (1,572,538 objects) |
| Outer Solar System beyond 5.5 au: fraction of distances at which a 10 km object is brighter than V=22 | 0.09 | 0.07-0.12 | photometric bound; zero below about 3 km |
| Discovery-magnitude test: mean PIT of real first-observation magnitudes (249 Earth-like / co-orbital asteroids) | 0.46 shallow, 0.41 base, 0.33 deep (first-version baseline), 0.27 vdeep | standard error 0.013-0.017; calibrated = 0.50 | Real: median V 20.81, 8.4% fainter than 22.0, 2.0% fainter than 22.5. No variant passes; history fit and this test pull in opposite directions |
| P(one artefact is in archived data), 10 m, priors A / B / C | 0.35 / 0.61 / 0.08 | includes surfaces 'imaged at 2 pixels or more' | |
| P(one artefact is catalogued), 1 m, priors A / B / C | 0.20 / 0.25 / 0.016 | scenario envelopes 0.04-0.28 / 0.04-0.38 / 0.003-0.028 | almost all from the four geocentric bins; 0.035 / 0.025 / 0.003 at albedo 0.01 |
| P(one artefact is catalogued), 10 m, priors A / B / C | 0.28 / 0.36 / 0.023 | 0.18-0.32 / 0.22-0.44 / 0.015-0.054 | without the surface rows: 0.27 / 0.36 / 0.022 |
| P(one artefact is catalogued AND recognised as non-human), 1-10 m, priors A / B / C | 0.2-0.5% / 0.25-0.6% / 0.015-0.16% | scenario envelope 0 to 5% (A), 0 to 11% (B), 0 to 2% (C) | under stated judgement parameters (attribution 1%, range 0-10%; examined fraction 1%); a scenario value, not a measurement |
| P(catalogued and recognised), 100 m and 1 km, priors A / B / C | 100 m: 0.28 / 0.38 / 0.034; 1 km: 0.50 / 0.71 / 0.17 | 100 m: 0.09-0.41 / 0.11-0.59 / 0.007-0.09; 1 km: 0.16-0.70 / 0.24-0.95 / 0.06-0.25 | scenario envelopes (all judgement parameters low or all high), not confidence intervals |
| Largest number of artefacts compatible (95%) with none recognised, priors A / B / C | 1 m: 1,500 / 1,200 / 20,000; 10 m: 660 / 480 / 1,900; 100 m: 9 / 6 / 86; 1 km: 4 / 2.4 / 16 | central scenario; likelihood only, no prior on the number | |
| Known interstellar objects (JPL SBDB, speed at infinity above 20 km/s) | 3 (1I, 2I, 3I) | no confirmed fourth as of 2026-10-12; a June 2026 Rubin forum candidate was judged almost certainly spurious and withdrawn | |
| Number density of 'Oumuamua-like inert bodies (one detection in an effective volume of 11.0 au3) | 0.09 au^-3 | single-event Poisson 95%: 0.002-0.5 (68%: 0.016-0.30); simulator variants 0.078-0.091; cold kinematics 0.05 | an update of Do et al. 2018 (0.2 au^-3), not a new result |
| 95% upper limits on inert interstellar objects (albedo 0.2) | 7.5e-5 au^-3 at 10 km; 2.0e-3 at 1 km; 0.68 at 100 m; about 900 at 10 m | variants within 30% at 100 m and above; the 10 m value is an extrapolation | 6e16 objects per star at 100 m (0.1 stars per pc3) |
| Catalogued human objects in orbit with apogee above 60,000 km and size 1 m or more that asteroid surveys have picked up (Gray's list) | 18 of 26 (69%) | 95%: 48-86%; a lower bound (4 of the 8 missing are operating MMS spacecraft) | simulator central mean 0.98; used as a floor on the minimoon factor |
| Human hardware in heliocentric orbit: expected serendipitous survey detections versus found | 2.7-3.5 expected (162 objects of 1 m or more); 3 to 6 found, depending on the counting rule | order-of-magnitude check on the total only: the objects actually recovered get model probabilities of 0.00-0.02 |
Changes made after the referee report
- Three explicit tiers everywhere (code, tables, figures 1 and 5): in archived data / catalogued / recognised. Surface rows of tier 1 are labelled 'imaged at 2 pixels or more'; tier 2 for surfaces is imaged coverage times a judged examined fraction; found-probability is given with and without the surface rows.
- New step s01b_discovery_geometry.py: sky geometry on the night of first observation for 35,162 near-Earth asteroids (two-body for 12,061 short-arc orbits, 4,031 JPL Horizons queries for the rest, stratified).
- Survey coverage versus solar elongation is now MEASURED in s02 (real first observations divided by the simulator's flat-coverage prediction, fixed-point iteration, separately for each depth variant, 95% bounds from Poisson and Monte Carlo error) and replaces the assumed ramp starting at exactly 60 deg. Ramps with edges at 45, 60, 65 and 70 deg are kept as a sensitivity table.
- Sun-Earth L4/L5: 'never above 67%' and '0.67 (0.56-0.80)' deleted. New result 0.93 (0.56-1.0) at 1 km and a 50% size of about 0.35 km (0.3-0.6 km), with the statement that the plateau does not apply to multi-kilometre objects. Dedicated-search efficiencies corrected (Markwardt 0.12 -> 0.18; Lu et al. 0.16-0.21).
- Central simulator variant changed from the deep limits (22.5-22.8) to the published depths (21.0-21.8); variants shallow / deep / vdeep / hard22p5 span about +-1.5 mag. 'The deep variant fits best' deleted.
- Discovery-magnitude test added (s05, figure 2d): no variant passes; reported as model mis-specification.
- Geocentric classes: minimoon factor solved self-consistently, range from Poisson error combined with a factor-4 population uncertainty, second (theoretical) trailing-loss law, extrapolation stated; new validation against catalogued human objects above 60,000 km (GCAT deepcat versus Gray's survey-astrometry list), used as a floor on the factor. 50% size now 'about 1 m (0.3-4 m; 5-13 m or not reached without the floor)'.
- Human-hardware comparison in heliocentric orbit downgraded to an order-of-magnitude check on the total; model probabilities of the recovered objects (0.00-0.02) reported; 'tested on / validated on human hardware' removed.
- Recognition model: characterisation fraction for belts, Trojans and TNOs is now a function of absolute magnitude (new SBDB query); every recognised probability carries the judgement-parameter qualifier; low-high bands relabelled scenario envelopes.
- Interstellar: Poisson interval of the single detection added (0.002-0.5 au^-3 at 95%), variant spread reported separately, statement on the unconfirmed Rubin candidate added.
- Synthesis: per-tier provenance (measured / simulated / literature / bound / judgement) in tables and figure 1; 'the detected rows are data-driven' deleted; comparison table with Pan et al. 2026 under their residence weights (data/pan2026_comparison.csv).
- Project Pluto unidentified objects qualified by orbital period (72 of 95 at 10-50 h, 9 above 3.5 d); MPEC tally called 'notices since 2010'; prior A described as Earth-centric; 'other solid surfaces' stated as Mercury, Venus and Ceres only; sentence on Sun-Earth L1/L2/L3; citations of Pan et al. 2026, Bickel et al. 2020, Freitas & Valdes, Davies & Wagner, Gregg & Wiegert, Crawford added.
- Small corrections: 25 NEOMOD2 bins; 24 of 306 (8%) with first observation more than a year before designation; figure 2c replaced by the measured coverage and the elongation check now uses real first-observation elongations.
- Whole pipeline rerun from run_all.py (20 minutes with network caches); stale first-version output parked_thresholds_lowelong.csv removed; all data files and the five figures are from the final code.
Referee points not accepted
- Requested L4/L5 wording 'between about 0.2 and about 1, set by unmeasured survey coverage between 45 and 70 deg': not adopted as worded, because the coverage is now measured (35 real first observations at 45-60 deg and 62 at 60-70 deg; weights 0.46% and 1.5% of opposition). The result is 0.93 (0.56-1.0) at 1 km. The referee's sensitivity numbers for assumed sharp edges are reproduced and kept in the report (1.00 / 0.62-0.83 / 0.27-0.36 / 0.20), and the referee's underlying point (the old 0.67 was a knife-edge artefact) is accepted in full.
- 'The 14.5 used for Lu et al. is not in the abstract': true of the abstract (cumulative limit of about 19), but 14.5 is in the paper, section 4.2, as the differential limit at H = 19.1. I now use 0.18, the middle of the 0.16-0.21 that the two limits imply.
- 'Add: one unconfirmed Rubin candidate reported informally': the forum thread shows that a member of the LSST Solar System team judged the linkage to have almost no chance of being real and that the poster withdrew it; no designation exists. The report says 'no confirmed fourth interstellar object and no credible candidate', and describes the post.
- Geocentric range 'about 0.6-7 m': I quote 0.3-4 m, because the lower end of the correction factor is floored by the new human-hardware check; the report also gives the range without the floor (5-13 m or not reached), which contains the referee's 7 m.
- 'List as not done' (validation of the geocentric classes against catalogued human objects above 60,000 km; measurement of real survey coverage below 75 deg elongation): both were done instead of being listed as undone.
Figures
Code
Every number above is produced by these scripts from public data. The data tables themselves are not hosted here; the scripts download them.
common.py run_all.py s00_download.py s01_neo_completeness.py s01b_discovery_geometry.py s02_calibrate_surveys.py s03_fetch_earthlike_ephem.py s04_fetch_ode_samples.py s05_parked_orbits.py s06_belts.py s07_surfaces.py s08_recognition.py s09_interstellar.py s10_synthesis.py s11_figures.py simlib.py
Referee report
A second, separate analysis re-ran the code, recomputed the main numbers by its own route and tried to break the result. Like the first, it was run by Claude for this project; it is not an outside expert. In its report “the analyst” is the first analysis, which wrote the paper, and file names that are not linked on this page are its own working files. The paper above is the version revised in response.
Verdict: sound with fixes. Results reproduced: yes.
RERUN. I copied code/ to a scratch tree with only the hand-transcribed NEOMOD2 table and the network-cached ODE/Horizons products as inputs, and ran run_all.py end to end (15.5 min under load). The Granvik sample, orbit histograms, fits, parked-orbit simulations, belts, surfaces, interstellar and synthesis steps were all regenerated. Every output CSV matches the analyst's to a relative difference of 4e-8 or better; the three JSON files that differ do so only in last-digit floats. All headline and Table 1-3 numbers in the report reproduce (0.84 m, 30 m, 59 m, 420 m/0.67, 0.42, P_rec 0.003/0.006/0.39/0.70, N95 480/660/1,900, V_eff 11.3 au^3, limits 7e-5/1.9e-3/0.64/750 au^-3). The Horizons (308 objects) and ODE (1,300 points) queries were not re-issued in full.
INDEPENDENT RECOMPUTATIONS (own code).
- HiRISE union coverage, different method (csv parse, gnomonic projection about each footprint, KD-tree, 1.5 M points): 3.559% +- 0.015% against the analyst's 3.590% +- 0.009%. Agrees (1.7 sigma). Latitude bands and growth by year also agree.
- NEO counts from a different catalogue (MPC NEA.txt, own fixed-width parse): 1,862 / 3,142 / 1,420 objects in the three quoted H bins against 1,885 / 3,163 / 1,446 from JPL SBDB. The live SBDB count today is 42,721 (report: 42,718). NEOMOD2 Table 3 checked row by row against a pdftotext -layout extraction of arXiv:2312.09406: the transcription is correct (25 rows, not 26).
- LROC NAC: 15 fresh random lunar points queried from ODE with a different seed and a smaller box: 15/15 have imagery at 2 m/pixel or finer with incidence 20-85 deg, 13/15 at 1 m or finer, median best scale 0.82 m (analyst: 100%, 93.6%, 0.71 m). Consistent.
- Interstellar count: live SBDB query for e > 1.05 returns the same 5 objects, 3 with v_inf > 20 km/s. Back-of-envelope on the effective volume: Do et al. (2018) imply about 1.4 au^3 per year for Pan-STARRS alone; the simulator gives 0.7 (disc) to 1.5 (cold) au^3 per year for 2021-2026. Agreement within a factor of two, as the report says.
- Geocentric back-of-envelope: 2 minimoons found out of about 27 captures of 1 m or larger since 2005 gives a discovery hazard near 0.09 per object-year, hence P about 0.8 for a 1 m object parked for 20 survey-years. That matches the simulator's 0.73-0.78, so the central value is self-consistent; the uncertainty is the problem (see errors).
- Main belt: fraction of known objects per H bin designated in 2023-2026 is below 1.5% up to the analyst's H_90 in each zone and rises to 18-30% a magnitude fainter. This independent indicator supports the quoted 90% limits (0.67-1.3 km).
- Co-orbital dynamics: the averaged equation in simlib gives the correct tadpole libration frequency nsqrt(27mu/4) (period 221 yr). Photometry, HG law, per-star conversion and Poisson factors (3.0, 4.74) check out.
- Citations spot-checked against the downloaded texts: NEOMOD2 trailing-loss equations and constants; Bolin et al. 2014 minimoon statements; Markwardt et al. (24% coverage, 12.8% at H=20.4); Lu et al. 2026 (33.24%); Lesnikowski et al. (255,000 tiles, 64 km^2); Do et al. (0.2 au^-3); Marceta and Seligman (0-70 per year); Lazio 2026 Table 2; all 18 MPEC texts against the analyst's reading. All say what is claimed, with the small exceptions listed under errors.
NEW TESTS THAT THE ANALYST DID NOT RUN (logs: vdisc.log, testA.log, testB.log, refit.log in the referee directory) are described under errors: a discovery-magnitude test of the simulator depth, the L4/L5 footprint-edge sensitivity in the pessimistic direction, and the internal consistency of the minimoon correction.
Strongest objection
The quantity the Fermi model needs, the probability that an artefact has been found and recognised, is not measured by this study. It is the product of (a) a detection layer and (b) judgement parameters, and for the priors that matter most both are weak exactly where the weight sits. Under the Earth-watching prior, 0.30 of the 0.32 detected probability at 1 m comes from three geocentric classes whose completeness is a five-parameter hazard model extrapolated to sky rates of 13-214 deg/day (the trailing-loss law is valid below 10), corrected by a factor derived from two minimoons, and never checked against any object in a stable distant orbit; a further 0.25 at 10 m comes from the Moon, where 'detected' means only that pixels exist. The simulator itself fails an independent test: real Earth-like asteroids are first seen at a median V of 20.8 with 8% fainter than 22.0, where the baseline predicts 21.5 and 30%. The recognised probability for 1-10 m objects is then that detection figure multiplied by an assumed 1% chance that a small unidentified object is attributed to a non-human origin. A survey scientist would call this a structured expert elicitation resting on a toy simulator, not a completeness function.
Does the conclusion survive? The qualitative conclusion does, because it rests on contrasts of several orders of magnitude that no reasonable change of parameters removes: metre-to-10-metre inert objects are essentially unconstrained everywhere (even granting perfect detection, nothing in current practice would single one out); objects of 100 m or more in geocentric space, on the Moon or in Earth-like orbits would very probably be known; and below a kilometre in the belts and below 10 km beyond Jupiter nothing is constrained. The depth problem turns out not to move the co-orbital size thresholds much (quasi-satellites 24-33 m, Earth-like orbits 47-75 m across a 2 mag range of assumed limits, because the nightly probability is refitted). What does not survive is the precision: the L4/L5 plateau of 67%, the geocentric 0.84 m with its 0.67-3.7 m range, and any reading of '0.2-0.6%' as a measured number. The final report may cite the direction and rough size of the result, and the directly measured coverages, but not those three figures as stated.
Errors found
- major. The Sun-Earth L4/L5 result (maximum
detection probability 0.67, range 0.56-0.80, 50% size 420 m) is a
knife-edge artefact. L4/L5 sit at 60 deg solar elongation and the
simulator's survey footprint is assumed to start at exactly 60 deg. The
analyst tested only the optimistic direction (45 deg).
- Evidence: My rerun of the same class with the footprint edge moved (testB.log), dedicated searches included: edge 60 deg gives P_max 0.58-0.86; 65 deg gives 0.25-0.41 (surveys alone 0.08-0.28); 70 deg gives 0.18-0.19 (surveys alone below 0.013, i.e. only the published dedicated searches remain); 45 deg gives 1.00. The quoted range 0.56-0.80 is also ordered backwards with depth (shallow 0.80, deep 0.56), which shows the plateau is set by the refitted nightly probability and not by survey reach. A 10 km object at L4 would be about V=14 and the claim that it has a one-in-three chance of being unknown is not credible.
- Fix: Replace 'never above 67%' and '0.67 (0.56-0.80)' by: between about 0.2 (published dedicated searches alone, for objects above roughly 400 m) and about 1, depending on how much survey coverage exists between 45 and 70 deg elongation, which this study does not measure. Drop L4/L5 from the list of numerical 50% sizes or give 210 m to 'not reached'. State that the plateau does not apply to multi-kilometre objects.
- major. The simulator's limiting magnitudes are too
deep, and the report's statement that 'the fit prefers limits 0.5 mag
deeper than the adopted baseline' points the wrong way. The validation
on 306 real asteroids cannot detect a limit that is too deep (a deep
limit never calls a real discovery impossible).
- Evidence: New test (vdisc.log): for the 249 real Earth-like/co-orbital asteroids whose first observation lies in the designation half-month, V on that night (with the trailing term) has median 20.8, 90th percentile 21.9; 8.4% are fainter than 22.0 and 2.0% fainter than 22.5. The baseline simulator predicts median 21.5, 29.5% fainter than 22.0 and 13% fainter than 22.5; the probability-integral transform of the real value in the predicted distribution has mean 0.29 (0.50 if calibrated; standard error 0.018). 'Deep' is worse (0.24, 43% fainter than 22.0). A refit with limits 1.5 mag shallower than baseline (21.0-21.3) gives 0.44. The fitted nightly success probabilities are 0.7-1.7%, which is not a physical survey cadence but a compensation for the deep limit. The completeness-history fit and the discovery-magnitude test pull in opposite directions, which signals model misspecification.
- Fix: Report this test. Describe the depth systematic as about +-1.5 mag, not +-0.5. Remove the sentence that the deep variant 'fits best' as support for depth. Note the good news: because the nightly probabilities are refitted, the 50% sizes are robust (quasi-satellites 24-33 m, Earth-like orbits 47-75 m across limits from 21.0-21.3 to 23.0-23.3). Quote those wider ranges.
- major. 'Detected' means two different things. For
orbital classes it means a designated catalogue object; for surfaces it
means that pixels at D/2 or finer exist in an archive. No global
catalogue of metre-scale lunar or martian features exists, so the
surface rows are 'imaged', not 'detected'. The 'detected' rows of the
found-probability table mix the two.
- Evidence: s10_synthesis.py, Model.detect: lunar and martian completeness is the fraction of sample points with best pixel scale <= D/2. Under the Earth-watching prior the Moon contributes 0.25 of the 0.61 'detected' at 10 m; with a catalogue definition that figure is 0.36 (prior A: 0.35 becomes 0.27). The headline opens 'Detection is largely complete near Earth ... down to about 1.6 m on the Moon', where a 1.6 m object is two pixels among billions of boulders.
- Fix: Use three explicit tiers: in archived data; catalogued; recognised. Label the surface rows 'imaged at 2 pixels or more' and show the found-probability 'detected' row both with and without the surface rows, or with surfaces set to the catalogued fraction (about zero below 100 m).
- major. Geocentric results (0.84 m at 50%, range
0.67-3.7 m; 0.73-0.93 at 1 m) carry too narrow an uncertainty and rest
on an undisclosed extrapolation. These rows supply 0.30 of the 0.32
'detected' probability at 1 m under the Earth-watching prior.
- Evidence: (a) The NEOMOD2 trailing-loss fit is valid only below 10 deg/day (the paper discards faster detections); the three geocentric classes move at 2.5-214 deg/day. The code comment says so, the report does not. (b) The minimoon correction is not self-consistent: with the analyst's factor (0.17-0.25) applied to the nightly probability the simulator still predicts 2.3-3.8 minimoon discoveries, not 2 (testA.log); the factor that returns 2 is 0.08-0.22. (c) The range uses only the Poisson error on two objects; the report itself says the minimoon population is uncertain by a factor of about 4 either way, and that is not propagated. Scanning the factor: 0.05 gives 1.3-1.7 m, 0.02 gives 2-7 m, 0.005 gives no 50% size below about 3-19 m. (d) Both known minimoons were found well inside 1 lunar distance; a 1 m object parked at 0.6-1.2 million km never gets brighter than about V 21.3-22.2, where only 8% of real discoveries occur. (e) No test against any population in stable distant orbits; the GCAT deepcat file was downloaded but not used.
- Fix: Quote the geocentric 50% size as 'about 1 m, plausibly up to several metres (roughly 0.6-7 m)', state the trailing-loss extrapolation in the report, solve for the correction factor instead of using 2/N, and either run or list as undone the obvious validation: the recovery fraction of catalogued human objects of 1 m or more currently above 60,000 km (about 35 in GCAT deepcat with status O) in survey astrometry.
- major. Closest prior work is incomplete. A July
2026 preprint does the same kind of synthesis and is not cited: Pan,
Yang, Gu, Zhang, Jiang and Shi, 'A Bayesian framework for posterior
bounds on self-replicating probes in the Solar System under
observational incompleteness', Research Square, posted 2026-07-08, doi
10.21203/rs.3.rs-10268655/v1.
- Evidence: Its abstract: detection probability reconstructed from published completeness of seven regions (near-Earth objects, Earth co-orbitals, Earth-Moon Lagrange points, lunar surface, main belt, Kuiper belt, distant Solar System), three residence-weight scenarios, 95% upper bounds on the number of probes of 14.3 at 10 m, 3.16 at 100 m and 0.68 at 1 km, and a Rubin/NEO Surveyor forecast. I could read only the abstract and metadata.
- Fix: Cite it as the closest quantitative prior work, compare numbers (the analyst's detection-only N95 at 10 m is about 5-38, similar in order; the recognition-limited 480-1,900 is the real difference), and restate what is new: own simulator and image-coverage measurements instead of published completeness figures, 15 locations, and the detection/recognition split.
- major. The human-hardware comparison (2.8 expected
versus 4 recognised) is presented as a test or validation of the
simulator. It has no discriminating power.
- Evidence: human_hardware_prediction.csv: the expected 2.8 comes mainly from objects not among the four recovered (Artemis I ICPS 0.65, Centaur V-002 0.21, S-IVB-505 0.21, ESC-A 546 0.16, Herschel 0.12), while the objects actually recovered get 0.00 (2020 SO) and 0.03 (J002E3). The count of 4 is also rule-dependent: the analyst's own MPEC table adds 2022 UQ1 (Lucy Centaur), 2018 CN41 and 2020 GL2 as human heliocentric objects designated as asteroids.
- Fix: Describe it as an order-of-magnitude plausibility check on the total only, and remove 'tested on / validated on human hardware' from the method summary and novelty statement.
- minor. The 'Oumuamua-like density is given as 0.09
au^-3 with range 0.05-0.09, which is only the spread between simulator
variants. The Poisson uncertainty of a single detection is omitted.
- Evidence: One event in 11.3 au^3: the 95% interval is 0.0022-0.49 au^-3 (68%: about 0.015-0.29).
- Fix: Quote 0.09 au^-3 with the Poisson interval, and the variant spread separately.
- minor. 'The only published anomaly search' and
'about one millionth of the Moon has been searched' overstate how little
the lunar archive has been machine-examined.
- Evidence: Bickel et al. 2020 (Nature Communications 11, 2862; Bickel is a co-author of the Lesnikowski paper) ran a neural network over more than 2 million NAC images between 80 N and 80 S and mapped 136,610 rockfalls. That was not an artefact search, but it is a near-global automated scan for metre-scale features.
- Fix: Say 'the only published search aimed at artificial objects that I found covers 1.7e-6 of the surface; near-global automated scans exist for specific natural features (rockfalls) and would not flag an artefact'. The central 1% judgement can stay.
- minor. Belt and Trojan recognition uses one
characterisation fraction for all sizes (9% of main-belt objects have an
albedo), so the recognised probability for a 10 km belt object is 0.8%.
Large main-belt objects are far better characterised than the catalogue
average.
- Evidence: s10_synthesis.py uses MBA_frac_albedo = 0.091 from the whole catalogue (1.39 million objects, dominated by sub-kilometre bodies) at every size.
- Fix: Make the characterisation fraction a function of H (it is available from the same SBDB query), or state that the belt-weighted recognised probabilities at 1-10 km (0.16-0.21) are biased low for that reason.
- minor. The '95 unidentified objects in geocentric
orbit' are presented in the implications as an uncharacterised pool
worth attention. Almost all are debris in transfer-type orbits tied to
launch profiles.
- Evidence: Project Pluto list: nearly all entries have periods of 10-50 hours with e 0.6-0.87 (geostationary-transfer and Molniya-like). About seven have periods above 3.5 days, and several of those are tentatively linked to Vela, SOLRAD or WT1190F hardware.
- Fix: State the orbit distribution and restrict the remark to the handful with periods above a few days.
- minor. Prior A ('equal weight on 15 locations') is
described as neutral, but 10 of the 15 bins are the Moon, geocentric
shells and near-Earth co-orbital classes. It is an Earth-centric prior
by construction of the partition.
- Evidence: LOCATIONS and WEIGHTS in s10_synthesis.py.
- Fix: Say so, and note that a volume- or surface-weighted prior would resemble prior C. Also note the 'other solid surfaces' row covers only Mercury, Venus and Ceres; icy moons and the surfaces of all other small bodies are essentially unimaged at these scales.
- minor. Small factual slips.
- Evidence: (ii) '31 of 306 (10%) have archived observations at least a year before designation': with actual dates it is 24 (8%); 32 by calendar-year difference. (iii) Markwardt et al.: the L5 efficiency for H < 19.7 is coverage 0.24 times a recovery near 100% at the bright end (their own limit of 15-18 objects implies 0.17-0.20), not 0.12; the analyst's value is conservative. (iv) Lu et al. abstract gives N(H<19.1) below about 19; the '14.5' used is not in the abstract. (v) Figure 2c labels as 'real discoveries' a model-weighted distribution inside the real discovery half-month; true first-observation elongations give 2.0% below 90 deg. (vi) 'The detected rows are data-driven apart from the priors' (line 153) is not true of the geocentric, low-orbit, other-surface and outer-system rows. (vii) The low-high bands set every parameter low or high together; they are scenario envelopes, not uncertainties.
- Fix: Correct each item as stated.
- minor. Omissions relative to the study plan:
Sun-Earth L1, L2 and L3 are not treated (L1 and L3 are permanently
unobservable from the ground; all three are unstable for inert objects);
Freitas and Valdes (1980, 1983) and Davies and Wagner (2013) are not
cited or compared. The list of 18 MPEC notices starts in 2010 and so is
not a full census of artificial objects that received asteroid
designations.
- Evidence:
- Fix: Add one sentence on L1/L2/L3 with the reason for exclusion, cite the Freitas and Valdes magnitude limits for the Earth-Moon points for comparison, and call the 12-of-18 figure 'notices since 2010'.
- minor. Interstellar count: correct as of the JPL
database, but an unconfirmed candidate exists.
- Evidence: Live SBDB query today returns 1I, 2I, 3I only. A June 2026 post on the Rubin community forum reports a possible interstellar candidate from LSST alert data submitted to the MPC and not confirmed; I found no MPC designation.
- Fix: Keep 'three', add 'no confirmed fourth as of 2026-10-12; one unconfirmed Rubin candidate has been reported informally'.
Overclaims
- Headline: 'Detection is largely complete near Earth'. For the Moon and Mars this means only that pixels exist; nothing is catalogued at metre scale. For geocentric space it is a simulator extrapolation calibrated on two objects.
- 'only 0.4 km at Sun-Earth L4/L5 (never above 67%)' and 'Detection never exceeds 67% (56-80%) at any size'. The value depends entirely on placing the survey footprint edge at exactly 60 deg; the defensible range is about 0.2 to 1.
- 'about 1 m (0.7-3 m) in geocentric space out to 1.2 million km'. The range omits the factor-of-4 population uncertainty, the non-self-consistent correction and the extrapolated trailing loss; roughly 0.6-7 m is defensible.
- 'The detected rows are data-driven apart from the priors.' Four of the fifteen detected rows are simulator extrapolations, three are literature values or a photometric bound.
- 'a simulator calibrated on the real discovery record and tested on real co-orbitals, minimoons and human hardware'. It fails a discovery-magnitude test on those same co-orbitals, over-predicts minimoons five-fold before correction, and assigns near-zero probability to the hardware actually recovered.
- 'The probability that a single 1-10 m artefact has been both found and recognised is 0.2-0.6%'. This equals the detection probability times an assumed attribution probability of 0.01 (range 0-0.1) and an assumed examined fraction of 1%. It is an elicited scenario, not a measurement. The report says so in the body; the headline number should carry the qualifier wherever it is quoted.
- '0.09 per cubic au (0.05-0.09)' for 'Oumuamua-like bodies, without the Poisson interval of a single detection (0.002-0.5).
- 'the only published anomaly search' and 'about one millionth of it has been searched for anomalies', given a published near-global neural-network scan of the NAC archive for rockfalls.
- '95 unidentified objects in geocentric orbit sit on a public list without characterisation' as an implication for artefact searches; nearly all are transfer-orbit debris.
- Novelty statement: 'A single quantitative completeness function over 15 parking locations' as new, without mention of the Pan et al. 2026 preprint.
Novelty check
Novel: partly. The measurements are new or newer than anything I found: random-point LROC NAC coverage (100% at 2 m or finer), HiRISE union coverage (3.6%, which corrects the 'about 1%' in Lazio 2026 Table 2), CTX coverage, October 2026 NEO completeness by bin, and a simulator applied to parked co-orbital and geocentric populations. The detection-versus-recognition split with the MPEC record is also not in the prior work I found. The overall framing is not new. Lazio (arXiv:2606.13797) asks the same question qualitatively; I confirmed its content from the text. More importantly, Pan et al. (Research Square, 2026-07-08, doi 10.21203/rs.3.rs-10268655/v1) already published a region-by-size completeness synthesis with three location weightings and 95% bounds on probe numbers at 10 m, 100 m and 1 km; the analyst did not cite it. The NEO completeness figures reproduce NEOMOD2 and Harris and Chodas with a newer catalogue, and the interstellar density reproduces Do et al. within a factor of two; both should be reported as updates, not as new results. Sources: https://www.researchsquare.com/article/rs-10268655 ; https://doi.org/10.1038/s41467-020-16653-3 ; https://community.lsst.org/t/potential-interstellar-visitor-found-in-april-may-2026-lsst-data/12113
- Pan, Yang, Gu, Zhang, Jiang, Shi 2026, Research Square preprint, doi 10.21203/rs.3.rs-10268655/v1: Bayesian bounds on self-replicating probes from published completeness of seven Solar System regions (not cited by the analyst)
- Lazio 2026, arXiv:2606.13797: Technosignatures in the Solar System (qualitative, with a table of best image resolution per body)
- Haqq-Misra and Kopparapu 2012, arXiv:1111.1212: probabilistic search-completeness framework without measured completeness
- Nesvorny et al. 2024 (NEOMOD2, arXiv:2312.09406) and Harris and Chodas 2021: NEO completeness by absolute magnitude
- Do, Tucker and Tonry 2018, arXiv:1801.02821: interstellar object number density 0.2 au^-3
- Markwardt et al. 2020; Lifset et al. 2021; Lu et al. 2026 (arXiv:2606.31751): Earth Trojan search limits
- Bolin et al. 2014, arXiv:1406.3534: minimoon detectability
- Lesnikowski, Bickel and Angerhausen 2020, arXiv:2001.04634; Bickel et al. 2020, Nat. Commun. 11, 2862 (global neural-network scan of the NAC archive, not cited)
- Crawford 2026, arXiv:2606.00463: SETA and the Fermi paradox (downloaded by the analyst, not cited)
Required changes
- Call the lunar and martian rows 'imaged at two pixels or more'. In the found-probability table give the 'detected' row with and without the surface rows (Earth-watching prior at 10 m: 0.61 with, 0.36 without; equal-weight prior: 0.35 and 0.27).
- State instead that detection probability for objects above about 400 m lies between about 0.2 (dedicated searches alone) and about 1, set by unmeasured survey coverage between 45 and 70 deg elongation (0.58-0.86 at a 60 deg edge, 0.25-0.41 at 65 deg, 0.18-0.19 at 70 deg, 1.0 at 45 deg). Remove the 420/840/1,900 m thresholds or mark them as conditional on a 60 deg edge.
- Add to Method item 1 or 5 that the Catalina trailing-loss law is fitted below 10 deg/day and is extrapolated to 2.5-214 deg/day for geocentric classes. Replace kappa = 2/N by the value that actually returns two minimoon discoveries (0.08-0.22) and propagate the factor-of-4 population uncertainty.
- Robustness section: add the discovery-magnitude test (real median V 20.8, 8.4% fainter than 22.0, 2.0% fainter than 22.5, against baseline prediction 21.5, 29.5%, 13%; PIT mean 0.29). Delete or reverse 'The deep variant fits best' and the limitation 'the fit prefers limits 0.5 mag deeper'. Widen the quoted ranges to quasi-satellites 24-33 m and Earth-like orbits 47-75 m, and say these thresholds are robust to about +-1.5 mag in assumed depth because the nightly probability is refitted.
- Method summary, novelty statement and Results section 2: downgrade the human-hardware comparison to an order-of-magnitude check on the total; remove 'tested on' and 'validated on' human hardware. State that the objects actually recovered receive model probabilities of 0.00-0.03.
- Closest prior work: add Pan et al. 2026 (doi 10.21203/rs.3.rs-10268655/v1) with a numerical comparison, and Bickel et al. 2020. Change 'confidence it is new' wording to: the measurements and the detection/recognition split are new; the region-by-size synthesis with location weightings has a direct precedent. Present NEO completeness and the interstellar density as updates of published results.
- Wherever '0.2-0.6%' (or any 'recognised' probability) is quoted, including the headline and Implications, attach 'under stated judgement parameters (attribution 1%, range 0-10%; examined fraction 1%)'. Relabel the low-high bands as scenario envelopes with all parameters low or all high, not uncertainties.
- Line 153: delete 'The detected rows are data-driven apart from the priors' and list which rows are measured (Moon, Mars, other near-Earth orbits, belts), simulated (seven co-orbital and geocentric rows) or taken from literature or a bound (low Earth orbit, other surfaces, outer system).
- Interstellar section and key numbers: quote the density as 0.09 au^-3 with the single-event Poisson interval 0.002-0.5 (95%), keeping 0.05-0.09 as the model-variant spread. Add 'no confirmed fourth interstellar object as of 2026-10-12; one unconfirmed Rubin candidate reported informally'.
- Line 14 and Implications: change 'the only published anomaly search' to 'the only published search aimed at artificial objects that was found', mention the near-global rockfall scan, and keep the 1.7e-6 figure as the artefact-search area only.
- Implications: qualify '95 unidentified objects in geocentric orbit' with their orbit distribution (nearly all 10-50 hour transfer-type orbits; about seven with periods above 3.5 days).
- Priors: state that prior A is Earth-centric by construction (10 of 15 bins near Earth) and that the 'other solid surfaces' row covers only Mercury, Venus and Ceres.
- Belt recognition: make the characterisation fraction depend on H, or state that the belt-weighted recognised probabilities at 1-10 km are biased low because a catalogue-average 9% is applied at all sizes.
- Small corrections: 25 (not 26) NEOMOD2 bins at line 69; '31 of 306' becomes 24 (8%) by actual dates; relabel Figure 2c 'real discoveries' as 'model-weighted within the real discovery half-month' or replot with first-observation elongations; note that the Markwardt efficiency used (0.12) is conservative against the paper's own 0.17-0.20; add one sentence on Sun-Earth L1/L2/L3 and cite Freitas and Valdes for the Earth-Moon points; call the MPEC tally 'notices since 2010'.
- List as not done: a validation of the geocentric classes against catalogued human objects above 60,000 km (GCAT deepcat was downloaded and not used), and a measurement of real survey coverage below 75 deg elongation.