Where is everybody? · Working papers
Would a past presence on Earth have left a trace?
Revised after a second, separate analysis run for this project tried to break it. Neither analysis is an outside expert.
Would we know? Detectability of a past visit or industrial episode in Earth's rock record
Revised after review. Code: code/run_all.py regenerates
every number and figure below.
Summary. Earth's rock record is close to silent on brief or local past presences and only weakly informative about a planet-wide industrial one. That qualitative result survived a hostile review; several first-pass numbers did not. The one quantity measured directly is how much ancient land surface has been closely inspected: a 100 km2 by 20-kyr cell placed at random in 3-500 Ma land space-time contains a terrestrial fossil collection with probability 1.0e-6, and a 10,000 km2 cell with probability 1.0e-4 (the referee reproduced this to 2% from a fresh download). Turning that into "we would know" needs unmeasured factors. With them, an installation occupied for 10 kyr and buried in deep time is known today with probability about 2.5e-7 (1 km2), 2.5e-5 (100 km2) and 2.3e-3 (10,000 km2) for a random time in the last 500 Myr, and five times less over 2.4 Gyr. Each is uncertain by about a factor of 10 either way, and those ranges are widths of assumed priors, not confidence intervals. Installations of 100 km2 or less would be known essentially only if they date from the last 0.06-0.13 Myr; that surface-survival term is an assumption with no dataset behind it, and it alone produces the first-pass values of 1.2e-4 and 3.4e-4. A human-scale industrial episode would be known with probability about 0.1-0.2 (0.01-0.7) in the last 500 Myr. The 500 GtC of fossil carbon burnt so far would be flagged in under 1% of Cenozoic cases; half of pulses are flagged at 1,500-1,900 GtC; the PETM is the only Cenozoic excursion above 2,000 GtC equivalent. Main caveats: everything between the measured probe and P(known) is assumed, pre-Cenozoic carbon detection is assumed, and the plutonium bound is conditional on an uptake assumption that the modern ocean does not support.
Question
If a visiting installation, or a home-grown industrial episode, existed on Earth at a random time in the past, what is the probability that we would know about it today? The Fermi model needs this before "there is no trace of anyone on Earth" can count as evidence.
Data
| Source | Rows used | Cuts |
|---|---|---|
| Macrostrat API v2 (Peters, Husson & Czaplewski 2018) | North America 949 columns, 24,141 units (20,593 sedimentary); South America 58 columns; Caribbean 64; New Zealand 329; Africa 2; deep sea 132 sites, 7,124 units | Projects 1, 7, 8, 5, 9, 4. Offshore-drilling (eODP) units not used: the API returned HTTP 500 |
| Macrostrat global bedrock map, coarsest scale | 4,000 random land points (fixed seed), 3,560 mapped | Land mask: Natural Earth 1:110m |
| Paleobiology Database (PBDB) | 278,411 unique fossil collections; 47,525 in 36 terrestrial environment classes | Needs coordinates and an age range |
| CENOGRID (Westerhold et al. 2020), PANGAEA 917660 | 23,939 benthic carbon-isotope values, 0-67.1 Ma | 382 rows without a carbon-isotope value dropped |
| DM-SED v0.0.1 (Lai et al. 2025), Zenodo 14771859 | 63,627 marine-sediment geochemical samples, 5,766 sites | Spacing statistics need 5 or more samples and a non-zero age span: 1,076 sites. 799 of 1,875 sites with 5+ samples carry one age and drop out |
Macrostrat column coverage is 32.1 million km2, 22% of land area, 77% of it North America. DM-SED and CENOGRID are single compilations, not a census of what has been sampled.
Method
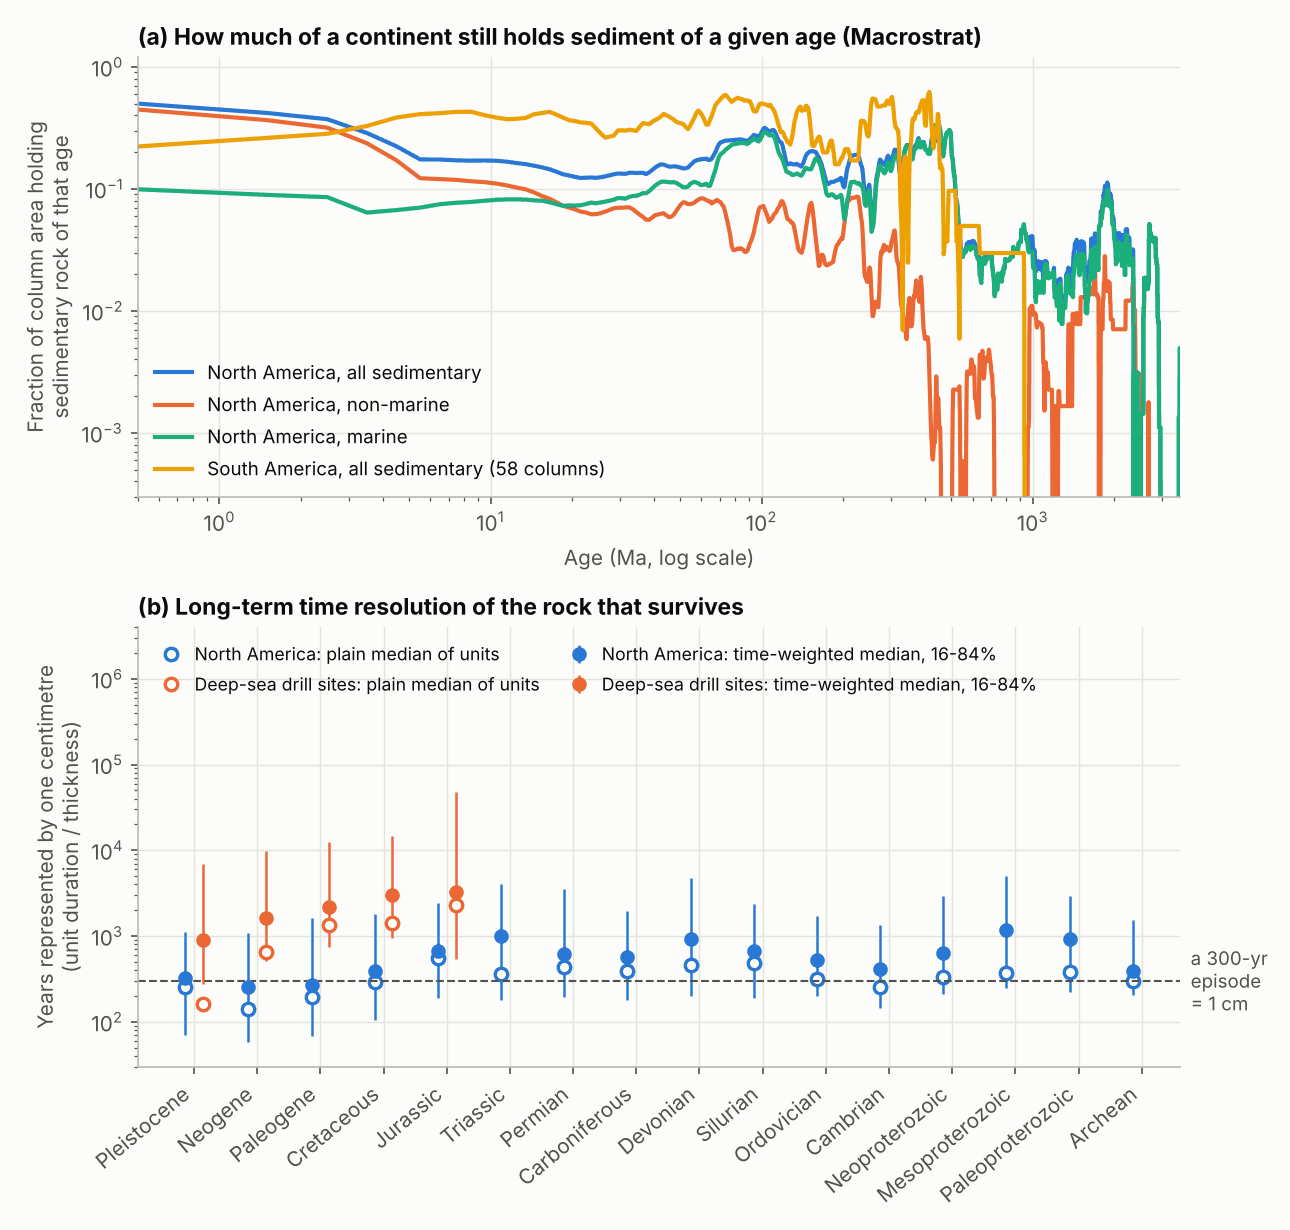
Preservation. From Macrostrat, per 1-Myr step from 0 to 3,500 Ma: the fraction of column area holding sedimentary rock of that age (marine and non-marine), hiatus durations, years per centimetre, and the slope of accumulation rate against time span (Sadler effect).
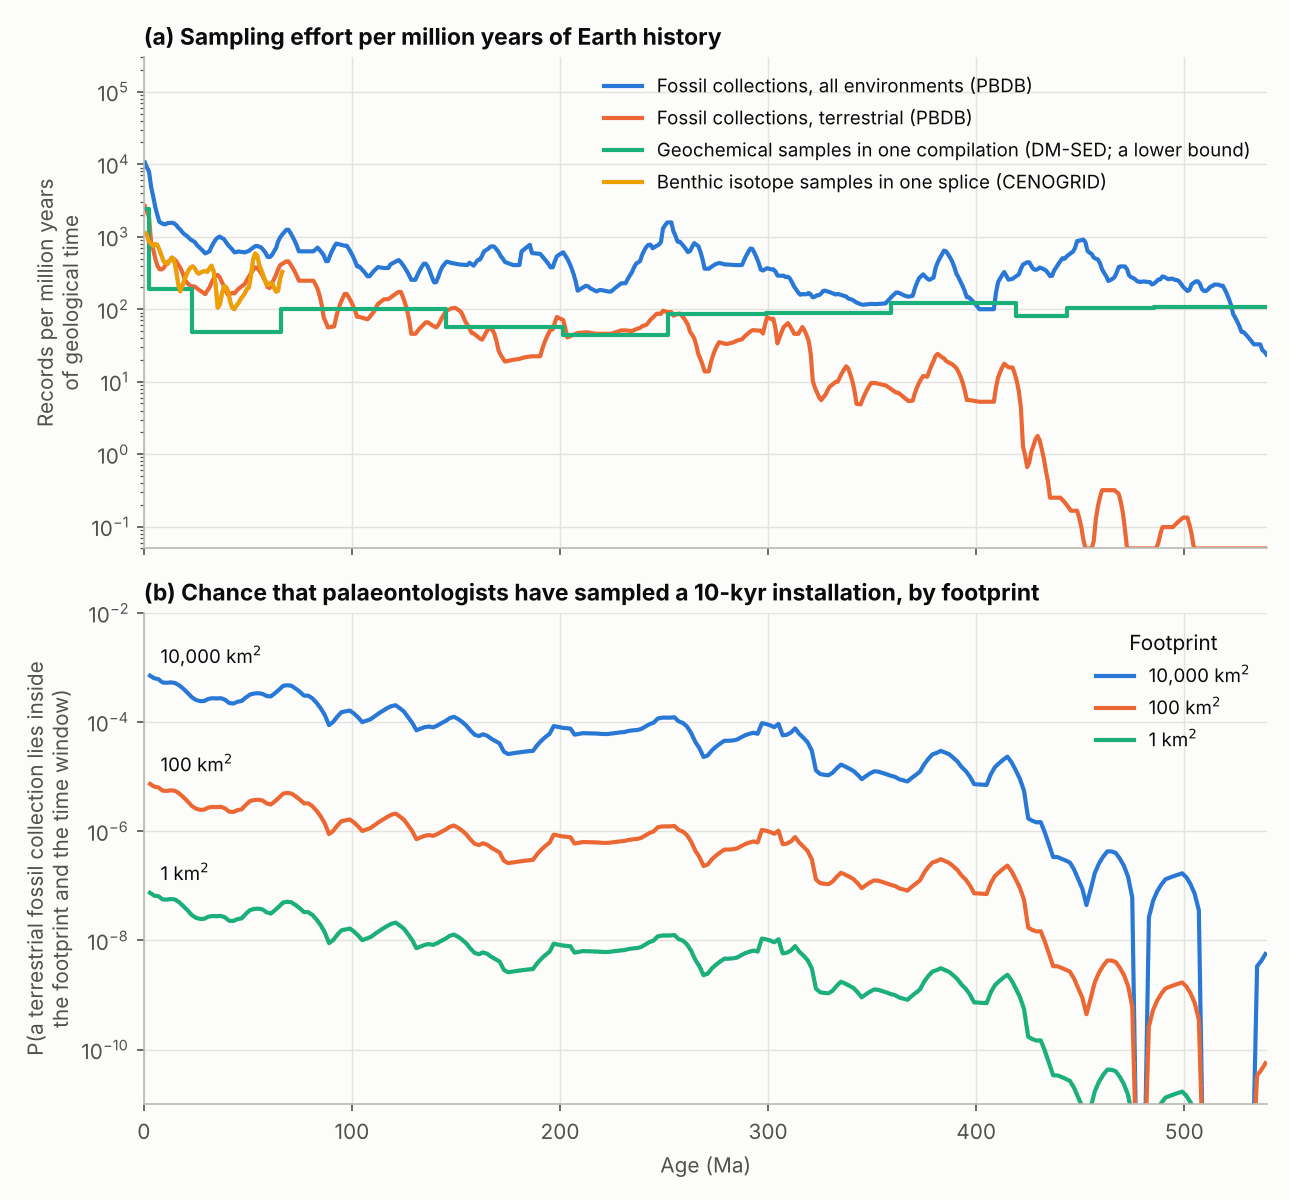
Examination. Each PBDB collection is one close inspection of a small patch of bedding of known place and age. An installation of area A occupied for a time tau counts as sampled if a terrestrial collection lies inside its footprint and the collection's age window overlaps the occupation. Collections exist only where sediment was deposited, survived and is exposed, so this one empirical number folds preservation, exposure and examination together.
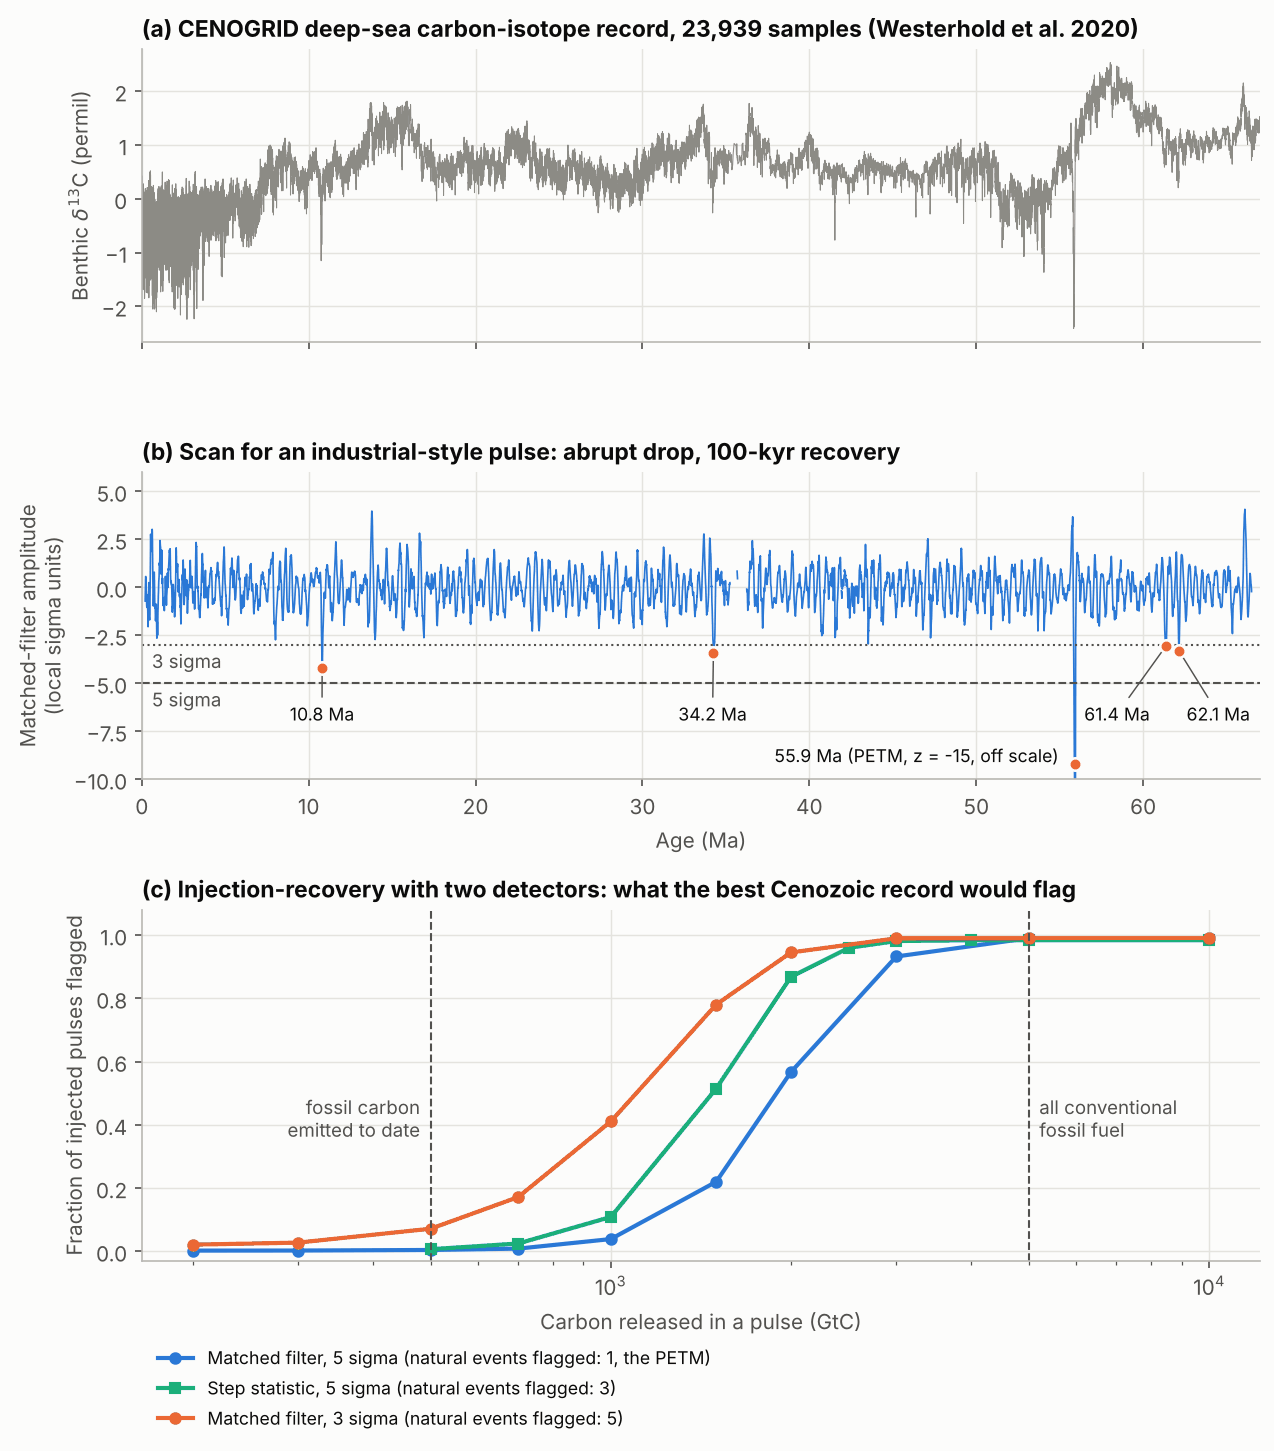
Carbon. A pulse of M GtC of fossil carbon shifts the ocean's carbon-isotope ratio by -25 x M/(M + 40,000) per mil and recovers over about 100 kyr. Synthetic pulses are injected at random ages into CENOGRID and recovered with two independent detectors: a matched filter with a local baseline (4,000 injections) and a plain step statistic (mean of the 50 kyr after onset minus the 100 kyr before; 1,500 injections). A pulse is flagged when it is a 5-sigma outlier against local natural variability.
Synthesis. A 20,000-draw Monte Carlo combines the above. P(known) for an installation is the sum of a deep-time part (PBDB probe x E x recognition) and a surface part (remains still discoverable at today's land surface). Assumptions that are not data:
| Assumption | Range |
|---|---|
| E: all inspections that would report an artefact layer, per PBDB terrestrial collection | 3-300, log-uniform |
| Probability an inspected artefact bed is recognised (also absorbs how densely artefacts fill the footprint and survive burial) | 0.1-1 |
| Time one inspected bed represents | 3-100 kyr |
| Surface part: survival time 0.03-1 Myr; found if still there 0.1-0.7 (1 km2), 0.5-1 (100 km2), 0.8-1 (10,000 km2) | no dataset |
| Carbon: pre-Cenozoic coverage (Mesozoic 0.14-0.8, Paleozoic 0.05-0.5, Precambrian 3e-4 to 1e-2) and noise 1-6 times the Paleocene level | assumed |
| Carbon: a catalogued event is attributed to industry | 0.003-0.3 |
| Size of one independently preserved patch (100 km2); global-to-North-America scaling (8) | drive the "preserved somewhere" model outputs only |
Results
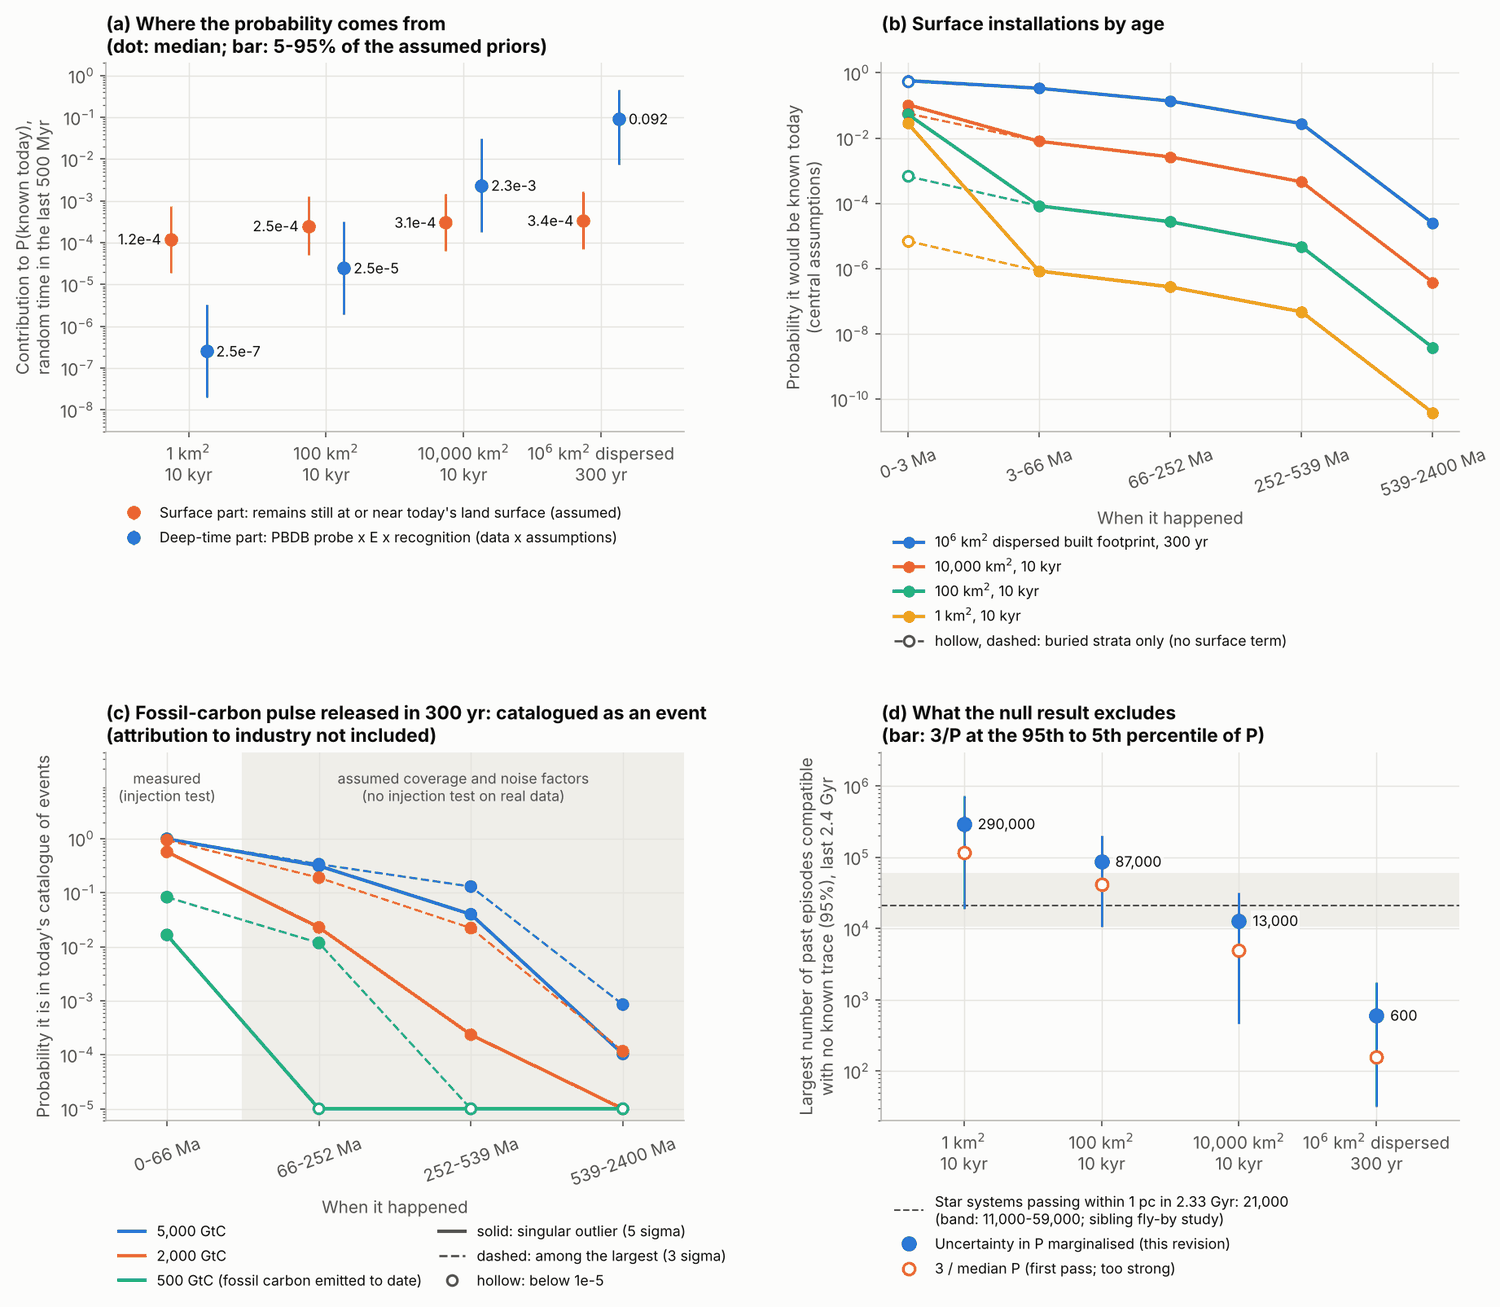
1. The deliverable. Medians with 5-95% ranges of the assumed priors.
| Scenario (random time in window) | Deep-time part, 500 Myr | Surface part, 500 Myr (assumed) | Combined, 500 Myr | Combined, 2.4 Gyr |
|---|---|---|---|---|
| 1 km2, 10 kyr | 2.5e-7 (2e-8 to 3.4e-6) | 1.2e-4 | 1.2e-4 (2e-5 to 8e-4) | 2.6e-5 |
| 100 km2, 10 kyr | 2.5e-5 (1.9e-6 to 3.3e-4) | 2.5e-4 | 3.4e-4 (7e-5 to 1.4e-3) | 7.1e-5 |
| 10,000 km2, 10 kyr | 2.3e-3 (1.8e-4 to 3.1e-2) | 3.1e-4 | 2.9e-3 (4.4e-4 to 3.1e-2) | 6.1e-4 |
| Human-scale built footprint, 1e6 km2 dispersed, 300 yr | 0.09 (0.008 to 0.46) | 3e-4 | 0.09-0.21 by variant (0.008 to 0.72) | 0.02-0.045 (0.002 to 0.15) |
| Fossil-carbon pulse 5,000 GtC: catalogued as a singular event | 0.13 measured + 0.16 assumed (0.07 to 0.31) | 0.29 (0.20 to 0.44) | 0.061 (0.042 to 0.094) | |
| Same pulse recognised as industrial (assumed attribution) | 0.009 (0.001 to 0.07) | 0.002 | ||
| Fossil-carbon pulse 500 GtC: catalogued | 0.002 | 0.0005 | ||
| 244Pu fallout at 10% or more of weapons tests (conditional) | 0.015, at most 0.05 | 0.003, at most 0.010 |
The surface part is equivalent to certain knowledge of the last 0.06 Myr (1 km2), 0.13 Myr (100 km2) and 0.15 Myr (10,000 km2), with ranges of 0.01 to 0.75 Myr. Conditional on the event lying within the last 1 Myr, P(known) is 0.06, 0.13 and 0.15. The deep-time parts over 2.4 Gyr are 5.3e-8, 5.1e-6 and 4.9e-4. At the extreme corner of the priors (E x recognition = 300, 100-kyr beds) the 500-Myr deep-time values reach only 2e-5, 2e-3 and 0.17. The 500 GtC row is almost entirely the assumption that ice cores register any pulse in the last 0.8 Myr.
2. What survives, and how finely it records time.
| 0-66 Ma | 66-252 Ma | 252-539 Ma | older, to 2,400 Ma | |
|---|---|---|---|---|
| North American area holding sediment of that age | 0.17 | 0.18 | 0.20 | 0.037 |
| Non-marine sediment only | 0.095 | 0.050 | 0.010 | 0.007 |
| Unit duration, time-weighted median / plain median (Myr) | 8 / 1.5 | 16 / 4.6 | 13 / 2.9 | 79 / 23 |
| Years per cm, time-weighted / plain median | 270 / 170 | 560 / 340 | 600 / 370 | 900 / 340 |
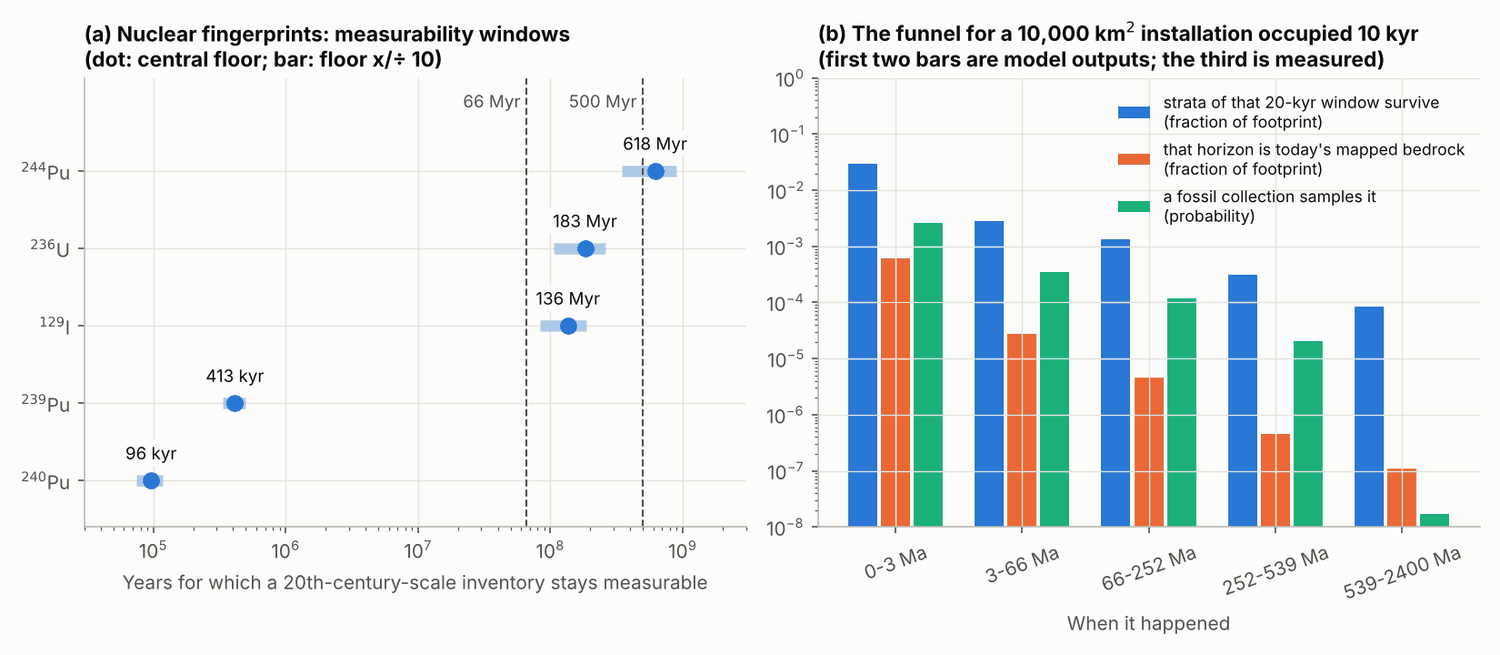
| Terrestrial fossil collections per Myr (PBDB) | 291 | 92 | 15 | 2 in total |
A typical North American column holds sediment for 18% of the last 500 Myr (16-84% of columns: 4.6-39%) and 5% of the last 2.4 Gyr, with 4,120 Phanerozoic gaps of median 12 Myr. Deep-sea sediment represents 900-3,300 years per centimetre (time-weighted; 470-1,500 plain). A 300-year episode is a centimetre or less.
3. Installations by age (10,000 km2, 10 kyr, central assumptions).
| 3-66 Ma | 66-252 Ma | 252-539 Ma | 539-2,400 Ma | |
|---|---|---|---|---|
| Terrestrial collections worldwide overlapping its time window (measured) | 5.9 | 1.8 | 0.31 | 3e-4 |
| P(a collection lies inside it): PBDB probe (measured) | 3.5e-4 | 1.2e-4 | 2.0e-5 | 2e-8 |
| P(known today) | 8e-3 | 2.6e-3 | 4.6e-4 | 4e-7 |
| P(some part preserved anywhere): model output | 0.25 | 0.12 | 0.03 | 0.008 |
For 100 km2 the first three rows are 100 times lower. The last row depends on an assumed patch size and a Sadler extrapolation over three to five decades; across reasonable choices it spans 0.015-1.0 (3-66 Ma) and 0.002-0.71 (Paleozoic). It does not enter P(known). A 1-Myr occupation of 10,000 km2 raises the 500-Myr value to 0.037 (0.004-0.30).
4. Global carbon episode (0-66 Ma, share of injected pulses flagged).
| Pulse | Recorded peak | 5 sigma, matched filter / step | 3 sigma, matched filter | Natural excursions at least as large |
|---|---|---|---|---|
| 500 GtC (fossil carbon emitted to date) | -0.25 per mil | 0.4% / 0.7% | 7% | 85 |
| 2,000 GtC | -0.97 per mil | 57% / 87% | 95% | 1 |
| 3,000 GtC | -1.4 per mil | 93% / 98% | 99% | 1 |
| 5,000 GtC (all conventional fossil fuel) | -2.3 per mil | 99% / 98% | 99% | 1 |
Half of pulses are flagged at 1,890 GtC (matched filter) or 1,480 GtC (step statistic), and 90% at 2,890 or 2,160 GtC. By epoch, a 3,000 GtC pulse is flagged 84% of the time in the Eocene and 96-100% elsewhere. The PETM (55.9 Ma) is equivalent to 8,300-9,800 GtC. The next largest excursions, at 10.8 Ma and 62.1 Ma, are equivalent to 1,400-1,700 GtC; they stay below 5 sigma with the matched filter and exceed it with the step statistic. So "the only 5-sigma event" depends on the detector; "the only event above 2,000 GtC equivalent" does not. Detectability depends on total carbon, not duration: releases over 300 and 10,000 years differ by under 5%, and 5,000 GtC spread over 1 Myr is flagged under 2% of the time. Before 66 Ma no injection test was run; the probabilities used (0.31 Mesozoic, 0.04 Paleozoic, 1e-4 Precambrian for 5,000 GtC) are assumed.
5. Fast markers. Share of 2.58-500 Ma time with at least one section sampled at a given spacing, as lower bounds:
| Spacing | DM-SED only | CENOGRID only | Combined floor |
|---|---|---|---|
| 1 kyr or finer | 0.021% | 0.36% | 0.38% |
| 10 kyr or finer | 1.0% | 11% | 12% |
| 50 kyr or finer | 17% | 13% | 28% |
Within 2.58-66 Ma, CENOGRID alone covers 2.8% of time at 1-kyr spacing and 88% at 10 kyr. A random 300-year window holds an expected 0.1 existing samples in DM-SED and 0.5 in CENOGRID. A model extrapolation puts a 300-year marine layer in roughly 2 to 20 column-sized regions worldwide at any Phanerozoic date (P of surviving somewhere 0.8-1). So a 300-year layer probably survives somewhere, is rarely sampled at the needed resolution before the Quaternary, and would be smeared over about 7 kyr by sediment mixing even where sampling is dense.
6. Nuclear fingerprints. By decay alone, a 20th-century-scale inventory stays measurable for about 0.1 Myr (240Pu), 0.4 Myr (239Pu), 140 Myr (129I), 180 Myr (236U) and 620 Myr (244Pu). The archive is the real limit. Published crust counts (141 and 6.3 atoms of 244Pu in the 1.34-4.57 and 4.57-9 Myr layers) allow a past fallout pulse of at most about 10% of the weapons-test total, if a pulse enters the crust with the uptake of 0.17 adopted for interstellar dust. That condition fails where it can be tested: the same arithmetic predicts 2,200-12,000 bomb-derived counts in the top layer, while the published residual of 34 ± 17 leaves room for at most about 255. If a past pulse were taken up no better, the limit would be 0.9-5 times the weapons-test fallout, which excludes nothing.
7. What is excluded.
- A rapid fossil-carbon release above about 2,000 GtC equivalent in the last 66 Myr, other than the PETM (completeness 57-87% at 2,000 GtC, 84-100% by epoch at 3,000 GtC).
- Conditionally, bomb-style 244Pu fallout above about 10% of the 20th-century total between 1.34 and 9 Myr ago.
- Not excluded: a 500 GtC episode at any date; any release spread over a million years; anything before 66 Ma on measured grounds; a surface installation of any size before the Quaternary.
- The PETM cannot be ruled out as industrial on isotopes alone. The published argument against is a rate argument: onset of at least 4 kyr (Zeebe et al. 2016), likely under 5 kyr (Kirtland Turner et al. 2017).
8. The Moon (preservation only). Features 10 m across are erased in 1-16 Myr, 30 m in 11-140 Myr, 100 m in 0.13-1.6 Gyr, and 300 m or more persist 1.1 to over 3.5 Gyr. On Earth the modelled chance that some part of a 10,000 km2 site is preserved is 0.008-0.25, so like-for-like preservation is roughly 4-120 times better on the Moon, with the terrestrial term itself poorly constrained. The larger difference is examination: lunar features sit at a surface that orbital imagery covers, while terrestrial remains are buried and almost entirely uninspected.
Robustness checks
- Referee reproduction: all 36 first-pass tables byte-identical on rerun; PBDB probe within 2% by a different method; Macrostrat fractions within 5%; carbon thresholds within 25%. After revision, all measured first-pass tables are still byte-identical.
- CENOGRID matched filter: varying recovery time (50-200 kyr), mixing time (3-15 kyr), threshold (4-6 sigma) and reservoir (60,000 GtC) moves the 50% mass between 1,490 and 2,780 GtC.
- PBDB probe: counting same-formation collections in a cell once lowers it by 0.31 (10,000 km2) to 0.58 (1 km2).
- E: cumulative coal mining (assumed 350 Gt, 3 m seams) has laid bare about 2 times the space-time that PBDB collections sample at 1 km2 scale; the referee's mine-count estimate gives 7 times at 10,000 km2. Both support E of order 10, not 1,000.
- Regional bias: the USA-Canada map sample has 1.28 times the global sedimentary outcrop fraction (corrected); South America's 58 columns show 0.33 against 0.20.
- Seeds are fixed; a rerun reproduces every table. PBDB and Macrostrat are living databases.
Limitations
- Only the PBDB probe is measured. E, recognition, bed time-averaging, surface survival and attribution are assumed. For 100 km2 or less, 91-99.8% of the combined value is the assumed surface term.
- A fossil collection stands in for an inspection that would reveal an installation; that requires artefacts dense across the footprint and recognisable after burial.
- Pre-Cenozoic carbon probabilities are assumed. The carbon model is a one-box mass balance, and detection is not attribution.
- Macrostrat is mostly North America; sub-Myr completeness is extrapolated.
- DM-SED and CENOGRID give lower bounds on sampling density.
- The 244Pu bound is conditional and applies only to explosive global dispersal.
- Scenarios assume durable artefacts on land; underground, marine or off-planet sites are not covered.
Closest prior work and what is new
Schmidt & Frank (2018) pose the question and conclude qualitatively that direct evidence older than about 4 Ma is unlikely. Wright (2018), Haqq-Misra & Kopparapu (2012), Davies (2012) and Haqq-Misra et al. (2022) are also qualitative. Peters & Heim (2010) already combined Macrostrat with PBDB to measure how much of the North American rock record has been sampled palaeontologically; Zalasiewicz (2008) and Zalasiewicz et al. (2014) treat the preservation of urban strata; Kemp et al. (2015) show how the record under-resolves rates. I found no work that assigns probabilities. New here: the PBDB probe expressed per installation footprint and duration; injection-recovery of industrial carbon pulses against a real record with two detectors; the split of P(known) into measured and assumed parts with marginalised exclusion counts; the conditional 244Pu bound with its modern-layer test. Confidence that this is new: medium.
Implications for the Fermi paradox
Largest number of past episodes compatible with no known trace (95%), with the uncertainty in P marginalised:
| Scenario | Last 500 Myr | Last 2.4 Gyr | P(no trace) if one per stellar passage (21,000 in 2.33 Gyr) |
|---|---|---|---|
| 1 km2, 10 kyr | 61,000 | 290,000 | 0.52 |
| 100 km2, 10 kyr | 18,000 | 87,000 | 0.28 |
| 10,000 km2, 10 kyr | 2,700 | 13,000 | 0.021 |
| Human-scale industrial episode | 60-130 | 290-600 |
One installation of 100 km2 or less per stellar passage is compatible with what we know, and the residual constraint (0.3-0.5) comes from the assumed surface term: with a visit every 110 kyr the latest would be recent. On buried strata alone the limits are 2.7 million (100 km2) and 28,000 (10,000 km2). One 10,000 km2, 10-kyr installation per passage is disfavoured at about 98% under the stated assumptions (94-99.8% across the fly-by study's 11,000-59,000 range); the 95% limit is about 60% of passages. The Fermi model should give the terrestrial null result a likelihood ratio near 1 for brief presences of 100 km2 or less at any plausible E, weak weight for 10,000 km2 installations, and an assumption-dependent 0.01-0.7 per event for planet-wide industrial episodes. The Moon's surface is the more informative archive if it has been adequately searched.
Figures
Response to referee
| Referee point | Action |
|---|---|
| DM-SED used as a census; 0.08% a grid artefact | Accepted. Exact interval union (0.021%); relabelled as lower bounds; CENOGRID floors added; "none at 100-yr spacing" and "has not been looked at" removed; mixing caveat added. My CENOGRID floor at 1 kyr is 0.36%, not 0.5%, because Quaternary samples lie outside the 2.58-500 Ma window |
| Exclusion counts ignore uncertainty in P; fly-by sentence false for 10,000 km2 | Accepted. Marginalised limits replace 3/median (reproducing the referee's values); fly-by statement rewritten by footprint size |
| Headline for 100 km2 or less is an assumption | Accepted. Surface and deep-time parts reported separately everywhere; deep-only values lead the summary |
| 244Pu bound too strong and conditional | Accepted. Bound is now about 10%, labelled conditional; modern-layer test added; crusts attributed correctly. I quote modern uptake as at most 2-12% of the model's assumption (from the published error bar), not "about 1%" |
| "Only 5-sigma event" depends on the statistic; Eocene weaker | Accepted. Second detector added; claim restated as "only event above 2,000 GtC equivalent"; completeness by epoch; 50% mass 1,500-1,900 GtC |
| Weighted medians reported as plain | Accepted. Both given |
| Moon comparison mixes preservation with P(known) | Accepted. Restated as preservation plus surface visibility; the ratio is quoted as rough because the terrestrial term is uncertain |
| Human-scale number biased low | Accepted. Per-inspection and lowland variants added; median 0.09-0.21, envelope 0.008-0.72 (a factor of 1.3-2.3 higher, not 2-3) |
| Missing assumptions; carbon mixes measured and assumed; 700 GtC includes land use | Accepted. Patch size and scaling listed and tested; "preservation is not the bottleneck" withdrawn; 5,000 GtC given as 0.13 measured + 0.16 assumed; 500 GtC used for emissions to date; recorded peak -2.3 per mil |
| Prior work | Added and verified by search: Peters & Heim 2010, Zalasiewicz 2008, Zalasiewicz et al. 2014, Davies 2012, Kemp et al. 2015, Haqq-Misra et al. 2022 |
| Ranges are prior widths | Accepted and stated throughout |
No point was rejected outright.
References
Davies 2012, Acta Astronaut. 73, 250. Fassett & Thomson 2014, JGR Planets 119, 2255. Friedlingstein et al. 2025, Earth Syst. Sci. Data 17, 965. Haqq-Misra & Kopparapu 2012, Acta Astronaut. 72, 15. Haqq-Misra et al. 2022, arXiv:2209.11685. Kemp, Eichenseer & Kiessling 2015, Nat. Commun. 6, 8890. Kirtland Turner et al. 2017, Nat. Commun. 8, 353. Lai et al. 2025, DM-SED, Zenodo 10.5281/zenodo.14771859. Peters & Heim 2010, Paleobiology 36, 61. Peters, Husson & Czaplewski 2018, Geochem. Geophys. Geosyst. 19, 1393. Schmidt & Frank 2018, Int. J. Astrobiol. 18, 142. Steier et al. 2013, Nucl. Instrum. Methods B 294, 160. Wallner et al. 2015, Nat. Commun. 6, 5956; 2021, Science 372, 742 (counts as tabulated by Wang et al. 2021, arXiv:2105.05178). Westerhold et al. 2020, Science 369, 1383. Wright 2018, Int. J. Astrobiol. 17, 96. Zalasiewicz 2008, The Earth After Us, Oxford University Press. Zalasiewicz et al. 2014, Anthropocene Review 1, 34. Zeebe et al. 2016, Nat. Geosci. 9, 325.
Key numbers
| Quantity | Value | Uncertainty | Note |
|---|---|---|---|
| PBDB space-time probe: P(a terrestrial fossil collection lies inside the footprint and a 20-kyr window), averaged over 3-500 Ma | 1.05e-8 (1 km2), 1.05e-6 (100 km2), 1.0e-4 (10,000 km2) | referee reproduced to 2% from a fresh download with a different method; 0.3-0.6 times these if same-formation collections count once | The only directly measured quantity in the installation chain. 47,525 terrestrial of 278,411 collections. |
| P(known today), installation occupied 10 kyr, deep-time part (buried strata: PBDB probe x E x p_recognise), random time in last 500 Myr | 2.5e-7 (1 km2); 2.5e-5 (100 km2); 2.3e-3 (10,000 km2) | 5-95% of assumed priors: 2e-8 to 3.4e-6; 1.9e-6 to 3.3e-4; 1.8e-4 to 3.1e-2 | Last 2.4 Gyr: 5.3e-8, 5.1e-6, 4.9e-4. Extreme corner of the priors (E x p_recognise = 300, 100-kyr beds): 2e-5, 2e-3, 0.17. |
| Surface part (assumed): remains still discoverable at or near today's land surface | equivalent to certain knowledge of the last 0.06 Myr (1 km2), 0.13 Myr (100 km2), 0.15 Myr (10,000 km2) | 5-95%: 0.01-0.38, 0.03-0.64, 0.03-0.75 Myr | No dataset behind it. P(known | within the last 1 Myr) = 0.06, 0.13, 0.15. Contributes 1.2e-4, 2.5e-4, 3.1e-4 to the 500-Myr values. |
| P(known today), combined (surface + deep), installation 10 kyr, last 500 Myr | 1.2e-4 (1 km2); 3.4e-4 (100 km2); 2.9e-3 (10,000 km2) | 5-95%: 2e-5 to 8e-4; 7e-5 to 1.4e-3; 4.4e-4 to 3.1e-2 | Unchanged from the first pass, but 99.8% (1 km2) and 91% (100 km2) of it is the assumed surface term. Last 2.4 Gyr: 2.6e-5, 7.1e-5, 6.1e-4. |
| P(known today), dispersed human-scale built footprint (1e6 km2, 300 yr), last 500 Myr | 0.09 baseline; 0.12-0.21 in modelling variants | envelope of 5-95% ranges: 0.008-0.72 | Variants: recognition per inspection, lowland concentration x1-5, both. Last 2.4 Gyr: 0.019 baseline, up to 0.045; envelope 0.002-0.15. By era (baseline, central): 0.34 (3-66 Ma), 0.14 (Mesozoic), 0.03 (Paleozoic), 2.5e-5 (older). |
| 95% upper limit on the number of past episodes given no known trace, uncertainty in P marginalised, last 2.4 Gyr | 290,000 (1 km2); 87,000 (100 km2); 13,000 (10,000 km2); 600 (human-scale, 290-600 across variants) | 3/P at the 95th to 5th percentile of P: 19,000-730,000; 11,000-200,000; 460-32,000; 31-1,800 | Last 500 Myr: 61,000; 18,000; 2,700; 130. First-pass 3/median values were 2-4 times too strong. Using the deep-time part only: 2.6e8, 2.7e6, 28,000, 640. |
| P(no known trace | one 10-kyr installation per stellar passage within 1 pc; 21,000 passages in 2.33 Gyr) | 0.52 (1 km2); 0.28 (100 km2); 0.021 (10,000 km2) | for 11,000-59,000 passages: 0.67-0.29; 0.44-0.09; 0.06-0.002 | The 1 and 100 km2 values come from the assumed surface term (a visit every 110 kyr leaves a recent one); with buried strata only they would be about 1. For 10,000 km2 the 95% limit is 60% of passages. |
| Carbon pulse flagged in CENOGRID at 5 sigma: mass for 50% / 90% detection | 1,890 / 2,890 GtC (matched filter); 1,480 / 2,160 GtC (step statistic) | matched-filter robustness range for the 50% mass: 1,490-2,780 GtC | 3,000 GtC flagged 93% overall: 84% Eocene, 96-100% other epochs (98% with the step statistic). |
| Fraction of injected 500 GtC pulses (fossil carbon emitted to date) flagged in CENOGRID | 0.4% (matched filter) to 0.7% (step) at 5 sigma; 7% to 16% at 3 sigma | 85 natural excursions in 66 Myr are at least as large. Recorded peak after sediment mixing: -0.25 per mil. For 700 GtC (fossil + land use, an upper bound): 0.9-2.5% and 17-35%. | |
| Largest natural Cenozoic carbon-isotope excursions, as equivalent fossil-carbon pulses | PETM 8,300-9,800 GtC; next largest 1,400-1,700 GtC (10.8 Ma and 62.1 Ma) | The PETM is the only event above 2,000 GtC equivalent under both detectors. Only the PETM reaches 5 sigma with the matched filter; three events do with the step statistic. | |
| P(5,000 GtC fossil-carbon pulse is catalogued as a singular event), last 500 Myr | 0.29 = 0.13 measured (Cenozoic injection test) + 0.16 assumed (pre-Cenozoic) | assumed part 0.07-0.31; total 0.20-0.44 | Last 2.4 Gyr: 0.061 = 0.027 measured + 0.034 (0.014-0.067) assumed. Recognised as industrial (assumed attribution 0.003-0.3): 0.009 (0.001-0.07) and 0.002. |
| Floor on the share of 2.58-500 Ma time with at least one geochemically sampled section at <=1 kyr / <=10 kyr / <=50 kyr spacing | 0.38% / 12% / 28% (DM-SED and CENOGRID combined) | DM-SED alone: 0.021% / 1.0% / 17% (exact interval union; the first-pass 0.08% was a grid artefact). CENOGRID alone: 0.36% / 11% / 13%. Lower bounds from two compilations, not a census. | |
| Global 244Pu fallout pulse allowed by deep-sea crust counts, 1.34-9 Myr ago | at most about 10% of 20th-century weapons-test fallout, conditional on crust uptake of 0.17 for a pulse | 2.6% if the tabulated flux is read as a flux in space; 3-4% from the 4.57-9 Myr layer alone | The same arithmetic predicts 2,200-12,000 bomb counts in the top layer, against at most about 255 compatible with the published 34 +- 17 residual. If a past pulse were taken up no better than that, the limit is 0.9-5 times the weapons-test fallout, which is no exclusion. |
| North American area still holding sedimentary rock of a given age | 0.20 (mean, last 500 Myr); 0.037 (500-2400 Ma) | Non-marine only: 0.095 (0-66 Ma), 0.050 (Mesozoic), 0.010 (Paleozoic), 0.007 (older). Macrostrat, 949 columns; referee reproduced. | |
| Share of time represented by sediment in a typical North American column | 18% of the last 500 Myr; 5% of the last 2.4 Gyr | 16-84% of columns: 4.6-39% (500 Myr) | 4,120 Phanerozoic hiatuses, median 12 Myr, on a 1-Myr grid. |
| Time resolution of surviving sediment (unit duration / thickness) | time-weighted medians 250-1,000 yr/cm (continental), 900-3,300 (deep sea); plain medians of units 170-370 and 470-1,500 yr/cm | Unit duration: time-weighted median 8-16 Myr by era, plain median 1.5-4.6 Myr (3.1 Myr over all 20,593 units). | |
| Modelled P(some part of a 10,000 km2, 10-kyr site is preserved anywhere) | 0.25 (3-66 Ma), 0.12 (Mesozoic), 0.03 (Paleozoic), 0.008 (539-2400 Ma) | 0.015-1.0, 0.007-0.99, 0.002-0.71, 0.0004-0.32 across patch size 10-1,000 km2, Sadler exponent 0.38-0.6 and unit-duration convention | Model output, not a measurement. Does not enter P(known), which uses the PBDB probe. |
| Lunar surface feature lifetime | 10 m: 1-16 Myr; 30 m: 11-140 Myr; 100 m: 0.13-1.6 Gyr; 300 m and larger: 1.1 to over 3.5 Gyr | Two scalings of Fassett & Thomson 2014. Like-for-like preservation is roughly 4-120 times better than the terrestrial baseline; the larger difference is that the lunar surface is visible from orbit. |
Changes made after the referee report
- Installations: every probability is now split into an assumed surface part and a data-based deep-time part (PBDB probe x E x p_recognise). Deep-only 500-Myr medians of 2.5e-7, 2.5e-5 and 2.3e-3 are reported beside the combined values, with the surface term's equivalent look-back time (0.06-0.15 Myr) and P(known | last 1 Myr). The headline no longer presents the 1 and 100 km2 combined values as results.
- Exclusion counts: replaced 3/median with limits marginalised over the 20,000 draws (new data/synthesis_exclusion.csv). 2.4 Gyr: 290,000 / 87,000 / 13,000 / 600 instead of 117,000 / 42,000 / 5,000 / 160. Added P(no known trace | one installation per stellar passage) for the fly-by study's counts and rewrote the fly-by statement by footprint size.
- DM-SED: coverage() now uses an exact interval union (0.021% at <=1 kyr, not 0.075%). All DM-SED figures are relabelled as lower bounds from one compilation. Added CENOGRID's own spacing coverage and a combined floor (0.38% / 12% / 28% of 2.58-500 Ma at <=1 / <=10 / <=50 kyr). Removed 'none at 100-yr spacing' and 'has not been looked at'; added that sediment mixing smears a 300-yr layer even where sampling is dense.
- Carbon: added a second, independent detector (step statistic) to the injection-recovery. The claim is now 'the PETM is the only excursion above 2,000 GtC equivalent; the next largest are 1,400-1,700 GtC and reach 5 sigma under the step statistic'. The 50% mass is quoted as 1,500-1,900 GtC and the 3,000 GtC completeness by epoch (Eocene 84%).
- Carbon: emissions to date now use 500 GtC of fossil carbon (Global Carbon Budget 2024: 490 +- 25 GtC), with 700 GtC kept as an upper bound. Recorded peaks are quoted after sediment mixing (-2.3 per mil for 5,000 GtC). The 5,000 GtC probability is reported as 0.13 measured plus 0.16 (0.07-0.31) assumed.
- 244Pu: the bound now treats the observed counts as the whole signal (counts + 2 sigma), giving about 10% of weapons-test fallout for 1.34-9 Myr instead of 3%. It is labelled conditional on the uptake assumption, a modern-layer test is added, and the two crusts are attributed correctly.
- Human-scale footprint: added variants with recognition applied per inspection and with a lowland-concentration factor (data/synthesis_human_scale_variants.csv). The value is quoted as 0.09-0.21 with an envelope of 0.008-0.72.
- Macrostrat: unit durations and yr/cm are labelled time-weighted and plain medians are reported beside them (1.5-4.6 Myr; 170-370 yr/cm). Figure 1 shows both.
- Funnel and fast markers: A_PATCH and SCALE_UP are listed as assumptions, outputs that depend on them are labelled as model outputs, and a sensitivity table (data/synthesis_funnel_sensitivity.csv) shows that modelled preservation spans one to two orders of magnitude. 'Preservation is not the bottleneck' is withdrawn as a finding.
- Moon: the comparison is restated as preservation (roughly 4-120 times better than the terrestrial baseline) plus surface visibility, not 'three to four orders'.
- Prior work: added Peters & Heim 2010, Zalasiewicz 2008, Zalasiewicz et al. 2014, Davies 2012, Kemp et al. 2015 and Haqq-Misra et al. 2022, each checked by search before citing; Kirtland Turner et al. 2017 '<5 kyr' confirmed.
- Figures: fig3 shows both detectors and fixes label collisions; fig4 is now four panels (surface/deep split, by era, carbon with measured and assumed regions marked, marginalised exclusion counts against stellar passages); fig1 and fig2 show plain medians and the CENOGRID sampling density; fig5b marks model outputs.
- Wording: ranges are described as widths of assumed priors, and the deliverable as order-of-magnitude conditional estimates.
Referee points not accepted
- No referee point was rejected outright. Four numbers the referee proposed were replaced by values from my own rerun, without changing the referee's conclusions.
- CENOGRID floor at <=1 kyr: the referee gave 'at least 0.5% of 2.58-500 Ma'. That counts Quaternary samples, which lie outside the window. Restricted to 2.58-66 Ma the floor is 0.36% (0.38% combined with DM-SED). The <=10 kyr floor (11-12%) agrees.
- 244Pu modern-layer discrepancy: the referee wrote that modern incorporation is 'at most about 1%' of the model's assumption. The published error bar (34 +- 17) only bounds the subtracted anthropogenic count at about 255, which is 2-12% of the predicted 2,200-12,000. I quote that weaker statement; the actual anthropogenic count was not available. The conclusion (the exclusion is conditional) is unchanged.
- Human-scale range: the referee offered 'either add variants or quote 0.01-0.5, probably low by a factor of 2-3'. I added the variants. They raise the median by a factor of 1.3-2.3 (to 0.12-0.21), and the envelope is 0.008-0.72, so the upper end is higher than the referee's 0.5.
- Space-time coverage: the referee's '1.3e-6 x E per 100 km2 by 20-kyr cell' includes the Quaternary. Averaged over 3-500 Ma, the window the deep-time statement refers to, it is 1.05e-6 x E.
- Moon ratio: I accept the reframing, but the '1-2 orders' preservation ratio rests on the modelled terrestrial preservation term, which my new sensitivity table shows is itself uncertain by one to two orders. It is quoted as rough.
Code
Every number above is produced by these scripts from public data. The data tables themselves are not hosted here; the scripts download them.
common.py run_all.py s00_fetch.py s01_macrostrat.py s02_mapsample.py s03_pbdb.py s04_cenogrid.py s05_dmsed.py s06_signals.py s07_synthesis.py s08_figures.py
Referee report
A second, separate analysis re-ran the code, recomputed the main numbers by its own route and tried to break the result. Like the first, it was run by Claude for this project; it is not an outside expert. In its report “the analyst” is the first analysis, which wrote the paper, and file names that are not linked on this page are its own working files. The paper above is the version revised in response.
Verdict: sound with fixes. Results reproduced: yes.
RERUN. I copied code/ to a separate working folder and ran
run_all.py --no-fetch s01..s07 on the cached raw files (113
s). All 36 CSV/JSON outputs are byte-identical to the analyst's data/
directory. I did not repeat the cold download.
INDEPENDENT RECOMPUTES:
- PBDB probe (chk_pbdb.py). Fresh PBDB API download using PBDB's own
envtype=terrestrialfilter instead of the analyst's 36-class list, and a random-disc Monte Carlo on the sphere instead of a fixed grid. P(collection inside a 10,000 km2 footprint and 20-kyr window):
| Period | Referee | Analyst |
|---|---|---|
| Paleogene | 2.76e-4 | 2.75e-4 |
| Cretaceous | 1.82e-4 | 1.85e-4 |
| Permian | 5.90e-5 | 5.86e-5 |
The probe is in effect N_collections/Myr x (tau+h) x A/A_land; clustering changes it by about 10%.
- Macrostrat (chk_macro.py), my own parser and interval-union code:
| Quantity | Referee | Analyst |
|---|---|---|
| North American sediment area fraction, 0-500 Ma | 0.197 | 0.197 |
| Non-marine fraction, 0-66 / 66-252 / 252-500 Ma | 0.091 / 0.050 / 0.012 | 0.095 / 0.050 / 0.010 |
| Per-column time with sediment, last 500 Myr (median; 16-84%) | 18.0%; 4.5-38.6% | 18.2%; 4.6-38.7% |
| 500-2400 Ma area fraction | 0.0367 | 0.0367 |
- CENOGRID (inj_ceno.py). A deliberately different detector: step statistic (mean of the 50 kyr after onset minus the 100 kyr before), no template fit, 1,500 injections.
| Quantity | Referee | Analyst |
|---|---|---|
| 50% detection mass at 5 sigma | 1,470 GtC | 1,890 GtC (own robustness range 1,490-2,780) |
| 700 GtC flagged at 5 sigma | 2.4% | 0.85% |
| 700 GtC flagged at 3 sigma | 33% | 17% |
| 3,000 GtC or more flagged | 98.5% | 93-99% |
| PETM | z = -20.9, raw benthic step about -3.0 per mil | z = -14.7 |
The carbon thresholds are confirmed to about 25%. The PETM is by far the largest event in both.
Monte Carlo (marg.py). I rebuilt the 20,000-draw synthesis from the same seed and reproduced all installation medians and ranges exactly. The same draws give the surface/deep split and the marginalised exclusion numbers used in the errors below.
E factor, back-of-envelope. About 10^4 coal mines, each cutting roughly 0.5 Myr of terrestrial strata, give a probe of about 7e-4 for a 10,000 km2 site over 500 Myr. That is roughly 7 times the PBDB probe, consistent with the assumed E of order 10-30.
CITATIONS CHECKED. Wang et al. 2021 (arXiv:2105.05178) Table 2: Crust-3 layers 0-1.34 / 1.34-4.57 / 4.57-9.0 Myr, counts 34±17 / 141±19 / 6.3, fluxes 930 / 1990 / 270, uptake 0.17. All match the code. Zeebe et al. 2016 (at least 4,000 yr, under 1.1 PgC/yr) confirmed. Steier et al. 2013 ratio (5.7±1.0)e-5 confirmed, and the 7.94e-5 Baltic value exists. Kirtland Turner et al. 2017 is Nat. Commun. 8, 353; the '<5 kyr' wording could not be read from the truncated abstract (it matches my memory of the paper). Fassett & Thomson's 5.5 m2/Myr is supported by later Fassett abstracts. The CENOGRID file header confirms PANGAEA 917660 and Westerhold et al. 2020.
Strongest objection
A stratigrapher would say the study measures one thing well and then multiplies it by guesses. The measured quantity is the share of ancient land-surface space-time that sits inside a PBDB terrestrial fossil collection: about 1e-4 for a 10,000 km2 by 20-kyr cell averaged over 3-500 Ma. I reproduced that from a fresh download by a different method to within 2%. Everything between that number and 'P(known today)' is unmeasured: the ratio of all rock inspections to PBDB collections (E, 3-300), the chance an artefact bed is recognised (0.1-1), the time one bed represents (3-100 kyr), and, for sites of 100 km2 or less, an assumed Quaternary survival term that supplies 91-99.8% of the headline value. Treating a fossil collection as an inspection that would reveal an installation also assumes artefacts are dense across the whole footprint and survive burial alteration in recognisable form. The quoted 5-95% ranges are widths of assumed priors, not confidence intervals.
Does the conclusion survive? In its qualitative form, yes. Space-time coverage is 1.3e-6 x E for 100 km2 by 20-kyr cells, so no defensible E brings it near 1. Even at the extreme corner of the analyst's priors (E x p_recognise = 300, h = 100 kyr), the 500-Myr deep-time probability is at most about 2e-3 for 100 km2 and about 0.17 for 10,000 km2. An independent mining-based estimate puts E at order 10. 'Near-silent on brief, local presences' is therefore robust.
The specific central values do not survive as defensible numbers. The 1 km2 and 100 km2 values are restatements of the surface-survival assumption. The human-scale 0.09 could lie anywhere from about 0.01 to 0.5 and is probably biased low. The pre-Cenozoic carbon probabilities are assumed. They should go into the Fermi model as order-of-magnitude conditional estimates with the surface and deep-time parts separated, and the exclusion counts must be marginalised.
Errors found
- major. DM-SED is used as if it were a census of
geochemical sampling. The key number 'share of 2.58-500 Ma time with a
geochemically sampled section at <=1 kyr / <=50 kyr spacing: 0.08%
/ 17%', and the Results section 4 statements ('none at 100-yr spacing',
'the layer exists and has not been looked at'), describe that one
shale-geochemistry compilation, not the state of sampling. The 0.08% is
also a numerical artefact of a 4,000-point coverage grid.
- Evidence: DM-SED holds zero carbonate d13C values in 2.58-66 Ma and gives 0.0 coverage there at <=10 kyr for d13C. The analyst's own CENOGRID file covers 3.8% of the Cenozoic at <=1 kyr spacing, 89% at <=10 kyr and 99% at <=50 kyr. CENOGRID alone therefore gives at least 0.5% of 2.58-500 Ma at <=1 kyr and at least 12% at <=10 kyr (DM-SED: 1%). 799 of 1,875 DM-SED sites with 5+ samples carry a single age and are dropped, which removes exactly the densely sampled sections. Exact interval union for <=1 kyr within DM-SED is 0.021%, not 0.075% (referee/work/chk_dmsed.py, chk_ceno.py).
- Fix: Relabel the row as 'within DM-SED v0.0.1 (lower bound; excludes ocean-drilling isotope and core-scanning data)'. Add the CENOGRID-based floors. Replace the grid in s05 coverage() with an exact interval union. Reword section 4 to: a 300-yr layer is rarely sampled at the needed resolution before the Quaternary, and sediment mixing over about 7 kyr would smear it even where sampling is dense. Drop 'none at 100-yr spacing' and 'has not been looked at'.
- major. The 'excluded number' limits (3 / median
P_known) ignore the study's own factor-70 uncertainty in P_known and are
2-4 times too strong. The Implications sentence that an
installation-scale visit on 'even a large fraction' of the 21,000
stellar passages is compatible with what we know is false for 10,000 km2
installations by the study's own numbers.
- Evidence: Marginalising over the 20,000 Monte Carlo draws (solve E[exp(-N p)] = 0.05; referee/work/marg.py): last 500 Myr 18,200 / 2,700 / 126 instead of 9,000 / 1,000 / 30; last 2.4 Gyr 87,000 / 12,900 / 600 instead of 40,000 / 5,000 / 160. For 21,000 visits in 2.4 Gyr, P(no known trace) is 0.53 (1 km2), 0.28 (100 km2) and 0.02 (10,000 km2, expected detections 12.7 at median p).
- Fix: Replace the 3/median table with the marginalised values, or quote 3/p95 to 3/p05 as a range. Rewrite the fly-by sentence: one installation of 100 km2 or less per passage is compatible with the null result (P about 0.3-0.5); one 10,000 km2, 10-kyr installation per passage is excluded at about 98% under the stated assumptions, and roughly 13,000 such visits are the 95% limit.
- major. For installations of 100 km2 or less, the
headline P(known) is an assumption, not a measurement. It equals
p_surface x t_surface / window. The data-based deep-time component is
orders of magnitude smaller and is not reported separately in the
headline or summary table.
- Evidence: Deep-only medians from the same Monte Carlo draws: 1 km2, 2.5e-7 (500 Myr) against the headline 1.2e-4; 100 km2, 2.5e-5 against 3.4e-4; 10,000 km2, 2.3e-3 against 2.9e-3. The surface term is U(0.1-0.7) x log-uniform(0.03-1 Myr) / T, with no dataset behind either factor.
- Fix: Split every installation row into (a) P(known | occurred in roughly the last 1 Myr), labelled as assumed, and (b) P(known | older), which is the PBDB probe x E x p_recognise. Give the Fermi model both. State in the headline that the 1 km2 and 100 km2 values mean 'we would probably know only if it happened in the last ~0.2 Myr'.
- minor. The 244Pu exclusion treats the observed
counts as a known background (limit = 3 sigma of the count error). The
141 counts in the 1.34-4.57 Myr layer are themselves the unexplained
excess, so a technogenic spike is bounded by the whole signal. The
transfer assumption (a fallout pulse enters the crust with the
interstellar uptake of 0.17) is also contradicted for the one case where
it can be tested.
- Evidence: Layer B bound: (141 + 2x19)/141 / 12.3 is about 10% of weapons-test fallout in the conservative convention (2.6% in the flux-in-space convention), not 'about 3%'. Layer C gives about 3.5%. The analyst's own arithmetic predicts 2,200-12,000 counts of bomb 244Pu in the top layer (0-1.34 Myr). The published interstellar residual there is 34±17 after subtracting the anthropogenic part, which is impossible against a background that large. Actual modern incorporation is therefore at most about 1% of the model's assumption, presumably because only about 60 years have elapsed. The 25-Myr extension uses a different crust (Wallner 2015), so 'one Pacific crust' is inaccurate.
- Fix: State the limit as 10% of weapons-test fallout or less for 1.34-9 Myr, conditional on a past pulse eventually being scavenged into open-ocean crusts at the interstellar uptake efficiency. Drop the 3% figure. Change 'firm exclusion' to 'conditional exclusion'. Note the modern-layer discrepancy and that Pu is scavenged preferentially at ocean margins. Correct the crust attribution.
- minor. 'The PETM is the only 5-sigma event' depends
on the detection statistic. The quoted 93-99% completeness for 3,000 GtC
or more hides a weaker Eocene.
- Evidence: The referee's step statistic at 5 sigma also flags 10.80 Ma (a real excursion in ODP Site 1146, -0.74 per mil) and 62.14 Ma (the Latest Danian Event). Both are in the analyst's 3-sigma list with equivalent masses of about 1,550 and 1,420 GtC. The analyst's own cenogrid_recovery.csv gives P_flag(3,000 GtC) = 0.836 in the Eocene.
- Fix: State the robust version: the PETM is the only excursion with an equivalent pulse above 2,000 GtC, and the next largest are about 1,400-1,550 GtC. Quote the 3,000 GtC completeness as 84% (Eocene) to 97-100% (other epochs), 93% overall. Give the 50% mass as about 1,500-1,900 GtC depending on method.
- minor. Weighted statistics are reported as plain
medians.
- Evidence: 'Median duration of one mapped unit 9-18 Myr' is an overlap-time-weighted median. The unweighted median of the 20,593 North American sedimentary units is 3.1 Myr. The yr/cm medians of 250-1,000 are likewise time-weighted; unweighted medians are 170-370 yr/cm (referee/work/chk_macro.py).
- Fix: Label both as time-weighted and give the unweighted values alongside.
- minor. The Moon-versus-Earth comparison ('three to
four orders of magnitude better') sets lunar preservation (about 1)
against terrestrial P(known) (3e-3), which includes examination.
- Evidence: The study's own funnel gives terrestrial preservation of 0.25 / 0.12 / 0.03 / 0.008 for a 10,000 km2 site, a like-for-like preservation ratio of 4 to about 120. Section 7 uses 3e-3, which is P(known).
- Fix: Rephrase: lunar features of 100 m or more survive at the surface, where orbital imagery can see them, for 0.1 to over 3 Gyr. On Earth 1-25% of large sites leave buried remains, of which a tiny fraction has been examined. Give the preservation ratio (1-2 orders) and the examined-fraction difference separately.
- minor. Two modelling choices bias the human-scale
number (0.09) low and are not stated. p_recognise is applied once
globally, not per inspection. Placement is uniform on land, although
cities and preserved terrestrial sediment both concentrate in
depositional lowlands.
- Evidence: The central 0-3 Ma value for a 1e6 km2 footprint is 0.58 even though about 10 inspections are expected to hit it, because of the cap at p_recognise = 0.55. Per-inspection recognition would give about 1. In 3-66 Ma it would give 0.43 instead of 0.35. A lowland concentration of 2-5 times would raise the 500-Myr value towards 0.2-0.3.
- Fix: State both choices. Either add a per-inspection variant and a lowland-concentration factor, or widen the quoted range for the human-scale episode to about 0.01-0.5 with a note that the central value is likely low by a factor of 2-3.
- minor. Assumptions used in the funnel and
fast-marker results are missing from the report's assumptions table. The
carbon headline mixes measured and assumed parts. The 700 GtC case
includes land-use carbon.
- Evidence: A_PATCH = 100 km2 and SCALE_UP = 8 are set in s07 and drive 'a quarter of Cenozoic cases leave something' and '13-22 regions'. Of the 0.29 for 5,000 GtC, 0.13 is Cenozoic (measured) and about 0.16 comes from assumed pre-Cenozoic coverage and noise factors. About 220 of the 700 GtC is land-use carbon, which is already inside the 40,000 GtC exchangeable pool and does not shift its isotope ratio; the fossil part is about 490 GtC (-0.31 per mil). The report's 'peak shift -2.8 per mil' for 5,000 GtC is before mixing; the template peak is 0.82 of that.
- Fix: Add A_PATCH and SCALE_UP to the assumptions table. Report the 5,000 GtC value as 0.13 measured plus about 0.07-0.3 assumed. Use about 500 GtC for the isotope effect of emissions to date; this strengthens 'not flagged'. Quote the recorded peak as -2.3 per mil.
Overclaims
- Headline: 'the probability that it is known today is about 1e-4 for 1 km2, 3e-4 for 100 km2' reads as a result. It is p_surface x t_surface / 500 Myr, both assumed; the data-based deep-time values are 2.5e-7 and 2.5e-5.
- '5-95% range roughly a factor of 10 either way' and 'honest order-of-magnitude uncertainty': the ranges are widths of assumed priors whose bounds are themselves guesses.
- Key number 'Share of 2.58-500 Ma time with at least one geochemically sampled marine section at <=1 kyr / <=50 kyr spacing: 0.08% / 17%' and 'The layer exists and has not been looked at': true only inside DM-SED; contradicted by the study's own CENOGRID data.
- 'Excludes at 95% more than ~9,000 / ~1,000 / ~30 (500 Myr) and ~40,000 / ~5,000 / ~160 (2.4 Gyr)': too strong by 2-4 times once the uncertainty in P is marginalised (18,000 / 2,700 / 126 and 87,000 / 13,000 / 600).
- 'A visit of installation scale on even a large fraction of those passages would be compatible with what we know': false for 10,000 km2 installations under the study's own numbers (P(no trace) about 2% for one per passage).
- 'Firm exclusions ... no bomb-style 244Pu fallout in the last 9 Myr' and '>= ~3% of weapons-test fallout': the exclusion is conditional on an untested uptake assumption that fails for the modern layer of the same crust; the defensible bound is about 10%.
- 'The only natural 5-sigma event is the PETM': depends on the statistic; an equally reasonable detector flags three. The robust claim is 'the only event above about 2,000 GtC equivalent'.
- 'Anything of 3,000 GtC or more in the last 66 Myr is flagged 93-99% of the time': 84% in the Eocene, a third of the interval.
- 'The Moon retains large structures three to four orders of magnitude better than Earth': compares lunar preservation with terrestrial P(known); like-for-like preservation differs by 1-2 orders.
- 'P(5,000 GtC pulse catalogued) = 0.29 (0.20-0.44)' and the era values 0.31 Mesozoic / 0.04 Paleozoic: more than half of the 0.29 and all of its range come from assumed coverage and noise factors, not from an injection test.
- 'Preservation is not the bottleneck: a quarter of Cenozoic cases leave something in the ground': a model output resting on an assumed 100 km2 patch size and a Sadler extrapolation over 3-5 decades in time span, not a measurement.
Novelty check
Novel: partly. Three searches (two extended) found no published work that assigns probabilities to the Silurian question. Schmidt & Frank 2018 and later reviews (the 2022 decadal white paper arXiv:2209.11685, a recent technosignature review) stay qualitative and repeat the 'older than about 4 Ma, small chance' judgement. The PBDB space-time probe and the CENOGRID injection-recovery test appear to be new as applied to this question, and I reproduced both independently. The ingredients are standard, and the combined p(known) values are assumption-driven rather than measured. The analyst's 'medium' confidence is fair. Prior work that should be added: Peters & Heim 2010 (Paleobiology 36, 61), which already combines Macrostrat with PBDB to measure how much of the rock record palaeontologists have sampled; Zalasiewicz et al. 2014 ('The technofossil record of humans') and Zalasiewicz 2008 ('The Earth After Us') on the preservation potential of urban strata; Davies 2012 (Acta Astronautica 73, 250) on terrestrial traces of alien technology; Kemp et al. 2015 on resolving rates in the record. These four are cited from memory and were not re-verified by search today.
- Schmidt & Frank 2018/2019, Int. J. Astrobiol. 18, 142 (qualitative; no probabilities)
- Wright 2018, Int. J. Astrobiol. 17, 96; Haqq-Misra & Kopparapu 2012, Acta Astronaut. 72, 15 (qualitative)
- Haqq-Misra et al. 2022, arXiv:2209.11685 (decadal white paper; treats the hypothesis as testable, no numbers)
- Peters & Heim 2010, Paleobiology 36, 61 (Macrostrat x PBDB sampling completeness; from memory)
- Zalasiewicz et al. 2014, Anthropocene Review 1, 34; Zalasiewicz 2008, The Earth After Us (technofossil preservation; from memory)
- Davies 2012, Acta Astronaut. 73, 250 (from memory)
- Zeebe et al. 2016, Nat. Geosci. 9, 325; Kirtland Turner et al. 2017, Nat. Commun. 8, 353 (PETM onset rate)
- Wallner et al. 2015, 2021 and Wang et al. 2021, arXiv:2105.05178 (deep-sea 244Pu)
Required changes
- Headline and summary table: split each installation row into 'if within roughly the last 1 Myr (assumed surface survival)' and 'if older (PBDB probe x E x p_recognise)'. Report the deep-only 500-Myr medians of 2.5e-7 (1 km2), 2.5e-5 (100 km2) and 2.3e-3 (10,000 km2) beside the combined values, and say in the first sentence that the 1 km2 and 100 km2 values are set by the surface assumption.
- Implications table: replace 3/median with marginalised 95% limits (500 Myr: about 18,000 / 2,700 / 126; 2.4 Gyr: about 87,000 / 13,000 / 600), or give 3/p95 to 3/p05 as a range.
- Implications text and the stated implications: replace the 'large fraction of those passages' sentence with size-specific statements. One installation of 100 km2 or less per passage is compatible (P(no trace) about 0.3-0.5). One 10,000 km2, 10-kyr installation per passage is excluded at about 98% under the stated assumptions.
- Key number on geochemical sampling and Results section 4: relabel as DM-SED-only lower bounds; add the CENOGRID floors (at least 0.5% of 2.58-500 Ma at <=1 kyr, at least 12% at <=10 kyr); fix coverage() in s05_dmsed.py to use an exact interval union (0.021%, not 0.075%); delete 'none at 100-yr spacing' and 'has not been looked at'; add that sediment mixing limits resolution even where sampling is dense.
- 244Pu, in the key number, Results sections 5-6 and Implications: state 'at most about 10% of weapons-test fallout for 1.34-9 Myr, conditional on a past pulse being incorporated at the interstellar uptake efficiency'; delete the 3% figure; change 'firm' to 'conditional'; add the modern-layer discrepancy (model predicts 2,200-12,000 counts in the top layer against a published interstellar residual of 34±17) and the two-crust attribution.
- Carbon results: say 'the PETM is the only excursion above about 2,000 GtC equivalent; the next largest (10.8 Ma, 62.1 Ma) are about 1,400-1,550 GtC and reach 5 sigma under an alternative detector'. Quote 3,000 GtC completeness by epoch (Eocene 84%). Give the 50% mass as about 1,500-1,900 GtC. Present the 5,000 GtC headline as 0.13 measured (Cenozoic) plus an assumed pre-Cenozoic part. Use about 500 GtC of fossil carbon for emissions to date. Quote the recorded peak for 5,000 GtC as -2.3 per mil.
- Human-scale episode (0.09): state that p_recognise is applied once globally and that placement is uniform on land; either add per-inspection and lowland-concentration variants or quote the value as about 0.01-0.5, probably low by a factor of 2-3.
- Section 7 and Implications: rephrase the Moon comparison as preservation (1-2 orders better) plus surface visibility, not '3-4 orders'.
- Results section 1 and Limitations: label unit durations and yr/cm as time-weighted medians and add the unweighted values (3.1 Myr; 170-370 yr/cm).
- Assumptions table: add A_PATCH = 100 km2 and SCALE_UP = 8, and flag 'P(some part preserved)' and '13-22 regions' as model outputs that depend on them.
- Prior work: add Peters & Heim 2010 (Macrostrat x PBDB sampling completeness), Zalasiewicz et al. 2014 and Zalasiewicz 2008 (technofossil preservation) and Davies 2012; verify each reference before citing.
- Wording for the Fermi model: describe the deliverable as order-of-magnitude conditional estimates. The robust statement is that coverage of ancient land space-time is about 1e-6 x E per 100 km2 by 20-kyr cell, so the terrestrial null result has a likelihood ratio near 1 for brief presences of 100 km2 or less at any plausible E. For 10,000 km2 it is weak (at most about 0.17 per event even at the extreme of the priors). For planet-wide industrial episodes it is assumption-dependent (0.01-0.5).