Where is everybody? · Working papers
How early did life start, and how late did we arrive?
Revised after a second, separate analysis run for this project tried to break it. Neither analysis is an outside expert.
Earth's timeline gives likelihood ratios of order 10 for fast over slow abiogenesis and, when the likelihood is conditioned on our own existence (the standard convention), no lower bound on f_bio.
Summary
Earth's timeline gives likelihood ratios of order 10 for fast over slow abiogenesis and, when the likelihood is conditioned on our own existence (the standard convention), no lower bound on f_bio. With the 4.2 Ga LUCA date Kipping's 13:1 reproduces (10.2-19.2 at 16-84% from the LUCA age error; 13.3 and 12.8 with dates and the repository's 38 LUCA variants integrated out), but it is model-bound: 8.9 to 4.75 if two to five hard steps follow abiogenesis, 20-26 if the later step is not hard, and 1.5-5.7 with accepted fossils only. Snyder-Beattie et al.'s Table 2 reproduces only with thresholds e^-2, e^-12, e^-24 where 10^-2, 10^-12, 10^-24 are printed (rms 0.02 dex against 0.57 dex), an apparent units slip, inferred without their code, that lowers their three-step weight below 10^-12 from over 90% to 44-58%. Posterior medians of log10 f_bio run from -0.15 to -18.5 across four prior families under conditioning (the timeline adds about 0.4-1.3 bits) but from -0.1 to -0.8 without it (self-indication), so the anthropic convention matters more than the prior family; pacing versus gated hard steps is undecided (Bayes factor 0.6-3.3). Everything rests on one planet, constant-rate Poisson steps, a molecular-clock LUCA date squeezed against its 4.52 Ga calibration maximum, and oxygen gates chosen after the fact.
Key numbers
| Quantity | Value | Uncertainty | Note |
|---|---|---|---|
| Kipping limiting Bayes factor, fast vs slow abiogenesis (LUCA 4.2 Ga, start 4.404 Ga, window ends +0.9 Gyr) | 13.0 | 10.2-19.2 (16-84%) from the LUCA age error; published 13.0 (9.9-18.4) | Reproduced. Also 3.79, 8.72, 15.2 and 11.3 for his other cases. |
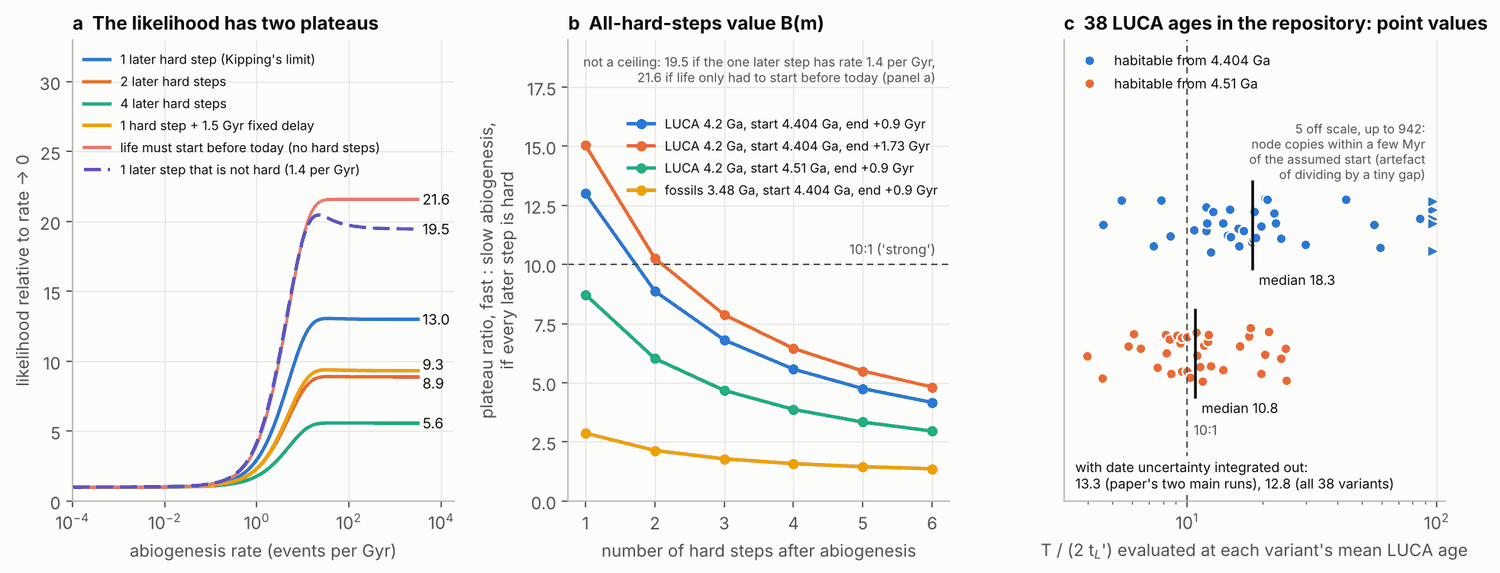
| Same factor with date uncertainty integrated out (repository LUCA posteriors, start uniform 4.404-4.50 Ga, both future estimates) | 13.3 (paper's two main runs); 12.8 (all 38 repository variants pooled) | pointwise 16-84%: 10.4-18.7 and 8.6-27.6; 9.7-10.7 with a 4.51 Ga start | 87% of the 38 variant point estimates exceed 10 for a 4.404 Ga start, 55% for 4.51 Ga. The raw range of point values is not quoted: one non-cross-braced node copy lies 2.8 Myr from the assumed start and gives 942, a division-by-near-zero artefact. |
| All-hard-steps value B(m), m = 1-5 hard steps after abiogenesis (LUCA 4.2, start 4.404, end +0.9) | 13.0, 8.9, 6.8, 5.6, 4.75 | closed form agrees with brute-force integration to 4 significant figures; date-marginalised 13.3, 9.1, 7.0, 5.7, 4.9 | B(m) = T m t_obs^(m-1) / ((m+1)[t_obs^m - (t_obs - t_L')^m]), about T/((m+1) t_L'). End +1.73 Gyr: 15.0, 10.3, 7.9, 6.45, 5.5. Start 4.51 Ga: 8.7, 6.0, 4.7, 3.9, 3.3. Accepted fossils only (3.48 Ga): 2.9, 2.1, 1.8, 1.6, 1.45. |
| Same plateau ratio when the later steps are not all hard (LUCA 4.2, start 4.404, end +0.9) | 19.5 (one later step at 1.4 per Gyr, exact arrival time); 26.0 (Kipping's interval likelihood, fast intelligence); 21.6 (pacing, life needed only before today); 11.1-12.8 (one hard step plus one at 1-10 per Gyr) | range over structures and dates with the LUCA date: 3.3 to 30; with accepted fossils only: 1.45 to 5.7 | B(m) is the corner where every later rate goes to zero; it is neither a floor nor a ceiling in general. General form: B = g(t_obs) int_0^T F / (F(T) [F(t_obs) - F(t_obs - t_L')]). |
| LUCA node systematics in the Moody et al. repository | two copies of the node differ by 0.31-0.51 Gyr without cross-bracing; calibration-only prior 4.43 (4.26-4.51) Ga cross-braced, 4.01 (3.47-4.43) Ga not cross-braced | four non-cross-braced runs; 22 prior-only rows | Root posterior in the paper-main runs is 4.50 (4.45-4.52) Ga, against the 4.52 Ga hard maximum, so the LUCA age is squeezed between that bound and the minimum calibrations. |
| Posterior P(abiogenesis rate > 1 per Gyr) as the log-uniform prior floor is lowered: 1e-3, 1e-10, 1e-30, 1e-100 per Gyr | 0.90, 0.75, 0.52, 0.25 | grid integration; no Monte Carlo error | Prior values 0.50, 0.23, 0.09, 0.03. LUCA 4.2 Ga; intelligence rate marginalised. |
| Kipping 2020 Jeffreys-prior odds for rare intelligence (optimistic, conservative) | 1.545, 1.490 | Monte Carlo 1.5456 +/- 0.0007 and 1.4897 +/- 0.0006; the referee obtained the same | Published 1.638 and 1.572. Still unexplained. The published values are matched (1.636, 1.573) if the ensemble integral omits f_I below 0.0032: one free number fitted to two values, a lead and not an explanation; no error in the paper is implied. |
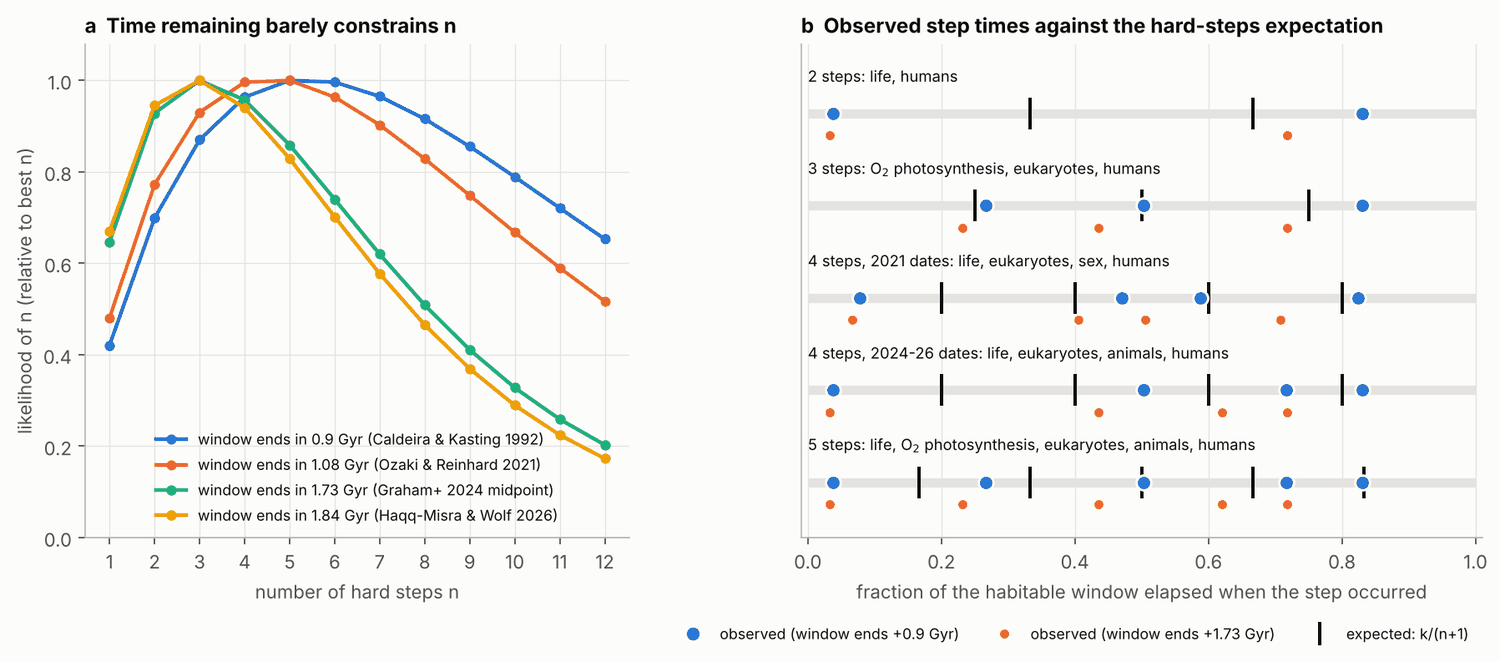
| Best-fit number of hard steps from time remaining | 5 (0.9 Gyr left); 3 (1.73-1.84 Gyr left) | flat-prior 90% interval 2-18 and 1-14; likelihood varies only 1.8-3.5x over n = 1-10 | Joint first-and-last likelihood with abiogenesis hard gives median n 8-11. |
| Goodness of fit of five candidate step sets to uniform order statistics | smallest of 120 correlated p-values = 0.004 | 200,000 simulations per set | Not significant after multiplicity. Power against Earth-like pacing: 3% (Greenwood), 45% (KS). |
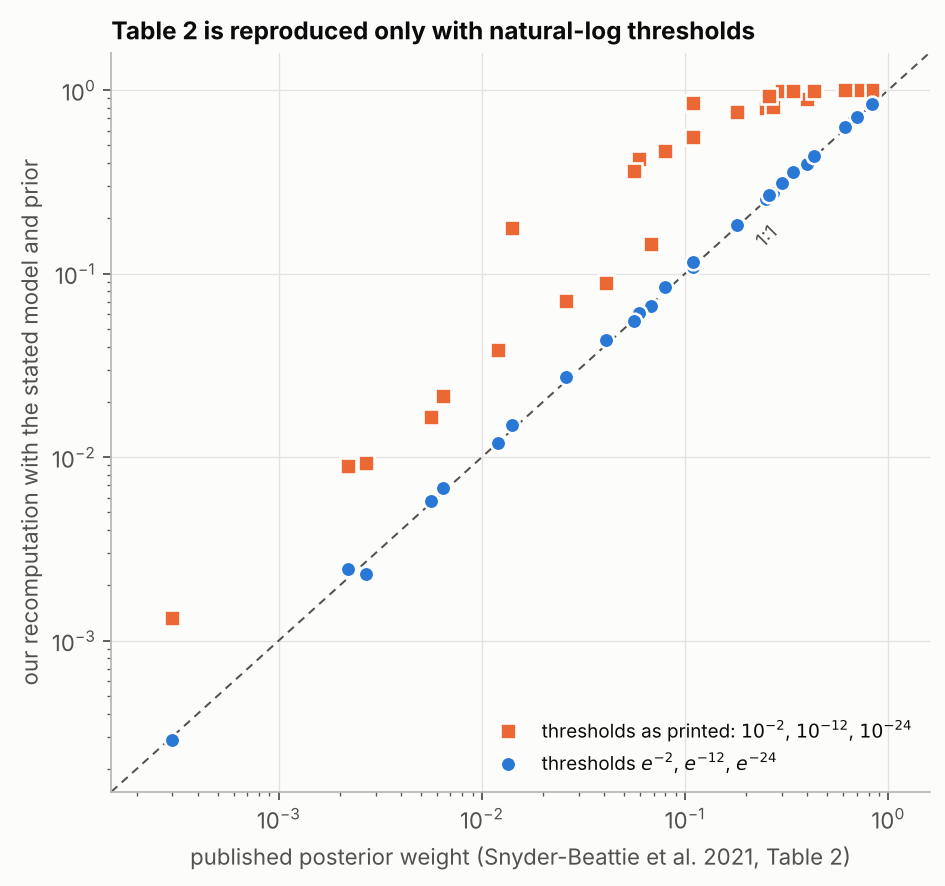
| Snyder-Beattie et al. Table 2, rms log10 deviation of our recomputation from the published 27 cells | 0.022 dex with thresholds e^-k; 0.569 dex with thresholds 10^-k as printed | largest single-cell deviation 14% under the e^-k reading; importance-sampling ESS at least 3.3e4 | Prior weights match the e^-k reading to the printed digits. Table 3 agrees to 0.10-0.20 dex under it (ours higher) against 0.7-3.5 dex as printed. Their stated prior cannot give a two-step probability below 1.35e-19. Apparent slip: authors not contacted, no erratum found as of October 2026; confirmed by the referee with independent code. |
| Snyder-Beattie et al. verbal statements under their stated prior (2, 3, 4 steps) | posterior weight below 10^-12: 11-24%, 44-58%, 64-82%; below 10^-24: 0%, about 1%, 7-15%; below 1%: 86-96%, 98-99%, 99-99.9% | ranges are over the rows of their Table 2 with that number of steps | Published: over 90% below 10^-12 for three steps; over 90% below 1% for two steps (now marginal). The paper's qualitative conclusion stands. |
| Posterior P(expected abiogenesis time > habitable window), Snyder-Beattie prior with 2024-26 dates, 2-5 steps | 0.06-0.12 with their lower prior bound of 1e-14 Ga; 0.09-0.20, 0.18-0.33, 0.32-0.50, 0.53-0.69 for lower bounds 1e-8, 1e-4, 1e-2, 0.1 Ga | prior values 0.38, 0.51, 0.66, 0.77, 0.84; ESS at least 3.8e3 | Prior-driven. The data lower the odds of slow abiogenesis by a factor of 2-11 in every case. 0.60-0.74 if LUCA is treated as the exact time of abiogenesis. Later steps: 0.83-0.97 each. |
| Bayes factor, pacing : gated hard steps (eukaryotes, animals, humans after the three oxygenation steps) | 1.1-2.1 with dates marginalised; 0.9-2.2 with central dates | 0.6-3.3 across four priors on the lag; 0.66-2.3 if the Neoproterozoic gate is its onset (0.80 Ga) | Undecided. Including life: 6-13, which is the early-life evidence again. |
| Bayes factor, pacing : ungated hard steps, same three transitions | 3.8-5.0 with dates marginalised; 8.6-12 with central dates | 5.7-12 with the gate at onset (0.80 Ga) and animals at 0.60-0.75 Ga; zero for both gated models with animals at 0.75 Ga and the gate at 0.635 Ga | The central-date value rests on a 35 Myr ordering (animals 0.60 Ga, gate 0.635 Ga). Lole Durbin et al. 2026 put the origin of Metazoa at about 0.80-0.70 Ga. Upper bounds: gates were chosen after the transitions were known. In 56-57% of date draws a transition predates its gate. |
| Carter coincidence: Bayes factor hard steps : pacing from arrival at 71-83% of the window | 1.0-2.4 with gate times uniform over the window; 2.9-17 with gate times log-uniform | range over 1-6 steps and four window lengths | Applies when gate times are not given to the pacing model for free. |
| Posterior median log10 f_bio by prior family, likelihood CONDITIONED ON SUCCESS (A pacing; A' pacing centre unknown; B 2 and 3 steps; C 4 and 5 steps; D very wide abiogenesis prior) | -0.15; -1.0; -1.1 and -2.2; -13.5 and -18.5; -2.6 | 5-95%: A -0.22 to -0.02; A' -5.0 to -0.02; B -2.2 to -0.07 and -4.2 to -0.35; C -22.8 to -5.0 and -28.9 to -8.6; D -26.5 to -0.85 | Information gained from the timeline: 0 for A, 0.4-1.3 bits for the others (binned estimate for this one marginal; 20, 40 and 80 bins agree to 0.02 bits). Use only with a no-update treatment of our existence. |
| Same families, likelihood NOT conditioned on success (self-indication, or our existence treated as informative) | -0.15; -0.12; -0.23 and -0.38; -0.47 and -0.63; -0.77 | 5-95%: A' -0.85 to 0.00; B -1.18 to -0.01 and -1.56 to -0.02; C -1.81 to -0.03 and -2.16 to -0.06; D -2.00 to -0.19; ESS at least 4e4 | Median f_bio 0.17-0.76 in every family; P(f_bio < 0.01) at most 6%. Insensitive to prior bounds (four steps: -0.47 and -0.46 for rate floors 1e-3 and 1e-20 per Gyr, where the conditioned medians are -3.1 and -29.6). Checked against a 2-D grid and against reweighted samples. Must not be mixed with the conditioned quantiles. |
| Profile likelihood of f_bio relative to maximum (conditioned two-step model) at f_bio = 0.1, 0.5, 0.9, 0.99, 0.999 | 0.97, 0.78, 0.38, 0.10, 0.02 | 0.98, 0.84, 0.49, 0.17, 0.05 if the window ends +1.73 Gyr | Flat to within 4% for every f_bio below 0.1 down to zero. The 6-10:1 penalty on f_bio above 0.99 holds only in constant-rate step models; pacing family A carries none. |
| Posterior P(f_life > 0.5) in families B-D | 0.88-0.94 conditioned on success; 0.99 or more not conditioned | prior 0.50-0.66 | The early-life evidence, seen through each prior. |
| Reproducibility | code/run_all.py: 221-319 s over three runs, peak memory 1.9 GB | fixed seed 20261011 | All 3,982 numbers shared with the first pass are unchanged. The first-pass entry point needed more than 8 GB. |
Data used
- Moody et al. 2024 time-tree archive (Alvarez-Carretero, sabifo4/LUCA-divtimes v1.0.0), Zenodo doi:10.5281/zenodo.11260523, 227 MB zip, downloaded by code/fetch_moody.py to raw/moody_zenodo/; 580 node-age rows (38 posterior and 22 prior-only LUCA ages, 52 root ages) extracted to data/moody_node_ages.csv
- Hand-compiled, cited table of 27 dated events: data/events.csv (built by code/events_table.py); the row added in revision is Lole Durbin, Anttila, Briggs, Macdonald and Anderson 2026, Sci Adv 12(40):eaeg6289, doi:10.1126/sciadv.aeg6289 (verified through Crossref)
- Kipping 2020 (arXiv:2005.09008) and Kipping 2025 (arXiv:2504.05993) LaTeX sources: published Bayes factors and formulae
- Snyder-Beattie et al. 2021, Europe PMC full text PMC7997718: Tables 2 and 3, the plateau statement and the self-indication figure caption
- Mills et al. 2025 (PMC11827626), Watson 2025, Kay et al. 2025 (PMC12872463), Ozaki and Reinhard 2021, Graham, Halevy and Abbot 2024, Haqq-Misra and Wolf 2026: dates and habitable-window estimates
- Whitmire 2025 (arXiv:2503.18217) and Baak and Snoek 2026 (arXiv:2603.02372): abstracts read on arXiv, cited as the opposing anthropic view
- Derived tables in data/: results.json, a1_bmax_table.csv, a1_later_process_sensitivity.csv, a1_moody_luca_bf.csv, a1_prior_sensitivity.csv, a2_n_likelihoods.csv, a2_goodness_of_fit.csv, a3_table2_reproduction.csv, a3_updated_dates.csv, a3_lower_bound_sensitivity.csv, a4_bayes_factors_given_gates.csv, a4_gate_definition_sensitivity.csv, a4_carter_coincidence.csv, a5_fbio_quantiles.csv (with a5_fbio_quantiles_columns.csv), a5_fbio_prior_bound_sensitivity.csv, a5_fbio_sia_prior_bound_sensitivity.csv, a5_profile_likelihood.csv
Method
Every number here is regenerated by
python3 code/run_all.py (fixed seed, 4-5 minutes, peak
memory 1.9 GB) and printed by code/summary.py; full output
is in data/results.json and the CSV named with each result.
Limitations, prior work and implications have their own sections after
this one.
Question
Life appeared early on Earth and technological observers appeared late. With 2024-2026 dates, how much do those two facts constrain (a) the rate of abiogenesis, (b) the number of improbable "hard steps", (c) the choice between hard steps and environmental pacing, and (d) f_bio, the probability that an Earth-like planet produces technological intelligence within its habitable window?
Data
| Source | What was used | Rows |
|---|---|---|
Hand-compiled events table (data/events.csv), each row
cited |
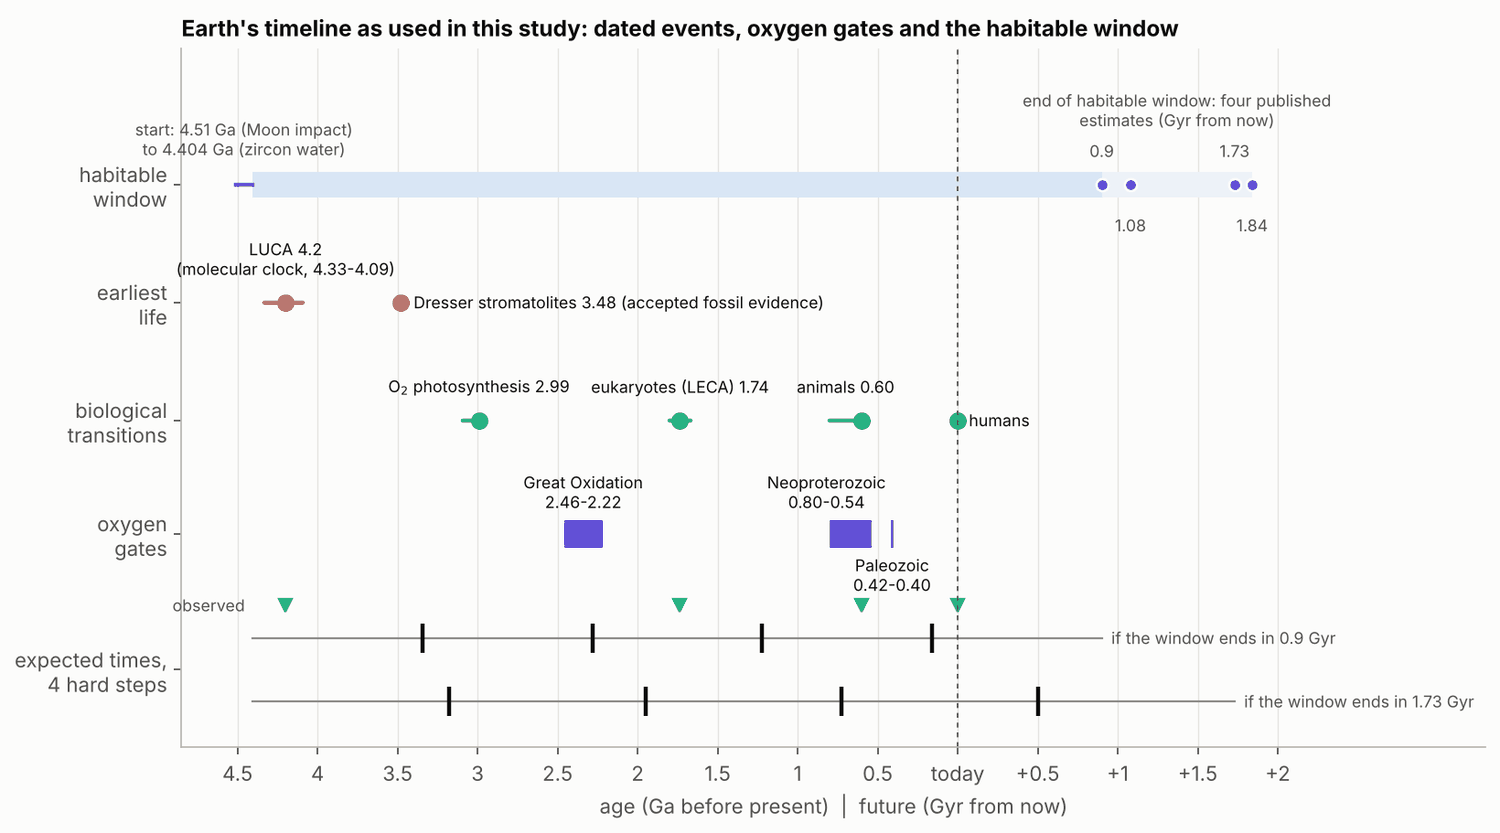
Dates for habitability, earliest life, transitions, oxygenation steps; four estimates of the remaining habitable time (0.9, 1.08, 1.73, 1.84 Gyr) | 27 (11 primary, 10 from abstracts, 6 as quoted elsewhere) |
| Moody et al. 2024 time-tree archive, Zenodo 10.5281/zenodo.11260523 (downloaded by the code) | Mean and 95% interval of dated nodes in every analysis variant | 580 node ages: 38 posterior and 22 prior-only LUCA ages, 52 root ages |
| Kipping 2020 and 2025 (arXiv sources) | Published Bayes factors | 16 numbers |
| Snyder-Beattie et al. 2021 (PMC7997718) | Tables 2 and 3 | 48 numbers |
Cuts: only the archive's *_all_mean_est.tsv summaries
were read (no MCMC samples); mirror nodes in cross-braced runs were
dropped; LUCA draws older than the assumed start of habitability were
excluded (0.1% for the headline age, 3.5% when pooling all 38 variants).
Baseline dates: habitable from 4.404 Ga (or uniform 4.404-4.50), LUCA
4.20 (4.09-4.33) Ga, LECA 1.80-1.67 Ga, animals 0.80-0.574 Ga,
oxygenation steps at 2.46-2.22, 0.80-0.54 and 0.42-0.40 Ga.
Method
Every model is a chain of Poisson steps, evaluated with a hypoexponential routine that stays accurate over about 40 decades of rate. (1) Kipping's two-process model by quadrature and Monte Carlo, then the ratio of the two likelihood plateaus for any process after abiogenesis. (2) Hard steps: likelihood of the number of steps n, and goodness of fit to uniform order statistics with a power calculation. (3) Snyder-Beattie et al.: importance sampling from their stated prior, then the same model with new dates and both prior bounds scanned. (4) Three generative models for the dated transitions: ungated hard steps, hard steps that cannot start before an oxygen gate, and pacing (each transition lags its gate by an exponential time). (5) f_bio under four labelled prior families.
Anthropic convention. Every likelihood in the main analysis is conditioned on success: p(timeline | rates) divided by P(all steps finish inside the window T | rates). This is the convention of Carter, Spiegel and Turner, Kipping, and Snyder-Beattie et al.: a hypothesis gets no credit for producing more observers. It is a choice, and it is what produces the low-rate plateau. Under self-indication, or if our existence is treated as informative evidence (Whitmire 2025; Baak and Snoek 2026), the division cancels and the posterior is prior times p(timeline and success | rates). Snyder-Beattie et al. showed this reversal in a figure. We report it as a labelled second column for every f_bio family. The two sets of quantiles answer different questions and must not be mixed.
Results
1. Abiogenesis. All of Kipping's limiting Bayes factors reproduce (8.72, 2.83; 2025 update 3.79, 8.72, 13.0, 15.2, minimum over window length 11.3). Two of his ten 2020 numbers still do not: the Jeffreys-prior odds for rare intelligence come out 1.545 and 1.490 (the referee obtained the same) against the published 1.638 and 1.572. The cause is unknown; the published values are matched (1.636, 1.573) if the ensemble integral omits f_I below 0.003, which is a lead and not an explanation. Nothing else depends on it.
The likelihood for the abiogenesis rate has two flat plateaus (Fig. 2a). With F and g the distribution function and density of the time from abiogenesis to observers, life by t_L', observers at t_obs and window T, their ratio is
B = g(t_obs) x [integral of F from 0 to T] / ( F(T) x [F(t_obs) - F(t_obs - t_L')] ).
If all m later steps are hard, B(m) = T m t_obs^(m-1) / ((m+1)[t_obs^m - (t_obs - t_L')^m]), roughly T/((m+1) t_L'), a corollary of hard-steps order statistics. m = 1 is Kipping's T/(2 t_L') = 13. B(m) replaces his lower limit when m hard steps follow abiogenesis. It is not a ceiling:
| What follows abiogenesis | LUCA 4.20, start 4.404, end +0.9 Gyr | end +1.73 Gyr | start 4.51 Ga | fossils only (3.48 Ga) |
|---|---|---|---|---|
| 1 hard step (Kipping's limit) | 13.0 | 15.0 | 8.7 | 2.9 |
| 2 / 3 / 4 / 5 hard steps | 8.9 / 6.8 / 5.6 / 4.75 | 10.3 / 7.9 / 6.45 / 5.5 | 6.0 / 4.7 / 3.9 / 3.3 | 2.1 / 1.8 / 1.6 / 1.45 |
| 1 hard step plus 1 step at 1-10 per Gyr | 11.1-12.8 | 13.1-14.8 | 7.5-8.6 | 2.5-2.8 |
| 1 step that is not hard, best rate | 19.5 at 1.4 per Gyr | 23.0 | 12.2 | 3.2 |
| Kipping's interval likelihood, fast intelligence | 26.0 | 30.1 | 17.5 | 5.7 |
| Pacing, life needed only before today | 21.6 | 21.6 | 14.5 | 4.8 |
(data/a1_bmax_table.csv,
data/a1_later_process_sensitivity.csv.) The factor is
therefore about 3-30 with the LUCA date and 1.5-6 with accepted fossils
only.
With the repository LUCA posteriors, a start uniform on 4.404-4.50 Ga and both future estimates integrated out, the one-hard-step factor is 13.3 for the paper's two main runs and 12.8 for all 38 variants pooled (9.7-10.7 with a 4.51 Ga start). Of the 38 variant point estimates, 87% exceed 10 for a 4.404 Ga start and 55% for 4.51 Ga (Fig. 2c). The raw range of point values is not a result: T/(2 t_L') diverges as a LUCA age approaches the assumed start, and one non-cross-braced node copy sits 2.8 Myr from it.
The LUCA age itself is fragile. The two copies of the node differ by 0.31-0.51 Gyr when not forced to share an age. With no sequence data, the calibrations alone put LUCA at 4.43 (4.26-4.51) Ga in cross-braced trees and 4.01 (3.47-4.43) Ga in non-cross-braced ones. The root posterior, 4.50 (4.45-4.52) Ga, sits against the 4.52 Ga hard maximum, so LUCA is squeezed between that bound and the minimum calibrations.
The posterior depends on the prior floor: P(rate > 1 per Gyr) goes from 0.50 to 0.90 (log-uniform down to 1e-3 per Gyr), 0.23 to 0.75 (1e-10), 0.09 to 0.52 (1e-30) and 0.03 to 0.25 (1e-100).
2. Hard steps. The time remaining barely constrains n (Fig. 3a): the best n is 5 (0.9 Gyr left) or 3 (1.73-1.84 Gyr left), but the likelihood varies by only a factor 1.8-3.5 across n = 1-10, and a flat-prior 90% interval is 2-18 or 1-14. If abiogenesis is itself a hard step, its earliness pulls the other way (median n 8-11). No candidate step set is rejected once 120 correlated p-values are allowed for (smallest 0.004), and the test would reject Earth-like pacing only 3% (Greenwood) or 45% (KS) of the time.
3. Snyder-Beattie et al. Their Table 2 is reproduced only if the column thresholds are e^-2, e^-12, e^-24 and not the printed 10^-2, 10^-12, 10^-24 (Fig. 4): rms difference 0.02 dex over 27 cells, against 0.57 dex as printed. The nine prior weights match the same reading; Table 3 agrees to 0.10-0.20 dex under it, against 0.7-3.5 dex as printed. Independently, their stated prior cannot produce a two-step probability below 1.4e-19, so the printed two-step entries for 10^-24 (0.61-0.83) cannot be literal. This is an apparent natural-log/base-10 slip, inferred from the tables and confirmed by the referee with independent code. We have not seen the authors' code, have not contacted them, and found no erratum as of October 2026.
| Posterior weight above 10^-2 / 10^-12 / 10^-24 | printed | ours, e^-k | ours, 10^-k |
|---|---|---|---|
| 2 steps (row 2) | 0.026 / 0.25 / 0.68 | 0.027 / 0.25 / 0.70 | 0.071 / 0.80 / 1.00 |
| 3 steps (row 6) | 0.0022 / 0.059 / 0.30 | 0.0025 / 0.061 / 0.31 | 0.0089 / 0.42 / 0.99 |
| 4 steps (row 8) | 0.0003 / 0.014 / 0.11 | 0.0003 / 0.015 / 0.12 | 0.0013 / 0.18 / 0.85 |
Their "less than 1% chance" statements stand for three and four steps (98-99% and 99-99.9% of posterior) and are marginal for two (86-96% against "over 90%"). "Over 90% of posterior below 10^-12" for three steps becomes 44-58%, and the weight below 10^-24 becomes 0%, about 1% and 7-15% for two, three and four steps. The paper's qualitative conclusion is unaffected.
With 2024-26 dates and their prior, each later step has posterior
probability 0.83-0.97 of an expected time longer than the window. For
abiogenesis the answer is prior-driven: 0.06-0.12 under their lower
bound of 1e-14 Ga on the mean time, but 0.18-0.33 and 0.53-0.69 for
lower bounds of 1e-4 and 0.1 Ga
(data/a3_lower_bound_sensitivity.csv), and 0.60-0.74 if the
first evidence is treated as the exact time, as they did. The data lower
the odds of slow abiogenesis by a factor of 2-11 in every case.
4. Hard steps versus pacing
(data/a4_bayes_factors_given_gates.csv).
| Bayes factor, dates marginalised (central dates in brackets) | eukaryotes, animals, humans | plus life |
|---|---|---|
| gated hard steps : ungated | 2.3-3.5 (5.6-9.7) | 1.1-1.5 (2.5-4.0) |
| pacing : ungated | 3.8-5.0 (8.6-12) | 9-14 (22-38) |
| pacing : gated hard steps | 1.1-2.1 (0.9-2.2) | 6-13 (5.5-15) |
| pacing : gated hard steps, three other lag priors | 0.6-3.3 | 3.4-34 |
The three later transitions follow the oxygen gates more closely than
ungated hard steps predict, but they cannot separate pacing from gated
hard steps (Bayes factor 0.6-3.3). The extra factor when life is
included is the early-life evidence again. The central-date values rest
on a 35 Myr ordering: animals at 0.60 Ga against a gate at 0.635 Ga.
With animals at 0.75 Ga (Lole Durbin et al. 2026) and the same gate,
both gated models have zero likelihood; with the gate at the onset of
Neoproterozoic oxygenation (0.80 Ga), pacing against ungated is 5.7-12
and pacing against gated hard steps 0.66-2.3
(data/a4_gate_definition_sensitivity.csv). If gate times
are not handed to the pacing model for free, Carter's coincidence
returns: our arrival at 71-83% of the window favours hard steps by
1.0-2.4 (gate times uniform over the window) or 3-17 (log-uniform). Two
to three further biospheres with fully dated gates and transitions would
be needed for a median Bayes factor of 100.
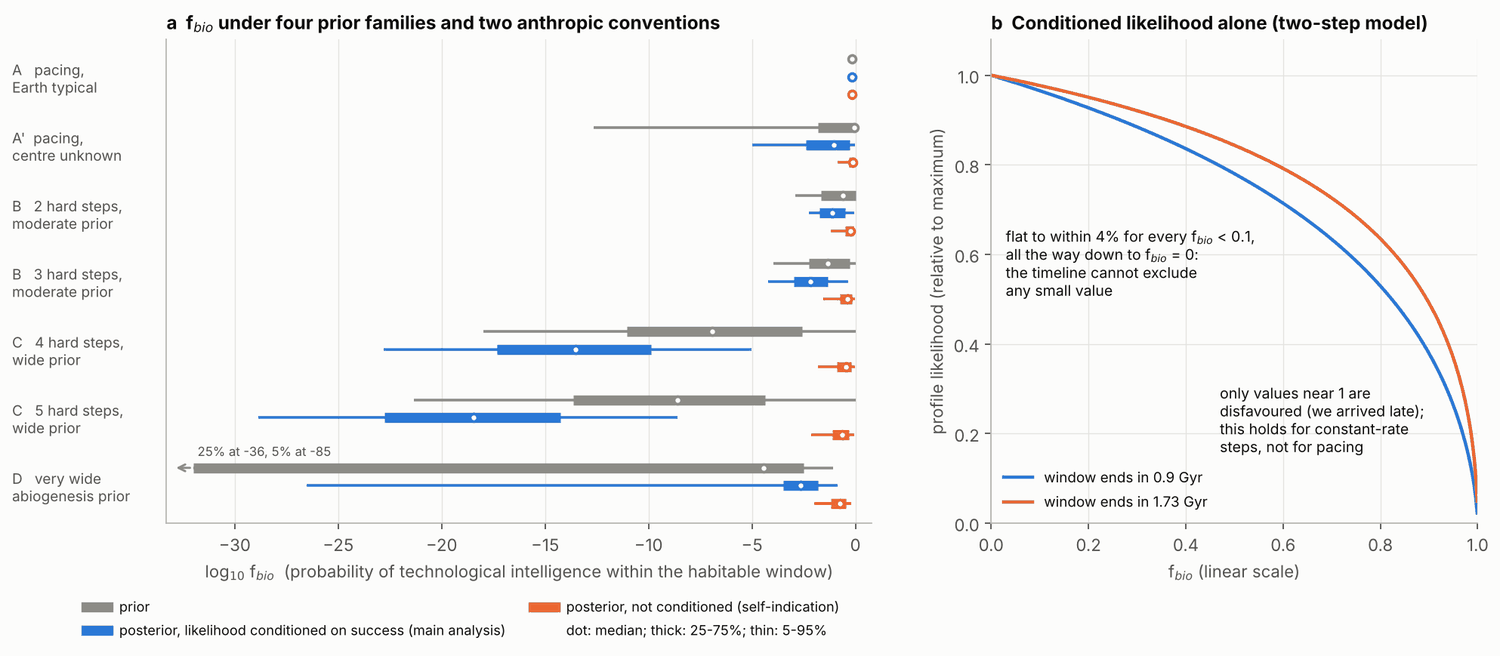
5. f_bio (data/a5_fbio_quantiles.csv,
columns explained in data/a5_fbio_quantiles_columns.csv;
Fig. 5). Quantiles of log10 f_bio, 5% / 50% / 95%.
| Family | prior | posterior, conditioned on success | bits gained | posterior, not conditioned (self-indication) |
|---|---|---|---|---|
| A pacing, Earth assumed typical | -0.22 / -0.15 / -0.02 | same (no update) | 0 | same |
| A' pacing, centre unknown 0.1-100 Gyr | -12.6 / -0.05 / 0.00 | -5.0 / -1.0 / -0.02 | 0.93 | -0.85 / -0.12 / 0.00 |
| B 2 steps, rates 1e-3 to 1e3 per Gyr | -2.9 / -0.6 / 0.00 | -2.2 / -1.1 / -0.07 | 0.51 | -1.18 / -0.23 / -0.01 |
| B 3 steps, same | -4.0 / -1.3 / 0.00 | -4.2 / -2.2 / -0.35 | 0.38 | -1.56 / -0.38 / -0.02 |
| C 4 steps, rates 1e-10 to 1e14 per Gyr | -18.0 / -6.9 / 0.00 | -22.8 / -13.5 / -5.0 | 0.84 | -1.81 / -0.47 / -0.03 |
| C 5 steps, same | -21.3 / -8.6 / 0.00 | -28.9 / -18.5 / -8.6 | 1.28 | -2.16 / -0.63 / -0.06 |
| D abiogenesis prior 50 dex wide | -84.9 / -4.5 / -1.1 | -26.5 / -2.6 / -0.85 | 0.56 | -2.00 / -0.77 / -0.19 |
Conditioned on success, posterior medians span 18 orders of magnitude across families and the timeline adds about 0.4-1.3 bits (a binned estimate for this one marginal). Not conditioned, every family lands at a median f_bio of 0.17-0.76, with at most a 6% chance that f_bio is below 0.01, and the prior bounds stop mattering: four steps give -0.47 with rate floors of 1e-3 per Gyr and -0.46 with 1e-20, where the conditioned medians are -3.1 and -29.6. The anthropic convention matters more than the prior family.
The profile likelihood of f_bio in the conditioned two-step model is flat to within 4% for every f_bio below 0.1 down to zero, and falls to 0.78, 0.38, 0.10 and 0.02 at f_bio = 0.5, 0.9, 0.99 and 0.999 (0.17 at 0.99 with the longer window). Within constant-rate step models, then, f_bio above 0.99 is disfavoured 6-10:1; under pacing (family A) late arrival carries no such penalty. Early life raises P(f_life > 0.5) from 0.50-0.66 to 0.88-0.94 in families B-D.
Robustness checks
- Closed-form B(m) against brute-force integration: 13.000/13.001, 8.872/8.873, 6.811/6.811, 5.576/5.576. The general plateau formula, the one-step closed forms and direct likelihood ratios agree to four significant figures.
- Unconditioned posteriors: for two steps the sampler's date-marginalised quantiles lie between grid results at central dates for the two windows, and reweighting the conditioned samples agrees to 0.01 dex where its effective sample size is adequate (two steps, three steps, family D).
- All 3,982 numbers shared with the first pass are unchanged by the revision.
- The Jeffreys discrepancy with Kipping is the same with 600 and 800 quadrature nodes and under Monte Carlo.
- Information gain is the same to 0.02 bits with 20, 40 and 80 bins.
- Importance-sampling effective sample sizes are at least 3.8e3 (updated Snyder-Beattie runs), 3.3e4 (Table 2 rows) and 4e4 (every f_bio family, both conventions).
Response to referee
Every substantive point was accepted: two major (the unstated anthropic convention; the "4.6 to 942" range) and twelve minor. Each point and what was done is listed under "Changes made in revision" below; two small corrections to the referee's own statements are under "Referee points rejected". The headline survives in a narrower form. Likelihood ratios of order 10 and about one bit are what the dates carry. "f_bio spans 18 orders of magnitude by prior family" is true only under the conditioning convention; under self-indication the spread is 0.65 dex.
Closest prior work and what is new
Closest prior work. Kipping 2020 (PNAS 117:11995) and Kipping 2025 (arXiv:2504.05993) for the two-process limiting Bayes factor; Spiegel and Turner 2012 for prior dependence; Carter 1983 and 2008, Hanson 1998 and Hanson et al. 2021 (arXiv:2102.01522) for hard-steps order statistics; Snyder-Beattie, Sandberg, Drexler and Bonsall 2021 (Astrobiology 21:265) for the multi-step Bayesian model, the non-zero likelihood plateau (their stated first key result) and a figure showing that self-indication removes it; Whitmire 2025 (arXiv:2503.18217) and Baak and Snoek 2026 (arXiv:2603.02372) for the view that our existence is informative; Balbi and Lingam 2023 for prior-dominated abiogenesis bounds; Mills et al. 2025 (Sci Adv 11:eads5698) and Watson 2025 for pacing and fixed delays.
What is new. (i) Evidence that Snyder-Beattie et al.'s Tables 2-3 use thresholds e^-k where 10^-k is printed, with the effect on their extreme-rarity statements; confirmed by the referee with independent code; no erratum found as of October 2026. (ii) Kipping's factor evaluated on all 38 LUCA datings in the Moody et al. public repository with date uncertainty integrated out, plus the 0.31-0.51 Gyr gap between node copies without cross-bracing and the calibration-only priors. (iii) A likelihood comparison of ungated hard steps, gated hard steps and pacing on the same dated transitions (a toy: gates were chosen after the fact). (iv) f_bio quantiles for the same four prior families under both anthropic conventions, showing that the convention moves the answer by up to 18 orders of magnitude while the prior family moves the unconditioned answer by 0.65 dex. Not new as results: the all-hard-steps value B(m) is a corollary of hard-steps order statistics applied to Kipping's limit (the general plateau-ratio formula for an arbitrary later process is our presentation; we did not find it stated); the absence of a lower bound on f_bio is in Snyder-Beattie et al. 2021, Carter 1983 and Spiegel and Turner 2012, and only the profile-likelihood presentation is ours; the self-indication reversal was shown qualitatively by Snyder-Beattie et al.
Confidence that it is new: medium
Limitations
- One planet. Every data-driven result is a likelihood ratio of order 10 or less; everything else is prior or anthropic convention.
- Anthropic convention. The main quantiles condition on success; the unconditioned ones assume self-indication. We do not adjudicate between them, and self-indication has its own known objections. Either set is valid only inside an analysis that uses the same convention throughout.
- The events table is hand-compiled: of 27 entries, 11 were read in the primary source or its abstract record, 10 confirmed from abstracts or summaries, 6 taken as quoted by another paper.
- LUCA uncertainty uses repository means and 95% intervals with a two-piece normal, not MCMC samples. The 38 variants are not independent and were not weighted; draws older than the assumed start are excluded (3.5% when pooling all variants). The LUCA age is squeezed between the 4.52 Ga root maximum and the minimum calibrations.
- The Snyder-Beattie units finding is an inference from reproducing their tables. We have not seen their code or contacted the authors.
- The 6% discrepancy with Kipping's two Jeffreys-prior intelligence odds is unexplained.
- Oxygen gates were chosen by Mills et al. after the transitions were known and are partly caused by life, so Bayes factors favouring gating are upper bounds. Treating a protracted oxygenation as one uniformly distributed date is crude, and with the 2026 animal-origin estimate (0.80-0.70 Ga) and a mid-oxygenation gate both gated models are excluded outright.
- Pacing versus gated hard steps depends on the lag prior (about a factor 4) and on which date counts as eukaryotes: LECA at 1.74 Ga fits, the nuclear-lineage FECA at 3.05-2.79 Ga predates the gate.
- Constant rates, independent steps and one common habitable window are assumed. Families A' and D are our own simplified encodings of the pacing and Sandberg-Drexler-Ord positions.
- The profile likelihood of f_bio was computed for the two-step model only, and the penalty on f_bio near 1 is internal to constant-rate step models.
- The 3-30 range of the fast:slow factor covers the structures we tried (Poisson chains, a fixed delay, a deadline); for other later processes it has no general bound.
- The information gain in bits is a binned estimate for one marginal, not a bound.
- Until it is re-rendered the file on disk is the first-pass version.
What it means for the Fermi question
Under the standard convention (likelihood conditioned on our own existence), Earth's timeline supports two modest statements. First, abiogenesis was probably not slow compared with the habitable window: the likelihood ratio is 13 in Kipping's model and between about 3 and 30 with the 4.2 Ga LUCA date depending on what follows abiogenesis and when habitability began, but only 1.5-6 with accepted fossils, and it does not survive priors wider than about 30 decades. Second, within constant-rate step models f_bio above 0.99 is disfavoured 6-10:1; pacing models carry no such penalty. Under that convention the timeline does not say whether f_bio is 0.1 or 1e-20. That is set by whether one believes in hard steps and how wide the rate priors are, and timing cannot arbitrate (Bayes factor near 1 between pacing and gated hard steps). A Great Filter in the biological steps is therefore allowed but not demonstrated by timing. Under self-indication, or if our existence is treated as informative (Whitmire 2025; Baak and Snoek 2026), the same data give a median f_bio of 0.2-0.8 in every prior family with at most a 6% chance that f_bio is below 0.01. A rate-based biological filter on Earth-like planets is then nearly excluded, and the silence has to be explained elsewhere: rarity of Earth-like planets, a late filter, or civilizations that do not expand or signal. For the integrator: treat f_bio as a two-level choice, first the anthropic convention and then, only under conditioning, the prior family. Use the post_ quantiles in data/a5_fbio_quantiles.csv only with a no-update treatment of our existence, and the sia_ quantiles only inside a full self-indication calculation that also weights every other factor and the Fermi observation; never mix them. The one published timing-based claim of extreme rarity that we checked (two sentences and one table in Snyder-Beattie et al.) is weaker than printed; that paper's qualitative conclusion, that most posterior weight lies below a 1% chance, stands.
Changes made after the referee report
- Referee major 1 (anthropic assumption never stated): the convention is now stated in Method, in the f_bio table and in Implications. Added the unconditioned (self-indication) posterior for every family with a dedicated sampler (ESS at least 4e4), checked against a 2-D grid and against reweighted samples. Medians of log10 f_bio: -0.23 (2 steps), -0.38 (3), -0.47 (4), -0.63 (5), -0.77 (family D), -0.12 (A'), which confirms the referee's -0.2 to -0.7. Cited Whitmire 2025 and Baak and Snoek 2026 (both verified on arXiv) and credited Snyder-Beattie et al. for showing the reversal. Added the integrator warning, a column dictionary (data/a5_fbio_quantiles_columns.csv) and a third bar per family in Fig. 5a.
- Referee major 2 ('4.6 to 942'): removed from the headline, the key numbers and the summary printout. The report quotes the date-marginalised 13.3 and 12.8 and the shares of variants above 10 (87% and 55%). Fig. 2c now clips at 100 and labels the five off-scale point values as an artefact; results.json keeps the 942 value only under a field marked as such.
- Referee minor ('ceiling'): reworded in the headline, Result 1 and Fig. 2b (new title and axis). B(m) is described as the all-hard-steps value that replaces Kipping's lower limit when m hard steps follow. Added a general plateau-ratio formula and code/a1_kipping.later_process_sensitivity: 19.5 at 1.4 per Gyr (exact arrival time), 26.0 in Kipping's interval likelihood, 21.6 for pacing with a deadline today, 11.1-12.8 for one hard plus one faster step. All four referee numbers were reproduced.
- Referee overclaim ('likelihood ratio about 5-15'): replaced by the full range with conditions: about 3 to 30 with the 4.2 Ga LUCA date, 1.5-6 with accepted fossils only.
- Referee minor (f_bio above 0.99): now 'within constant-rate step models, disfavoured 6-10:1 (two-step model, window +1.73 or +0.9 Gyr); pacing family A carries no such penalty', in Results, Implications and Fig. 5b.
- Referee minor (calibration-only LUCA prior): both priors are given, 4.43 (4.26-4.51) Ga cross-braced and 4.01 (3.47-4.43) Ga not cross-braced, with the root posterior 4.50 (4.45-4.52) Ga against the 4.52 Ga maximum. These are now computed in code from data/moody_node_ages.csv.
- Referee minor (abiogenesis under the Snyder-Beattie prior): added a scan of the lower prior bound (data/a3_lower_bound_sensitivity.csv). The 0.06-0.12 figure is labelled prior-driven; it becomes 0.53-0.69 for a 0.1 Ga bound. The referee's 0.05, 0.09, 0.16, 0.30, 0.53 for two steps are reproduced as 0.055, 0.093, 0.18, 0.32, 0.53 with dates marginalised.
- Referee minor (Snyder-Beattie wording): the units finding is called apparent, with the statement that the authors were not contacted and no erratum was found as of October 2026. 'Table 3 matches' became 'agrees to 0.10-0.20 dex' (now computed in code), and the two-step 'over 90% below 1%' statement is reported as 86-96%. The implication sentence is narrowed to two sentences and one table in one paper.
- Referee minor (animal date and gate ordering): cited Lole Durbin et al. 2026 after checking the DOI in Crossref (the first author's surname is Lole Durbin; Sci Adv 12(40):eaeg6289, published 2 October 2026) and added it to the events table. Result 4 now leads with the date-marginalised Bayes factors, states the 35 Myr dependence, and reports a gate-definition sensitivity (data/a4_gate_definition_sensitivity.csv): pacing against ungated 5.7-12 and pacing against gated 0.66-2.3 with the gate at onset; zero for both gated models with animals at 0.75 Ga and the gate at 0.635 Ga.
- Referee novelty check: item (v) is withdrawn as a novelty and credited to Snyder-Beattie et al. 2021, Carter 1983 and Spiegel and Turner 2012; item (i) is described as a corollary of hard-steps order statistics applied to Kipping's limit.
- Referee minor (memory): the 2,000,000-draw Monte Carlo in a1_kipping.reproduce_2020 is evaluated in chunks of 100,000. The entry point now peaks at 1.9 GB and ran in 221-319 s on three runs; all 3,982 numbers shared with the first pass are identical.
- Referee minor ('at most 1.3 bits'): now 'about 0.4-1.3 bits, a binned estimate for one marginal'. Added 20-bin and 80-bin estimates, which agree with the 40-bin value to 0.02 bits.
- Referee minor (Kipping's Jeffreys odds): still reported as unexplained, with the referee's identical values noted and no error in the paper implied. Added one diagnostic: the published 1.638 and 1.572 are matched (1.636, 1.573) if the ensemble integral omits f_I below 0.0032.
- Beyond the referee's list: verified from the Europe PMC text that Snyder-Beattie et al. themselves state the non-zero plateau as their first key result and show a self-indication posterior, and credited both; added P(f_bio < 0.1, 0.01, 1e-6) under the unconditioned posterior; added the 'not hard' curve to Fig. 2a.
Referee points not accepted
- No substantive referee point is rejected: every reported error and overclaim was confirmed by rerunning and the text was changed.
- Corrected in passing, range of the fast:slow factor. The referee asked for 'about 3 to about 22'. The report gives 3.3 to 30, because Kipping's own interval likelihood rises monotonically to T/t_L' = 26.0 (30.1 with the longer window) when intelligence is fast. This also means his 13:1 remains a true lower limit inside his two-process model, as the first pass said.
- Corrected in passing, citation. The referee's 'Durbin et al. 2026, published August-September 2026' is Lole Durbin, Anttila, Briggs, Macdonald and Anderson, Science Advances 12(40):eaeg6289, published 2 October 2026 according to Crossref; 20 August 2026 is the date of the Dryad data set.
- Kept from the first pass: under the conditioning-on-success convention f_bio is a prior-family choice spanning about 18 orders of magnitude. The referee reproduced this; it is now stated with the convention attached and not as an unconditional conclusion.
Figures
Code
Every number above is produced by these scripts from public data. The data tables themselves are not hosted here; the scripts download them.
a1_kipping.py a2_hardsteps.py a3_snyder_beattie.py a4_models.py a5_fbio.py config.py events_table.py fetch_moody.py figures.py run_all.py summary.py timing_lib.py
Referee report
A second, separate analysis re-ran the code, recomputed the main numbers by its own route and tried to break the result. Like the first, it was run by Claude for this project; it is not an outside expert. In its report “the analyst” is the first analysis, which wrote the paper, and file names that are not linked on this page are its own working files. The paper above is the version revised in response.
Verdict: sound with fixes. Results reproduced: yes.
The headline numbers are true as computed; the problems are in scope and wording, not arithmetic.
RERUN. I copied code/ to a separate working folder and ran run_all.py there (nothing in the study directory was touched). The unmodified entry point was OOM-killed at about 8 GB resident memory in the Monte Carlo cross-check of a1_kipping.reproduce_2020. After chunking that one call (same random stream) it finished in 233 s with a 1.9 GB peak. All 3,986 numeric leaves of results.json and all 14 CSVs are identical to the analyst's files, and summary.py prints every number quoted in the report.
INDEPENDENT RECOMPUTATION (my scripts):
- B(m): scipy quadrature of exact exponential densities at small finite rates gives 13.001, 8.873, 6.811 for m = 1-3, against the closed form 13.000, 8.872, 6.811. I also re-derived the formula by hand. The other date cases match (15.0/10.3/7.9/6.45/5.5; 8.7/6.0/4.7/3.9/3.3; 2.9/2.1/1.8/1.6/1.45).
- Snyder-Beattie Table 2: my own nested Gauss-Legendre CDF, with a
full 2-D grid for the two-step rows and importance sampling for the
three-step rows, shares no code with the analyst.
- Two-step row 2: published 0.026/0.25/0.68; mine 0.028/0.254/0.699 with e^-k thresholds and 0.071/0.80/1.00 with 10^-k.
- Three-step row 6: published 0.0022/0.059/0.30; mine 0.0024/0.059/0.310 with e^-k and 0.0094/0.42/0.986 with 10^-k.
- Prior weights: a pencil-and-paper area calculation gives 0.42/0.67/0.94 for two steps with e^-k (published 0.42/0.66/0.94) and 0.48/0.96/1.00 with 10^-k.
- The floor of 1.35e-19 on a two-step probability under their stated prior is exact (L^2/2 / 1e20). The analyst's finding is confirmed.
- Hypoexponential CDF routine: agrees with my quadrature to 1e-5 dex on 3,000 random three-step rate vectors spanning 1e-10 to 30 per Gyr.
- Family B2 posterior of log10 f_bio: my grid integration at central dates gives -2.26/-1.16/-0.08 (window +0.9) and -2.18/-1.06/-0.05 (+1.73); the analyst's date-marginalised values are -2.23/-1.11/-0.07.
- Profile likelihood at f_bio = 0.5, 0.9, 0.99: by hand 0.78, 0.38, 0.10, matching.
- Moody archive: I read the LUCA rows straight from the zip. Paper-main ILN is 4.214 (4.093-4.318) and GBM 4.260 (4.175-4.332); there are 38 posterior LUCA rows spanning 3.829-4.401 Ga; the non-cross-braced copies are 4.401 and 4.042 in the concatenated GBM run. The extraction is correct.
- Kipping 2020 Jeffreys odds: I get 1.545 and 1.490 too (published 1.638 and 1.572). Mixing Jeffreys and uniform priors between the two rates does not recover the published values. This used the analyst's likelihood function, so it is only a partial check.
CITATIONS spot-checked and correct:
- arXiv API: Kipping 2025 (2504.05993), Graham et al. 2024 (2409.10714, 1.6-1.86 Gyr), Ozaki and Reinhard 2021 (1.08 +/- 0.14 Gyr), Haqq-Misra and Wolf 2026 (2605.22404; 1.35, 1.68, 1.84, 1.87 Gyr).
- Cached PMC text: Kay et al. 2025 (Nature 650:129; LECA 1.80-1.67, mFECA 2.37-2.13, nFECA 3.05-2.79 Ga) and Watson 2025 (1.5 Gyr delay, two to three steps).
- Kipping source files: 13.0 +5.4/-3.1, 15.2, 11.3.
- Sandberg, Drexler and Ord: abiogenesis rate log-normal with a standard deviation of 50 orders of magnitude, f_i log-uniform 0.001-1, f_c log-uniform 0.01-1. Family D encodes this faithfully.
The full referee content is in this object.
Strongest objection
An expert in anthropic reasoning would say the central result is a consequence of one modelling choice that the report never names. Every likelihood is divided by the probability that all steps succeed within the window. That division is what produces the plateau at low rates, the 'no lower bound on f_bio' statement and the 18-orders-of-magnitude spread between prior families. It is the standard convention in Carter, Spiegel and Turner, Kipping and Snyder-Beattie et al., but it is contested: under self-indication-style weighting, or if Earth is treated as a random draw from Earth-like planets (Whitmire 2025; Baak and Snoek 2026), the division cancels.
I tested this by re-weighting the analyst's own samples without the division. Posterior medians of log10 f_bio become -0.2 to -0.7 for every step family, instead of -1.1 to -18.5. The disagreement between prior families nearly vanishes.
The conclusion survives in a narrower form. Given that we exist, the dates themselves carry likelihood ratios of order 10 and about one bit; that statement is correct and I reproduced it. What does not survive unqualified is 'f_bio is a prior-family choice spanning 18 orders of magnitude'. That is true under the conditioning-on-success convention; under the alternative the anthropic school matters more than the prior family. The f_bio quantiles can be used by an integrator only with that label attached, and must not be mixed with a self-indication treatment elsewhere in the Fermi analysis.
A second objection, from a geobiologist, is that constant-rate Poisson steps are an unphysical model and every number is internal to it. The report already concedes this.
Errors found
- major. The anthropic assumption behind every
headline number is never stated. All likelihoods are divided by P(all
steps succeed within the window). That is the Carter/Kipping convention,
but it is a choice. Under self-indication-style weighting (hypotheses
weighted by how many observers they produce, or equivalently Earth
treated as a random draw, as in Whitmire 2025 and Baak and Snoek 2026)
the division cancels and the plateau disappears.
- Evidence: Re-weighting the analyst's own samples without the division gives posterior medians of log10 f_bio of -0.23 (B2), -0.39 (B3), about -0.5 (C4) and about -0.7 (C5), against -1.1, -2.2, -13.5 and -18.5 as reported. My grid calculation for B2 gives -0.25. The C4 and C5 values rest on effective sample sizes of about 2,100 and 520, so they are approximate.
- Fix: Add a paragraph to Method and to Implications stating that all quantiles are conditional on success, and that under self-indication the timeline plus our existence pulls every step family to f_bio of roughly 0.2-0.6. Add this as a labelled sensitivity row or column in the f_bio table. Cite Whitmire 2025 (arXiv:2503.18217) and Baak and Snoek 2026 as the dissenting view. Tell the integrator that these quantiles must not be combined with a self-indication treatment elsewhere.
- major. The headline range '4.6 to 942' for
Kipping's factor across the 38 repository LUCA ages is a
divide-by-near-zero artefact and should not be quoted.
- Evidence: 942 comes from one non-cross-braced copy of the LUCA node (concatenated, GBM) with mean 4.4012 Ga, 2.8 Myr from the assumed 4.404 Ga start, whose own 95% interval is 4.19-4.51 Ga. The factor T/(2 t_L') diverges as LUCA approaches the start date. The analyst's own date-marginalised value for all 38 variants pooled is 12.8 (13.3 for the two paper-main runs).
- Fix: Remove '4.6 to 942' from the headline and key numbers. Quote the marginalised 13.3 and 12.8, and the fraction of variant point estimates above 10 (87% for a 4.404 Ga start, 55% for 4.51 Ga). Keep the per-variant scatter for the figure only, with the divergence explained.
- minor. 'Ceiling' is the wrong word for B(m), and
'the largest Bayes factor any pair of rate hypotheses can reach' is true
only if every later step is hard.
- Evidence: B(m) is the value in the corner where all later rates go to zero. With one later step at a finite rate, the fast-to-slow ratio rises from 13.0 to a maximum of 19.5 at about 1.4 per Gyr with exact-time data, and to 26 in Kipping's interval likelihood. With two later steps, one hard and one of rate 1-10 per Gyr, it is 11.1-12.8 rather than 8.9. The analyst's own Fig. 2a shows 21.6 for pacing with a deadline today.
- Fix: Reword the headline, the sentence in Result 1 and the title and axis of Fig. 2b: B(m) = T/((m+1) t_L') is the all-hard-steps value, which replaces Kipping's lower limit when m later hard steps exist. State that the factor ranges from about 3 to about 22 depending on what follows abiogenesis and on the start date, instead of '5-15'.
- minor. 'f_bio above 0.99 is disfavoured about 10:1'
and 'values of f_bio near 1 are disfavoured' are presented as
data-driven, but they hold only inside constant-rate step models.
- Evidence: The profile likelihood was computed for the two-step Poisson model only: 0.10 with the window ending +0.9 Gyr and 0.17 with +1.73 Gyr, so 6:1 to 10:1. In the analyst's own pacing family A the posterior 95th percentile is f_bio = 0.95 with no penalty for late arrival.
- Fix: Say 'within constant-rate step models, f_bio above 0.99 is disfavoured 6-10:1; under pacing models late arrival carries no such penalty'.
- minor. 'Calibrations alone put LUCA at 4.43
(4.26-4.51) Ga' is true only for the cross-braced configuration.
- Evidence: In data/moody_node_ages.csv the prior-only (CLK) rows give 4.426 (4.263-4.508) for cross-braced runs but 4.00 (3.47-4.43) for non-cross-braced runs. The root posterior in the paper-main runs is 4.50 (4.45-4.52), sitting against the hard 4.52 Ga maximum.
- Fix: State both priors, and note that the root sits against the Moon-forming-impact bound, so the LUCA age is squeezed between that maximum and the minimum calibrations.
- minor. The updated Snyder-Beattie statement that
abiogenesis has only 0.06-0.12 posterior probability of an expected time
longer than the window is driven by the lower prior bound of 1e-14 Ga,
not by the data.
- Evidence: In the two-step model at central dates I get 0.05 with the 1e-14 Ga bound, 0.09 with 1e-8, 0.16 with 1e-4, 0.30 with 1e-2 and 0.53 with 0.1 Ga. The thirteen decades of 'fast' prior volume do the work.
- Fix: Report this number with its dependence on the lower bound, and label it prior-driven like the upper-bound dependence already shown.
- minor. The central-date Bayes factors for pacing
against ungated hard steps (8.6-12) depend on a 35 Myr ordering of two
uncertain dates, and the newest animal-origin estimate is not cited.
- Evidence: Crown animals are set at 0.60 Ga and the Neoproterozoic gate at 0.635 Ga. Durbin et al. 2026 (Science Advances, doi:10.1126/sciadv.aeg6289; Dryad abstract: about 800-700 Ma origin of Metazoa) was published in August-September 2026. With animals at 0.75 Ga and the same gate, both gated models have zero likelihood. With the gate set at the onset (0.80 Ga) and animals at 0.60-0.75 Ga, pacing against ungated is 5.7-8.3 and pacing against gated hard steps is 0.66-0.96.
- Fix: Cite Durbin et al. 2026. Lead with the date-marginalised values (3.8-5.0), or define the gate as the onset of oxygenation and show this sensitivity. The conclusion that pacing and gated hard steps cannot be separated is unaffected.
- minor. 'Table 3 matches the same reading' is
overstated.
- Evidence: Under the e^-k reading the recomputed bounds are systematically 0.1-0.2 dex above the published ones (4.9 against 4.8, 2.55 against 2.4, 2.0 against 1.8, 0.75 against 0.6). Under the literal reading they are 0.9-3.5 dex off, so the e^-k reading is still clearly the better one. Separately, 'their less-than-1% statements survive' is marginal for two steps: the published text says over 90%, the recomputation gives 86-96%.
- Fix: Say 'Table 3 agrees to 0.1-0.2 dex under the same reading'. Call the units finding 'apparent', and add that the authors were not contacted and no erratum was found as of October 2026.
- minor. The entry point does not run on a
memory-constrained machine, contrary to 'reruns in 3.5 minutes'.
- Evidence: a1_kipping.reproduce_2020 evaluates kipping_like on 2,000,000 draws times 200 quadrature nodes in one call. The process was OOM-killed here at about 8 GB resident memory.
- Fix: Evaluate the Monte Carlo in chunks of 100,000 draws. Output is bit-identical, peak memory is 1.9 GB and runtime 233 s.
- minor.
- Evidence:
- Fix: Rewrite as a single clean report, with status complete once the changes above are made.
- minor. 'The data add at most 1.3 bits' is a coarse
estimate.
- Evidence: The figure is the Kullback-Leibler divergence of the f_bio marginal on 40 prior-quantile bins, with an atom at f_bio = 1. Binning can only lower it.
- Fix: Say 'about 0.4-1.3 bits on a 40-bin estimate'.
- minor. Two of Kipping's ten 2020 numbers
(Jeffreys-prior odds for rare intelligence) still do not reproduce and
the cause is unknown.
- Evidence: I get 1.545 and 1.490, as the analyst does; published values are 1.638 and 1.572. Mixed-prior variants give 1.41-1.56. Not load-bearing for any conclusion.
- Fix: Keep it reported as unexplained; do not imply an error in Kipping's paper.
Overclaims
- Headline: 'across the 38 LUCA ages ... it ranges from 4.6 to 942'. The upper end is a division-by-near-zero artefact from one node copy 2.8 Myr from the assumed start date.
- Headline and Result 1: 'the ceiling is about T/((m+1) t_L')' and 'the largest Bayes factor any pair of rate hypotheses can reach'. True only if every later step is hard; otherwise the factor reaches about 19-26.
- Implications: 'likelihood ratio about 5-15' for fast abiogenesis. The analyst's own tables span about 3 (Moon-impact start, five hard steps) to about 22 (pacing, deadline today), and 1.5-2.9 with accepted fossils only.
- Implications: 'f_bio above 0.99 is disfavoured about 10:1' and 'data-driven: values of f_bio near 1 are disfavoured'. This holds only in constant-rate step models (6-10:1 in the two-step model); the pacing family carries no such penalty.
- Headline and implications: f_bio 'spans roughly 18 orders of magnitude' as a prior-family choice. True only under conditioning on success; without it all step families give medians of -0.2 to -0.7.
- Result 1: 'calibrations alone put LUCA at 4.43 (4.26-4.51) Ga'. That is the cross-braced prior; the non-cross-braced prior is 4.00 (3.47-4.43) Ga.
- Result 3: 'Abiogenesis does not [have a long expected time]: 0.06-0.12'. This follows from the 1e-14 Ga lower prior bound; it is 0.16-0.53 for lower bounds of 1e-4 to 0.1 Ga.
- Result 3: 'The nine prior weights and Table 3 match the same reading'. Prior weights match to three digits; Table 3 only to 0.1-0.2 dex with a systematic offset.
- Implications: 'published timing-based claims of extreme rarity are weaker than printed'. The evidence concerns two sentences and one table in one paper; that paper's qualitative conclusion (most posterior weight below 1%) stands, and the authors have not been contacted.
- Novelty item (v): the absence of a lower bound on f_bio is presented as new; Snyder-Beattie et al. 2021 and Carter 1983 already state it.
- Headline: 'the data add at most 1.3 bits'. This is a coarse 40-bin estimate for one marginal, not a bound.
- Method summary: 'rerun in 3.5 minutes'. The unmodified entry point needs more than 8 GB of memory and was OOM-killed here.
Novelty check
Novel: partly. Three of the five claimed novelties hold up, two do not.
Holds up:
- (iii) The apparent natural-log/base-10 slip in Snyder-Beattie et al.'s Tables 2-3 appears to be new and is the most notable finding. I confirmed it with independent code and a hand calculation of the prior weights, and found no erratum or published comment in web and arXiv searches.
- (ii) Evaluating Kipping's factor across the Moody et al. repository variants, and the 0.3-0.5 Gyr gap between the two LUCA copies without cross-bracing, is a new and useful compilation.
- (iv) I found no earlier formal likelihood comparison of ungated hard steps, gated hard steps and Mills-style pacing. It is a toy comparison with gates chosen after the fact, as the analyst says.
Does not hold up as stated:
- (i) The closed-form B(m) is correct, and I found no paper stating it as a correction to Kipping's limit. But it is an immediate corollary of hard-steps order statistics (the first of n hard steps is expected at T/(n+1)), the same arithmetic behind the published inference of about 12.5 steps from the abiogenesis delay that the analyst's own code attributes to Hanson et al. 2021. Describe it as a corollary applied to Kipping's claim.
- (v) That the timeline sets no lower bound on f_bio is not new. Snyder-Beattie et al. state that posterior probability levels off at a non-zero value as transition times go to infinity, and Carter 1983 and Spiegel and Turner 2012 make the same point. Only the profile-likelihood presentation is new.
Overall this is a clean reproduction and synthesis with one new erratum-grade finding and two modest extensions.
- Carter 1983 and 2008; Hanson 1998: hard-steps order statistics
- Hanson, Martin, McCarter and Paulson 2021, arXiv:2102.01522: number of hard steps inferred from Earth durations (the 12.5-step figure is as quoted in the analyst's code; I read only the abstract)
- Spiegel and Turner 2012, arXiv:1107.3835: prior dominance of the early-life inference
- Kipping 2020, arXiv:2005.09008, and Kipping 2025, arXiv:2504.05993: lower limit T/(2 t_L') with respect to the intelligence rate
- Snyder-Beattie, Sandberg, Drexler and Bonsall 2021, Astrobiology 21:265: multi-step Bayesian model; states the non-zero likelihood plateau
- Whitmire 2025, arXiv:2503.18217: argues our existence is evidence for fast abiogenesis (not cited in the report)
- Balbi and Lingam 2023, arXiv:2305.05395: weak, prior-dominated lower bounds on abiogenesis probability
- Mills, Macalady, Frank and Wright 2025, arXiv:2408.10293: pacing alternative, no formal likelihood
- Watson 2025, Phil Trans R Soc B 380:20240105: hard steps with fixed delays
- Durbin et al. 2026, Science Advances, doi:10.1126/sciadv.aeg6289: animal origin about 800-700 Ma (not cited in the report)
Required changes
- Headline and key numbers: delete '4.6 to 942'. Quote the date-marginalised factors (13.3 for the paper-main LUCA runs, 12.8 for all 38 variants pooled) and the share of variants above 10 (87% for a 4.404 Ga start, 55% for 4.51 Ga).
- Headline, Result 1 and Fig. 2b: replace 'ceiling' and 'largest Bayes factor any pair of rate hypotheses can reach' with 'value when all m later steps are hard, T/((m+1) t_L'), which replaces Kipping's lower limit'. Add that it rises to about 19 (exact-time data) or 26 (Kipping's interval likelihood) if the later step is not hard, and is 21.6 for pacing with a deadline today.
- Implications: change 'likelihood ratio about 5-15' to the full range with conditions (about 3-22 with the 4.2 Ga LUCA date; 1.5-2.9 with accepted fossils only).
- Method, f_bio table and Implications: add an explicit statement of the anthropic assumption (likelihood conditioned on success). Add a sensitivity row showing that without the division the posterior medians of log10 f_bio are about -0.2 (B2), -0.4 (B3), -0.5 (C4) and -0.7 (C5). Cite Whitmire 2025 and Baak and Snoek 2026 as the opposing view, and warn the integrator not to combine these quantiles with a self-indication treatment.
- Implications and Result 5: qualify 'f_bio above 0.99 is disfavoured about 10:1' as 'within constant-rate step models, 6-10:1 (two-step model, window +1.73 or +0.9 Gyr)', and state that pacing family A carries no such penalty.
- Result 1: give both calibration-only priors for LUCA: 4.43 (4.26-4.51) Ga cross-braced and 4.00 (3.47-4.43) Ga non-cross-braced. Note that the root posterior, 4.50 (4.45-4.52) Ga, sits against the 4.52 Ga hard maximum.
- Result 3, last sentence: add the dependence of the 0.06-0.12 figure on the lower prior bound (0.05 at 1e-14 Ga, 0.16 at 1e-4, 0.30 at 1e-2, 0.53 at 0.1 Ga) and label it prior-driven.
- Result 3: call the Snyder-Beattie units finding 'apparent', and state that the authors were not contacted and no erratum was found as of October 2026. Change 'Table 3 matches' to 'agrees to 0.1-0.2 dex'. Note that their two-step 'over 90% below a 1% chance' becomes 86-96%.
- Result 4 and events table: cite Durbin et al. 2026 (Science Advances, doi:10.1126/sciadv.aeg6289; animal origin about 800-700 Ma). Lead with the date-marginalised Bayes factors (3.8-5.0), or define the Neoproterozoic gate as its onset (0.80 Ga) and show the sensitivity (pacing against ungated 5.7-8.3; pacing against gated 0.66-0.96). State that the central-date value depends on a 35 Myr ordering.
- Novelty section: drop item (v) as new and credit Snyder-Beattie et al. 2021 and Carter 1983 for the plateau. Describe item (i) as a corollary of hard-steps order statistics applied to Kipping's limit.
- code/a1_kipping.py, reproduce_2020: evaluate the 2,000,000-draw Monte Carlo in chunks of 100,000 so the entry point runs in under 2 GB. Correct the runtime claim to about 4 minutes.
- Headline: change 'the data add at most 1.3 bits' to 'about 0.4-1.3 bits on a 40-bin estimate'.
- Keep the 6% discrepancy with Kipping's two Jeffreys-prior intelligence odds reported as unexplained; the referee obtained the same 1.545 and 1.490.