Where is everybody? · Working papers
Red dwarfs and the question of whether we are early
Revised after a second, separate analysis run for this project tried to break it. Neither analysis is an outside expert.
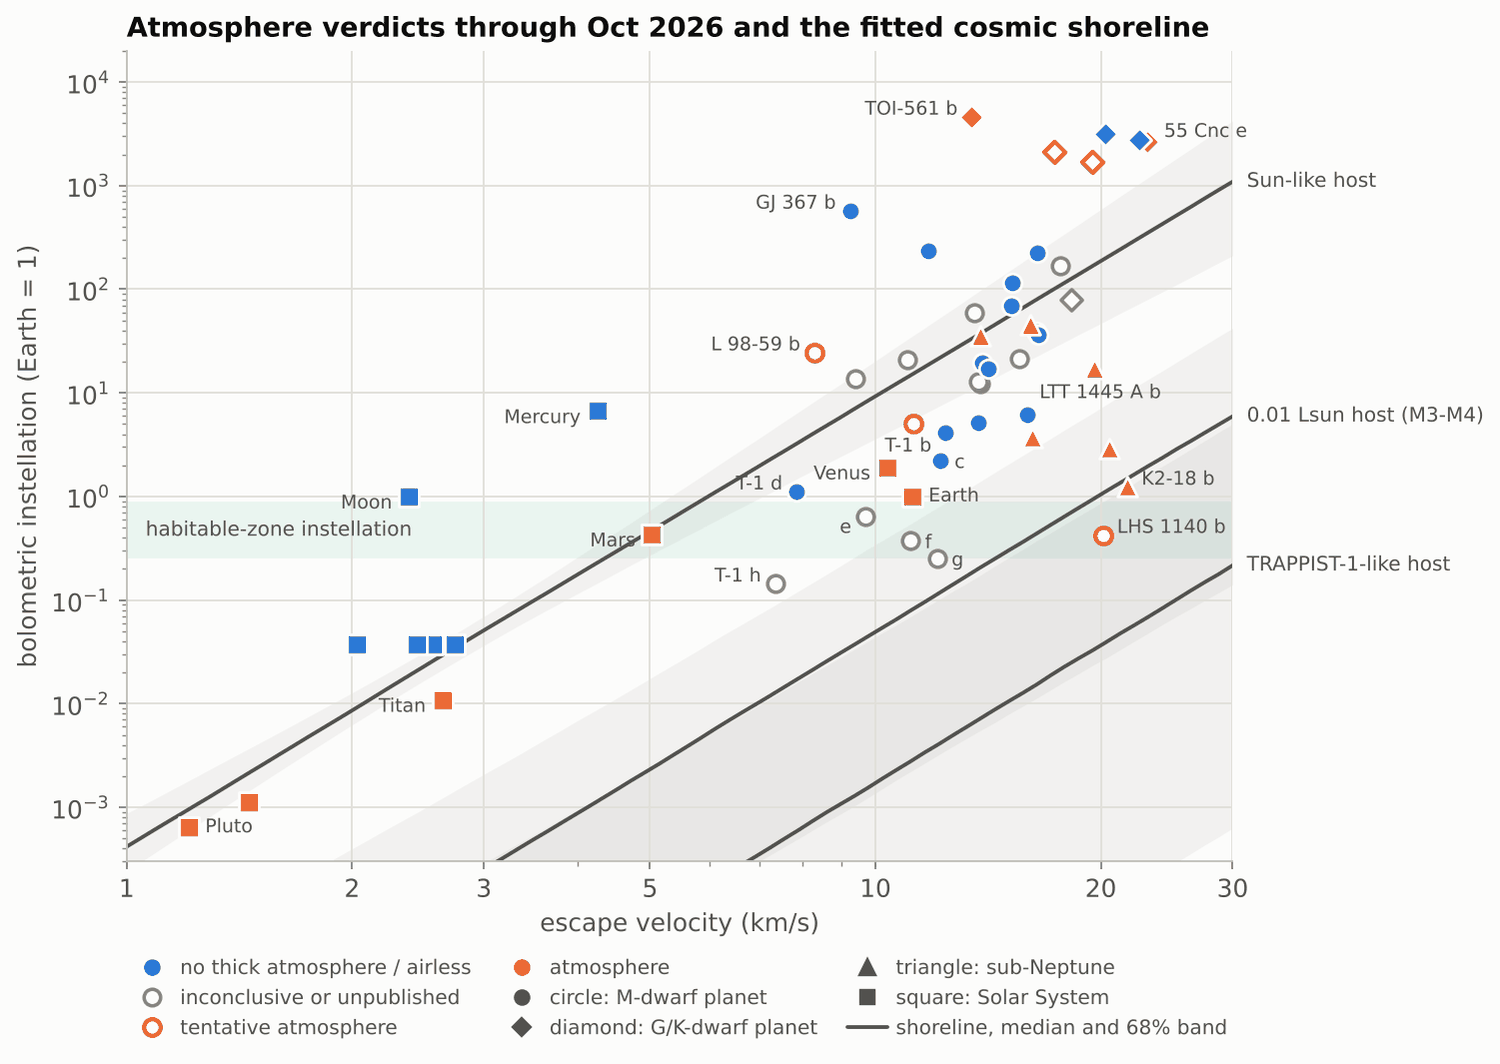
The first-pass headline survives only in conditional form. Through October 2026, 0 of 14 rocky M-dwarf planets with a decisive JWST/Spitzer verdict (12 host stars) have a thick atmosphere (95% upper limit 0.18; 0.38 if three ambiguous results are counted as atmospheres), but none is in the habitable zone and habitable-zone retention is unconstrained (0.09-0.68 across shoreline fits, about 0.98 in a published evolution model for TRAPPIST-1 e/f).
Summary
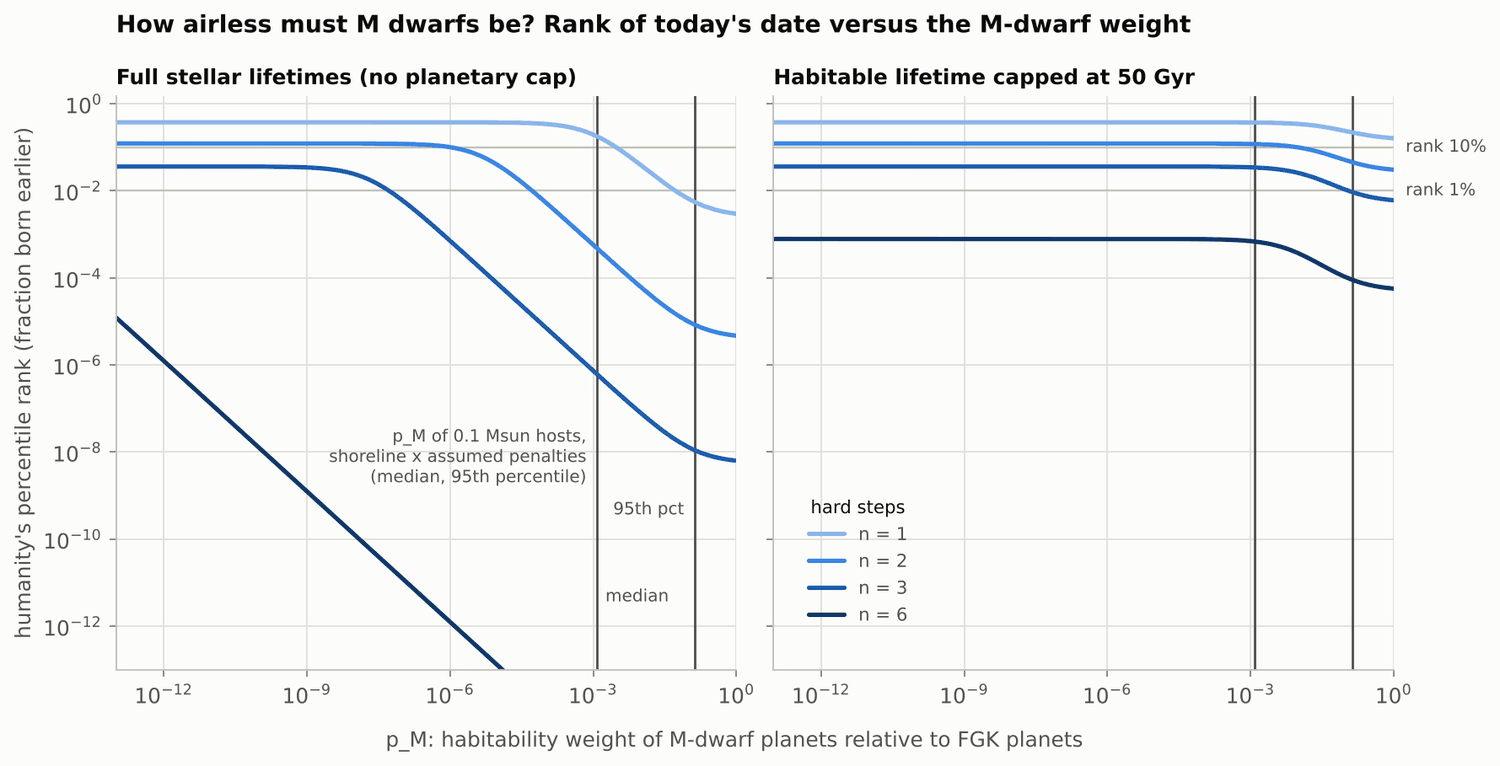
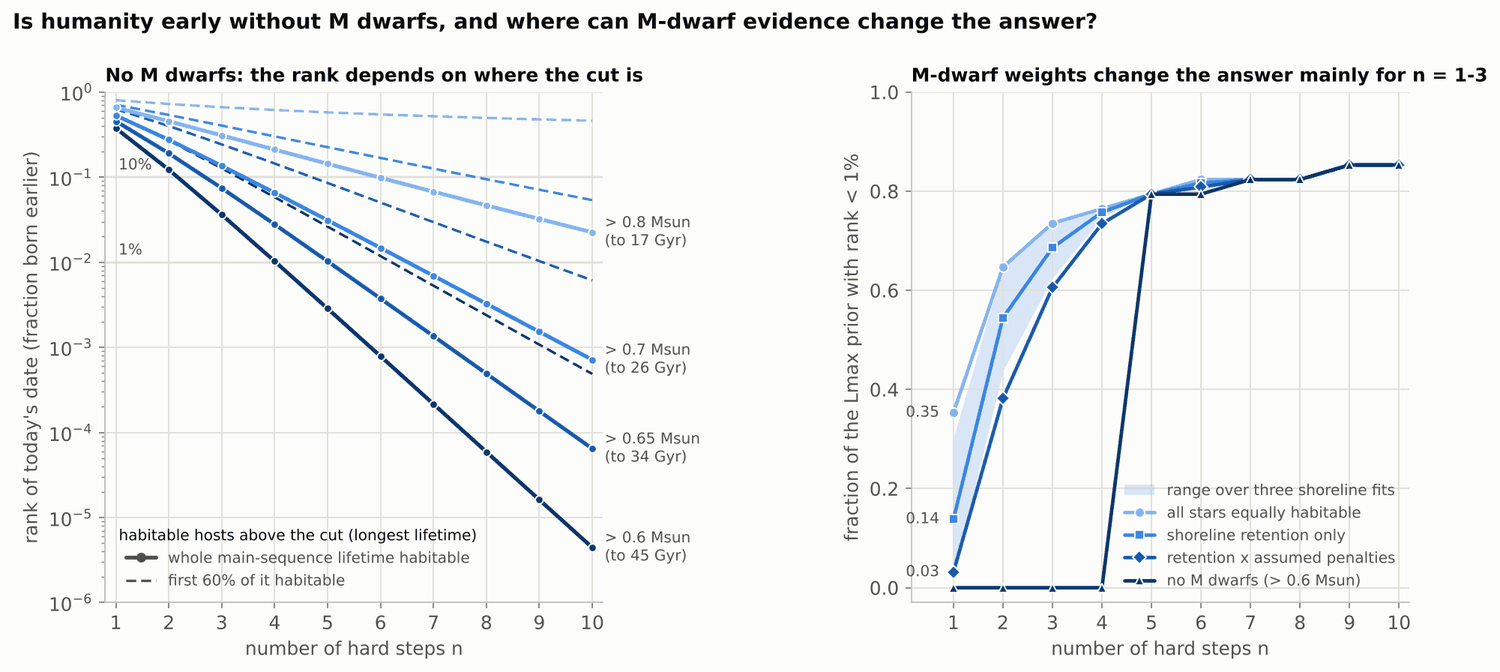
The first-pass headline survives only in conditional form. Through October 2026, 0 of 14 rocky M-dwarf planets with a decisive JWST/Spitzer verdict (12 host stars) have a thick atmosphere (95% upper limit 0.18; 0.38 if three ambiguous results are counted as atmospheres), but none is in the habitable zone and habitable-zone retention is unconstrained (0.09-0.68 across shoreline fits, about 0.98 in a published evolution model for TRAPPIST-1 e/f). With star-limited habitable lifetimes, humanity's rank reaches 1% only if M-dwarf planets are down-weighted to p_M < 0.053 (one hard step), 5.3e-5 (two) or 5.3e-8 (three), so an atmosphere census can remove the earliness only near n = 1: there the fraction of the maximum-lifetime prior range with rank < 1% falls from 0.35 to 0.14 with the JWST-informed shoreline alone (0.02-0.30 across fits) and to 0.03 only with assumed water and flare penalties. Whether humanity is early without M dwarfs depends on the K-dwarf cut (rank at n = 4: 1.03%, 2.8%, 6.6%, 21% for hosts above 0.6, 0.65, 0.7, 0.8 Msun), and with a 10 Gyr habitable-lifetime cap humanity is not early (rank 42-71%). The earlier figures "0.75 to 0.64", "n >= 4" and "decisive for n = 1" are withdrawn.
Key numbers
| Quantity | Value | Uncertainty | Note |
|---|---|---|---|
| Rocky M-dwarf planets with a decisive verdict that have a thick (roughly >= 1-10 bar or CO2-rich) atmosphere | 0 of 14 (12 host stars) | 95% upper limit 0.18 (uniform prior), 0.13 (Jeffreys); 0/7 below 25 S_Earth (0.31); 0/13 emission-only (0.19); 0/12 per host (0.21); 3/17 if ambiguous results are counted as atmospheres (0.38) | Conditioned on outcome: tentative, anomalous and inconclusive cases are excluded by definition. Coolest decisive planet 1.1 S_Earth, median 28; none in the habitable zone. Thin N2/O2 atmospheres up to about 1 bar are not excluded for several. Census: 41 planets (26 rocky + 2 volatile-rich M-dwarf, 7 G/K, 6 sub-Neptune anchors), 111 arXiv records. |
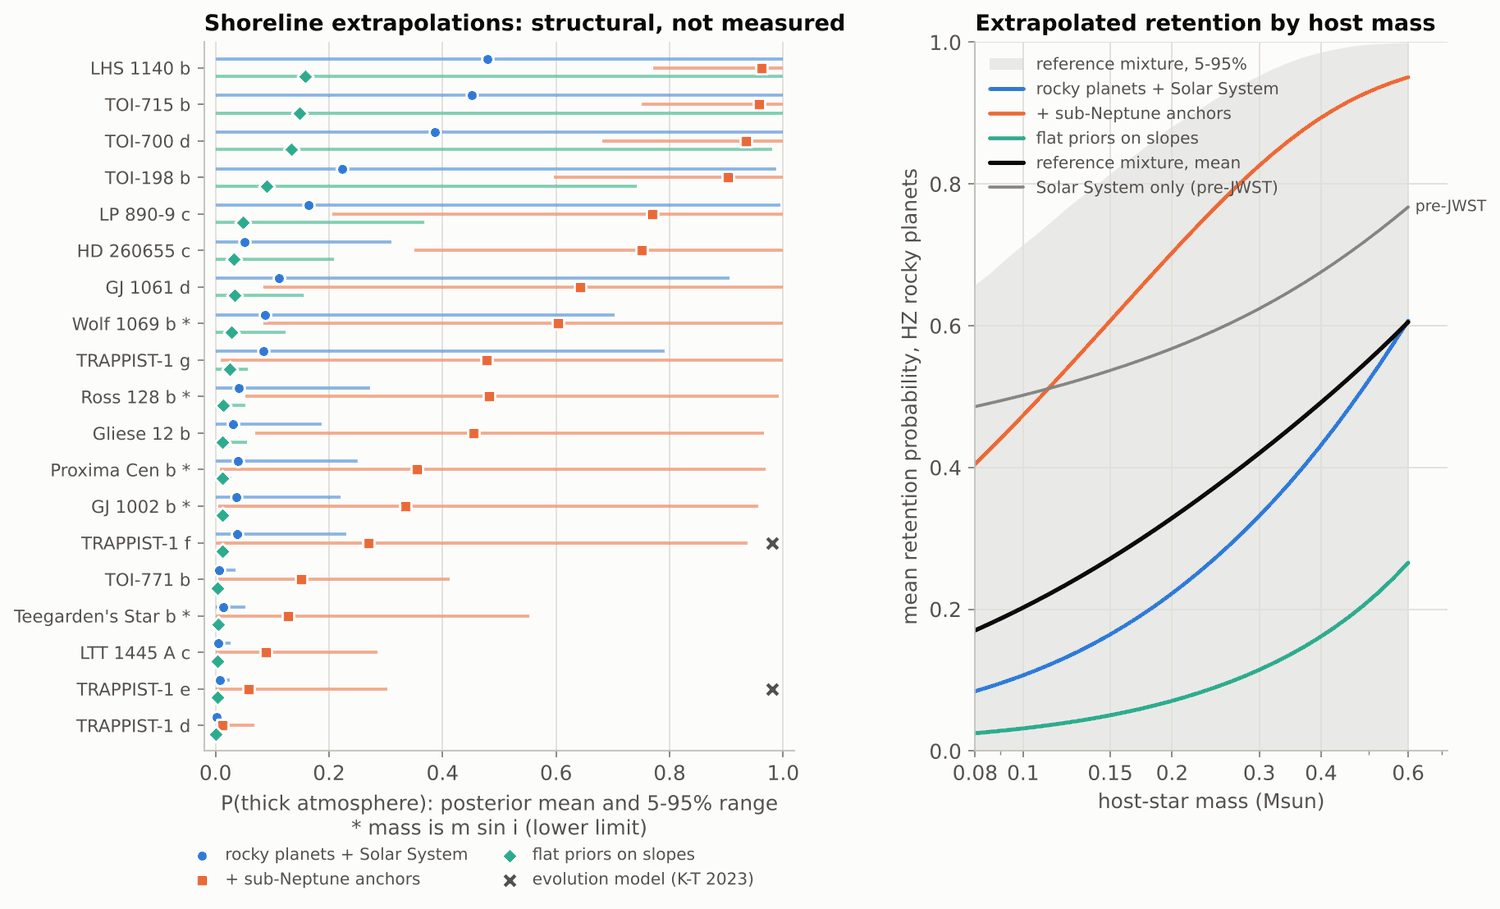
| Habitable-zone thick-atmosphere retention for rocky M-dwarf planets (IMF-averaged, shoreline extrapolation) | unconstrained: 0.09 to 0.68 across defensible fits | 0.25 baseline, 0.68 with sub-Neptune anchors, 0.09 flat slope priors; 0.09-0.45 across q priors; 0.58 Solar System only; evolution model for TRAPPIST-1 e/f about 0.98 | The equal-weight 'reference mixture' (mean 0.34, 5-95% 0.00-0.85) is a bracket for propagation, not an estimate. A floor of 1e-3 is applied to extrapolated retention. |
| Shoreline slopes, baseline fit (N = 38) | p = 4.3 (escape velocity); q bounded from below only: q > 0.4-0.8 at 95% | p 3.7-4.9 (16-84%); q median 0.74 to 2.79 depending on the prior | p differs from Berta-Thompson et al. 2025 (5.9 +0.61/-0.43); 5.3-5.4 when sub-Neptunes or lava worlds are added. The earlier 'q agrees with 1.17' claim is withdrawn. |
| P(thick atmosphere) for TRAPPIST-1 e / LHS 1140 b from single-plane shoreline fits | 0.003-0.06 / 0.16-0.96 | structural, not a measurement | Conflicts with the ~98% retention for TRAPPIST-1 e/f in Krissansen-Totton 2023 (arXiv:2306.05397), itself an untested model. Retention for TRAPPIST-1 e is unknown. |
| Critical M-dwarf weight p_M for rank >= 1% with star-limited habitable lifetimes | 0.053 (n=1); 5.3e-5 (n=2); 5.3e-8 (n=3) | 0.03-0.14, 2.7e-5 to 1.8e-4, 3e-8 to 2.5e-7 across host-mass cuts 0.5-0.8 Msun and habitable windows 100%/60% | Rank with p_M = 1: 0.30%, 4.7e-6, 6.3e-9. With Lmax = 1000 Gyr: not early at n=1, 1.3e-3 (n=2), 9.4e-6 (n=3). No value quoted for n >= 4 (knife-edge at n = 4). |
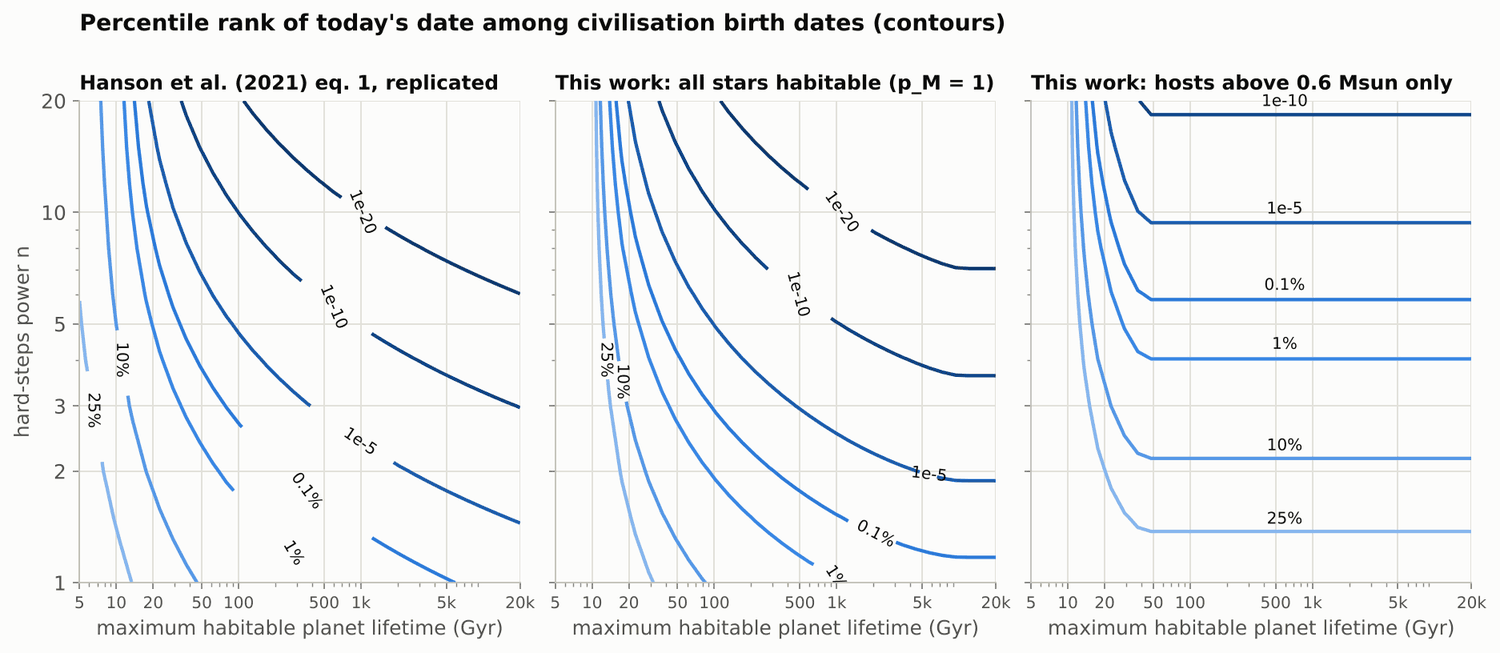
| Humanity's rank with M dwarfs excluded, unlimited Lmax, by host-mass cut | n=4: 1.03% (>0.6 Msun), 2.8% (>0.65), 6.6% (>0.7), 21% (>0.8); n=6: 0.079%, 0.37%, 1.5%, 9.8% | with only 60% of the main-sequence lifetime habitable, n=4: 5.8%, 14%, 30%; n=6: 1.2%, 5.0%, 17%. Smallest n with rank < 1%: 5, 6, 7, none (full window); 7, 10, none (60% window) | At a 0.6 Msun cut, 0.60-0.65 Msun stars supply 70% (n=4) and 83% (n=6) of all civilisations. Confirms Hanson et al. (their eq. 1 at 45 Gyr gives 0.76% at n=4). |
| Humanity's rank with habitable lifetime capped at 10 Gyr, all stars | 71% (n=1), 56% (n=3), 47% (n=6), 42% (n=10) | Not early under the Madau-Dickinson history. A cap alone leaves our G-type host unexplained: the likelihood of our datum is 7.6-9.4 times higher without M dwarfs. | |
| Prior-weighted fraction of the Lmax range with rank < 1%, one hard step (n = 1) | 0.35 (p_M=1) -> 0.21 (Solar-System-only shoreline) -> 0.14 (JWST shoreline alone) -> 0.03 (with assumed penalties) | JWST shoreline alone: 0.02-0.30 across the three fits; assumed penalties alone give 0.15 | Not a posterior. Lmax log-uniform 5-20,000 Gyr. |
| Prior-weighted fraction of (n, Lmax) space with rank < 1%, n uniform 1-10 | 0.747 (p_M=1); 0.709 (JWST retention only); 0.671 (with assumed penalties); 0.494 (no M dwarfs, >0.6 Msun); 0.332 (>0.7 Msun) | retention only 0.68-0.74 across fits; floor 0 / 1e-3 / 1e-2 gives 0.644 / 0.671 / 0.682 with penalties; SFH variants 0.66-0.78; Lmax 5-100 Gyr prior gives 0.37 / 0.35 / 0.34 / 0.30 | Bounded to 0.49-0.75 by construction: the M-dwarf weight can matter in only 25% of grid cells; 82% of the Lmax prior lies above 20 Gyr. |
| Prior-averaged rank (uniform n, default Lmax prior) | 0.093 (p_M=1); 0.102 (JWST retention only); 0.112 (with penalties); 0.135 (no M dwarfs) | For fixed parameters the rank equals the likelihood ratio of no-deadline to deadline-just-after-today; JWST changes the average by a factor 1.1-1.2. | |
| Conditioning on our own datum (t0, 1 Msun host, 4.54 Gyr planet) in the no-deadline model | posterior P(Lmax <= 10 Gyr) = 0.91, P(Lmax <= 20 Gyr) = 0.97, P(rank < 1%) = 0.001 for p_M = 1 | evidence relative to p_M = 1: 4.1 (JWST retention only), 5.0 (penalties only), 7.0 (both), 9.0 (no M dwarfs); for n = 1: 6.0, 5.8, 11, 17 | Depends on the 5 Gyr lower edge of the Lmax prior and a reference class of all civilisations; a deadline cancels this update (Hanson's reply to Cook 2022). |
| Rank with JWST-informed weights, star-limited lifetimes, n = 1 | 1.5% (retention only); 8.7% (with assumed penalties) | 5-95%: 0.35-20%; 0.6-37% | For n = 2 the 95th percentile is below 0.1% (retention only) or 2.3% (with penalties). |
| Value of future verdicts on TRAPPIST-1 e, f, g and LHS 1140 b | habitable-zone retention by fit 0.03-0.49 (all airless) or 0.68-0.82 (atmospheres on e, f, LHS 1140 b) | n = 1 fraction 0.09 or 0.31 (retention only); uniform-n fraction 0.70 or 0.74 | Hypothetical refits of the three shoreline models. |
| Replication of Hanson et al. (2021) eq. 1 | max rank over their panels 10.7%, 9.9%, 8.4%, 12.1% | their quoted bounds: <10.6%, <10%, <8.4%, <12.4% | Their eq. 1 with a 4 Gyr star-formation peak gives 73/58/46/40% at a 10 Gyr cap (mine 71/56/47/42%) and 30/9.2/2.7/0.76/0.06% at 45 Gyr (mine 38/12/3.6/1.03/0.079%). |
Data used
- NASA Exoplanet Archive pscomppars via TAP (https://exoplanetarchive.ipac.caltech.edu/TAP/sync), re-downloaded 2026-10-12: 59 rows for named planets, 237 small M-dwarf planets (163 hosts used for the mass-luminosity fit); snapshots in data/nea_snapshot_*.csv
- Hand-curated atmosphere outcomes from the literature (code/curated_outcomes.py -> data/rocky_atmosphere_census.csv, 41 planets), with 111 arXiv records verified through the arXiv API (data/citations_verified.csv); six references added in revision for the Part 2c synthesis
- MAST Rocky Worlds DDT HLSP page (https://archive.stsci.edu/hlsp/rocky-worlds), checked 2026-10-12, for programme status only
- Solar System bodies (12) as shoreline anchors, values in code/curated_outcomes.py
- Published functional forms: Madau & Dickinson 2014 (arXiv:1403.0007), Sobral et al. 2013 (arXiv:1202.3436), Behroozi & Peeples 2015 (arXiv:1508.01202), Kroupa 2001 and Chabrier 2003 IMFs, main-sequence lifetime law as in Loeb et al. 2016 (arXiv:1606.08448), Hanson et al. 2021 eq. 1 (arXiv:2102.01522)
- Web pages read for the novelty section: Cook 2022 (longtermrisk.org) and Hanson's reply (overcomingbias.com)
Method
Part 1: planet and host parameters from the NASA Exoplanet Archive (TAP) joined to a hand-curated table of published JWST/Spitzer verdicts with base, pessimistic and optimistic soft labels for a thick atmosphere. Part 2: beta-binomial posteriors for several samples (decisive, below 25 S_Earth, emission-only, per host, with ambiguous cases); soft-label Bayesian logistic 'cosmic shoreline' regression in instellation, escape velocity and stellar luminosity (adaptive Metropolis, 16 tabulated fits including five q priors, R-hat <= 1.004); extrapolation to habitable-zone rocky planets by host mass, with a floor of 1e-3 on retention; subjective p_M = retention x f_water x f_other, every result given with and without the two assumed factors. Part 3: civilisation birth-date distribution from cosmic star-formation history, IMF, main-sequence lifetimes and the hard-steps a^n law; rank of today against n, maximum habitable lifetime, host-mass cut, habitable window and p_M; closed-form critical p_M; prior-weighted fraction of (n, Lmax) space with rank below 1% or 10%, shown by n; prior-averaged rank; likelihood of our own datum with the resulting posterior over (n, Lmax) and evidence per M-dwarf scenario; replication of Hanson et al. eq. 1; sensitivity to star-formation history, IMF, floor and two hypothetical future JWST outcomes. Single entry point code/run_all.py (about 3.5 minutes; --refresh re-downloads; --offline uses data/ snapshots). The final run was checked three ways: a fresh download, cached raw files and offline snapshots, the last two giving byte-identical data files. The mass quadrature agrees with direct scipy quadrature to 0.4%.
Closest prior work and what is new
Closest prior work. Hanson, Martin, McCarter & Paulson 2021 (arXiv:2102.01522), whose abstract already states that >99% of advanced life appears after today unless n < 3 and maximum planet duration < 50 Gyr; T. Cook 2022, 'Replicating and extending the grabby aliens model' (https://longtermrisk.org/replicating-and-extending-the-grabby-aliens-model/), who put priors on n and Lmax and updated on our datum, with Hanson's reply; Kipping 2025 'Solar Hegemony' (arXiv:2510.01215) and Kipping 2021 (arXiv:2106.11207); Haqq-Misra et al. (arXiv:1705.07813); Loeb et al. 2016 (arXiv:1606.08448); Berta-Thompson et al. 2025 (arXiv:2507.02136), Ih et al. 2025 (arXiv:2508.08253), Park Coy et al. 2024 (arXiv:2412.06573) and Kreidberg et al. 2025 (arXiv:2507.00933) for the census and shoreline.
What is new. (i) The table of critical M-dwarf weight p_M against the number of hard steps (0.053, 5.3e-5, 5.3e-8 for n = 1, 2, 3) with a physical IMF and stellar lifetimes, and its robustness to the host-mass cut and habitable window; (ii) an explicit link from a JWST atmosphere census, through a host-mass-dependent retention, to the earliness calculation, with the census, the assumed penalties and the priors separated; (iii) the dependence of the M-dwarf-free rank on the K-dwarf cut and habitable window, with the share of weight by mass bin; (iv) the effect of hypothetical TRAPPIST-1 e/f/g and LHS 1140 b verdicts. Not new: the census conclusion, the shoreline form, 'K dwarfs suffice' and 'not early with a 10 Gyr cap' (both confirm Hanson et al.), and the self-datum update (Cook 2022).
Confidence that it is new: medium
Limitations
- The observed planets are hot and chosen for observability; no habitable-zone rocky planet has a decisive verdict. Habitable-zone retention is an extrapolation that follows the prior on the luminosity slope q and the choice of anchors (0.09-0.68).
- Soft labels are my subjective reading of abstracts and concern thick or CO2-rich atmospheres; thin atmospheres are largely untested. The '0 of 14' sample is conditioned on outcome.
- The reference mixture averages three modelling choices and is not an estimate. The retention floor of 1e-3 is a judgement (0 and 1e-2 shown).
- f_water (log-uniform 0.05-1) has only a model-based lower bound and f_other (log-uniform 0.1-1) is arbitrary; results are given with and without them. The 'pre-JWST' comparator is constructed, not historical.
- The earliness model has a step in habitability at one host mass, one equally weighted planet per star, no metallicity or galactic evolution, and an unsaturated a^n hard-steps law (equivalent to assuming a very large Lmax). Results for n >= 4 depend on late-K dwarfs staying habitable for 26-45 Gyr.
- The prior-weighted fractions are not posteriors and depend on the priors for n and Lmax. The self-datum posterior depends on the 5 Gyr lower edge of the Lmax prior and on a reference class of all civilisations ever born.
- Future star formation differs by more than two orders of magnitude between cited extremes; under the Behroozi & Peeples upper bound the rank is below 10% even at Lmax = 10 Gyr.
- Rocky Worlds DDT: public JWST eclipses exist only for GJ 3929 b, TOI-771 b and LHS 1140 b, and only GJ 3929 b has a published verdict; TRAPPIST-1 g and h are unpublished. Six prediction targets have m sin i masses (lower limits).
What it means for the Fermi question
The 'we are early, so there must be a deadline' argument needs two things: several hard steps, and habitable lifetimes far beyond 10-20 Gyr for a non-negligible share of planets. JWST bears only on the second, only for M dwarfs, and only through one of several habitability factors. The suppression needed to remove the earliness (p_M below 5e-5 for two hard steps) is far beyond what an atmosphere census can establish, so the evidence to date weakens the need for a deadline explanation only if there is a single hard step. Marginalised over my priors the effect is small: the prior-weighted early fraction moves from 0.75 to 0.71 (0.68-0.74 across fits), the prior-averaged rank by 10-20%, and the evidence for a no-deadline model given our own datum by a factor of about 4 out of a possible 9. For four or more hard steps the question is whether late-K dwarfs stay habitable for 26-45 Gyr, which no current observation tests. If habitable lifetimes are capped near 10 Gyr, the measured star-formation history makes humanity typical with no deadline needed, although the cap leaves our G-type host unexplained by a factor of about 8. Verdicts on TRAPPIST-1 e/f/g and LHS 1140 b would fix the retention factor (0.03-0.49 against 0.68-0.82) but move the uniform-n fraction only between 0.70 and 0.74; evidence on the number of hard steps and on how long K-dwarf planets stay habitable would matter more.
Changes made after the referee report
- Headline rewritten: the n = 1 result is decomposed into shoreline alone (0.35 -> 0.14, 0.02-0.30 across fits), assumed penalties alone (0.15), and both (0.03); 'decisive' dropped; the first-pass figures '0.75 to 0.64' and 'n >= 4' are withdrawn as headline claims.
- K-dwarf claim made conditional: new table of M-dwarf-free rank against host-mass cut (0.6, 0.65, 0.7, 0.75, 0.8 Msun) and habitable window (100%, 60%) for n = 1-10, smallest n with rank < 1% per cut, and share of weight by mass bin (data/rank_noM_cut_window.csv, data/noM_weight_shares.csv); the 'critical p_M = 4.2e-12 at n = 4' figure deleted and knife-edge cases blanked in rank_table.csv.
- 'Posterior probability' relabelled as a prior-weighted fraction of (n, Lmax) space throughout, including file names (early_fraction_*.csv); shown by n; the 0.49-0.75 bound and the 82% of Lmax prior above 20 Gyr stated; prior-averaged rank added.
- New analysis conditioning on our own datum (birth date, 1 Msun host, 4.54 Gyr planet age): likelihood on the (n, Lmax) grid, posterior over Lmax and evidence ratios per M-dwarf scenario (data/self_datum_likelihood.csv), citing Cook 2022, Hanson's reply and Kipping 2025.
- Shoreline: q-prior sensitivity fits added (data/shoreline_q_prior_sensitivity.csv); q reported as a lower bound; 'agrees with Berta-Thompson' withdrawn; discrepancy in p (4.3 against 5.9) reported; habitable-zone retention described as unconstrained (0.09-0.68) and the pooled value relabelled a reference mixture, not an estimate.
- Floor of 1e-3 imposed on extrapolated retention (mixture form), with 0 and 1e-2 as sensitivities.
- Census statement reworded: 0/14 and 3/17 quoted together, with 12 hosts, 7 below 25 S_Earth, 13 emission-only (without TRAPPIST-1 d) and none in the habitable zone; soft labels redefined as thick or CO2-rich atmospheres, with thin atmospheres stated as not excluded.
- New robustness table for critical p_M across host-mass cuts 0.5-0.8 Msun and both habitable windows (data/critical_pM_cut_window.csv).
- Mass quadrature corrected (mid-point cells, fractional weights at host-mass cuts): ranks moved by 2% at n = 4, up to 7% without M dwarfs and 12% with all stars at n = 10; now within 0.4% of direct quadrature and consistent with the referee's independent values.
- Small fixes: m sin i masses flagged as lower limits in tables and Figure 2; Rocky Worlds data status corrected against the MAST page; figure panel relabelled 'one hard step'; Figure 5 replaced (rank by cut and window; early fraction by n); Figure 2 shows the evolution-model value for TRAPPIST-1 e/f; six references added and verified through the arXiv API.
Referee points not accepted
- Removing P(TRAPPIST-1 e) (partly rejected): it is no longer a key number, but the per-planet extrapolations stay in the tables and Figure 2 beside the evolution-model 0.98, because that contrast is what future data will test. The 98% figure is a model output conditional on volatile-rich formation (its abstract says all planets may have formed volatile-poor), not an observation, so it cannot overrule the fit; the stated conclusion is that retention for TRAPPIST-1 e is unknown.
- Not quoting the pooled 0.34 (partly rejected): a distribution has to be propagated to Part 3, so the equal-weight mixture is kept, labelled as a bracket and not an estimate, with per-fit results (0.09, 0.25, 0.68) and their consequences shown beside every mixture number.
- The strongest objection's claim that the 'JWST matters only modestly' conclusion is produced by modelling choices (partly rejected): the specific numbers were and are withdrawn, but the scaling behind the conclusion is robust. The critical p_M varies only by a factor of about 5 across host-mass cuts of 0.5-0.8 Msun and habitable windows of 100% and 60% (n = 1: 0.03-0.14; n = 2: 2.7e-5 to 1.8e-4; n = 3: 3e-8 to 2.5e-7), so atmosphere evidence cannot remove the earliness for n >= 2 with star-limited lifetimes whatever the cut.
- Re-coding the soft labels (not done): the referee asked for a statement, not re-coding. The labels were redefined as probabilities of a thick or CO2-rich atmosphere and the optimistic-label fit (retention 0.37) is reported as the sensitivity case.
Figures
Code
Every number above is produced by these scripts from public data. The data tables themselves are not hosted here; the scripts download them.
build_table.py common.py curated_outcomes.py earliness.py fetch_data.py figures.py inference.py plotstyle.py run_all.py
Referee report
A second, separate analysis re-ran the code, recomputed the main numbers by its own route and tried to break the result. Like the first, it was run by Claude for this project; it is not an outside expert. In its report “the analyst” is the first analysis, which wrote the paper, and file names that are not linked on this page are its own working files. The paper above is the version revised in response.
Verdict: sound with fixes. Results reproduced: yes.
Copied code/ to scratch and ran run_all.py --refresh (fresh NASA Exoplanet Archive and arXiv downloads, 2 min 49 s): all 17 data files are byte-identical to the analyst's, and every reported key number matches results_summary.json. Independent recomputation with my own script (astropy Planck18 cosmology, separate quadrature, plus a Monte Carlo over stars) agrees to within about 3%: rank with hosts > 0.6 Msun = 37.6 / 12.2 / 3.62 / 1.02 / 0.078% for n = 1/2/3/4/6 (analyst 37.8 / 12.4 / 3.69 / 1.05 / 0.082%; Monte Carlo 37.6 / 12.2 / 3.62 / 1.01 / 0.080%); rank with a 10 Gyr cap = 71.2 / 47.3 / 42.0% for n = 1/6/10 (analyst 71.2 / 47.4 / 42.1%); critical p_M = 0.053 / 5.3e-5 / 5.3e-8 (analyst 0.052 / 5.1e-5 / 5.1e-8); future/past star formation 0.109 (0.110). Beta-binomial limits (0.181, 0.126, 0.377) and the median instellation (27.9) check out. Hanson et al. quotes were verified against the paper text; Hanson eq. 1 with a 4 Gyr SFR peak gives 34-60% at (n=6, 10 Gyr), consistent with the analyst's 47%. All 105 arXiv IDs resolve; I read 42 abstracts in full (including the 2026 verdict papers for GJ 357 b, GJ 3473 b, GJ 3929 b, TRAPPIST-1 c, LHS 1140 b, HD 3167 b, TOI-431 b) and the quoted values match; the rest were checked by title only. The census join drops or duplicates nothing (59 rows for 59 names).
Strongest objection
The conclusion that JWST matters only modestly, and that K dwarfs suffice for n >= 4, is produced by modelling choices, not by the census: a hard habitability step at exactly 0.6 Msun, K7-M0 stars treated as fully habitable for 30-45 Gyr under an unsaturated t^n law, priors on n and Lmax that put most weight where no M-dwarf evidence can matter, and a habitable-zone retention estimate that is prior-dominated and contradicts published evolution models for TRAPPIST-1 e. Moving the cut to 0.7 Msun or limiting the habitable window to 60% of the main-sequence lifetime raises the n = 4 rank from 1.05% to 6-29%. The conclusion survives only in qualitative, conditional form: a long-lived star's advantage scales as L^n while an atmosphere census can deliver p_M of order 0.01-1, so such evidence removes the earliness only near n = 1; n and the maximum habitable lifetime (including that of late K dwarfs) control the puzzle. The specific numbers (0.75 to 0.64, 'n >= 4', 0.03 at n = 1, P(T-1 e) = 0.02, HZ retention 0.34) do not survive as stated.
Errors found
- major. Headline misattributes the n = 1 result to
the JWST census ('The census is decisive only for few hard steps (n = 1:
0.35 to 0.03)').
- Evidence: Decomposition on the analyst's own grid: p_M=1 0.353; JWST pooled shoreline alone 0.142; f_water x f_other alone 0.144; Solar-System-only shoreline alone 0.221; JWST x penalties 0.032. Across the three pooled shoreline variants the census-only value is 0.024 to 0.305.
- Fix: State: for n = 1, P(rank<1%) falls from 0.35 to 0.14 with the JWST-informed shoreline alone (0.02-0.31 across shoreline variants) and to 0.03 only with the assumed water and flare penalties. Drop 'decisive'.
- major. The claim that K dwarfs alone keep humanity
at about 1% or below for n >= 4 depends on a habitability step at
exactly 0.6 Msun with the full main-sequence lifetime habitable.
- Evidence: Rank at n=4: 1.05% (cut 0.6), 2.8% (0.65), 6.3% (0.7), 21% (0.8); with a 60% habitable window 5.9%, 15%, 29%. At n=6: 0.08%, 0.38%, 1.4%; with 60% window 1.2%, 5.1%, 16%. Stars of 0.60-0.65 Msun (K7-M0) carry 70% of the no-M-dwarf denominator at n=4 and 83% at n=6, while stars at 0.59 Msun are weighted about 0.01-0.04. P(rank<1%) for 'no M dwarfs' under uniform n is 0.49 / 0.41 / 0.33 / 0.00 for cuts 0.6 / 0.65 / 0.7 / 0.8, and 0.33 / 0.08 / 0 / 0 with a 60% window. The analyst's own statistic counts n=4 without M dwarfs as not early in all 34 Lmax cells (1.05% > 1%).
- Fix: Make the claim conditional and show the cut/window table; state where the weight comes from; replace 'n >= 4' with the range of n at which the result holds for each cut; delete the 'critical p_M = 4.2e-12 at n = 4' figure (it exists only because 1.05% exceeds the 1% threshold by 0.05 points).
- major. P(rank<1%) is called a 'posterior
probability' but is a prior-weighted fraction of an (n, Lmax) grid; only
p_M carries data.
- Evidence: The M-dwarf weight can change the outcome in only 25% of grid cells, so the statistic is confined to [0.494, 0.747] whatever JWST finds. By n the no-M-dwarf value is 0,0,0,0,0.79,0.79,0.82,0.82,0.85,0.85 (a step function). 82% of the Lmax prior lies above 20 Gyr. The calculation never conditions on our own datum (G star, 4.6 Gyr planet age), which Cook 2022 and Kipping 2025 show favours small Lmax or a mass cut. Prior-averaged rank E[rank] is 0.093 (p_M=1), 0.114 (JWST), 0.136 (p_M=0): a factor of about 1.2.
- Fix: Relabel as a prior-weighted fraction; present by n; state the bound and the Lmax-prior dependence; add E[rank] or an equivalent likelihood summary; either condition on our own datum or state that this is not done.
- major. Habitable-zone retention and the luminosity
slope q are prior- and structure-dominated; 'q agrees with
Berta-Thompson et al. (1.17)' is a coincidence of prior choice, and
P(TRAPPIST-1 e) = 0.02 contradicts cited physical models.
- Evidence: Refitting the baseline data with different q priors: N(0.6,1) gives q 1.17 and HZ retention 0.25; N(0,1) 0.99 and 0.31; N(2,1) 2.06 and 0.09; N(0.6,0.3) 0.75 and 0.45; N(0.6,3) 2.26 and 0.11; flat 2.79 and 0.09. The data set only a lower bound q > about 0.4-0.8. The analyst's p = 4.3 differs from Berta-Thompson's 5.9 (+0.61/-0.43), unmentioned. A single v^4 plane cannot separate TRAPPIST-1 c from e, so 0.02 is structural; Krissansen-Totton 2023 (arXiv:2306.05397, e and f retain atmospheres in ~98% of runs) and 2024 (arXiv:2409.18940) are in the reference list but not weighed.
- Fix: Delete the 'agrees with' statement; report q as a lower bound and note the p discrepancy; remove P(T-1 e) = 0.02 from key numbers or pair it with the evolution-model results; describe HZ retention as unconstrained (0.09-0.68 across defensible choices), not as 0.34.
- major. Astronomically small logistic-tail
probabilities are taken literally and drive part of the earliness
result.
- Evidence: In the pooled sample 43% of draws have f_atm(0.1 Msun) < 1e-3 and 27% < 1e-10 (5th percentile 2e-59). With a floor of 1e-3 on f_atm, P(rank<1%) under uniform n rises from 0.641 to 0.670 and for n=1-3 from 0.282 to 0.338; with a floor of 1e-2, to 0.681 and 0.372. About a third of the reported 0.75-to-0.64 drop comes from these tails.
- Fix: Impose and justify a floor (1e-3 to 1e-2) on extrapolated retention probability, or show this sensitivity next to the headline.
- minor. '0 of 14' conditions on outcome and
overstates the effective sample.
- Evidence: 'Informative verdict' excludes every tentative or anomalous M-dwarf case by definition (L 98-59 b, GJ 357 b, GJ 3473 b, LHS 1478 b). The 14 planets orbit 12 stars; TRAPPIST-1 d is admitted on transmission alone while other flat transmission spectra are coded inconclusive; only 7 have S < 25 S_Earth (upper limit 0.31).
- Fix: Quote 0/14 and 3/17 together, give the host count and the S < 25 subset, and say no habitable-zone planet has a decisive verdict.
- minor. Soft labels are more confident than the
source papers; 'thick' and 'substantial (>0.1-1 bar)' are conflated.
- Evidence: Labels of 0.01-0.03 for a >0.1-1 bar atmosphere, whereas LTT 1445 A b allows up to ~1 bar O2/N2 at 2 sigma (arXiv:2605.14997), GJ 367 b allows 0.1 bar (arXiv:2401.01400), GJ 1252 b is limited only to <10 bar (arXiv:2208.09479), and the 2025 review arXiv:2507.00933 says emission results are consistent with bare rock or <10 bar atmospheres.
- Fix: State that the upper limit applies to thick or CO2-rich atmospheres and that thin N2/O2 atmospheres up to about 1 bar are not excluded for several planets.
- minor.
- Evidence:
- Fix: Write a real methods section listing every cut and prior, and either source the f_water / f_other ranges or label them arbitrary.
- minor. Smaller inaccuracies: m sin i used as true
mass for six RV prediction targets; Rocky Worlds data status overstated;
figure label 'n = 1 (no hard steps)'; host-type datum not used.
- Evidence: MAST Rocky Worlds page (checked 2026-10-12) lists public JWST eclipses only for GJ 3929 b (4), TOI-771 b (3) and LHS 1140 b (1); LTT 1445 A b/c and TOI-198 b have HST data only. n = 1 is one hard step. Kipping 2025 finds a shortened window alone cannot explain our G-star host.
- Fix: Flag m sin i masses as lower limits, correct the data-status sentence, relabel the figure panel, and note that a 10 Gyr cap leaves the host-type datum unexplained.
Overclaims
- 'The census is decisive only for few hard steps (n = 1: 0.35 to 0.03)': the census alone gives 0.14; the assumed water and flare penalties do as much as the census.
- 'For n >= 4, excluding every M dwarf still leaves humanity at about the 1% rank or below because K dwarfs live 20-45 Gyr': true only for a 0.6 Msun cut with the full main-sequence lifetime habitable; 70-83% of the weight is from 0.60-0.65 Msun stars.
- 'q agrees with Berta-Thompson et al. (2025) value 1.17': the median is set by the prior; the data give only a lower bound, and p disagrees (4.3 versus 5.9).
- 'Posterior probability' that rank < 1% (0.75 to 0.64): a prior-weighted grid fraction bounded between 0.49 and 0.75 by construction.
- P(substantial atmosphere) for TRAPPIST-1 e = 0.02 (5-95%: 0-0.15): a structural artefact of the single-plane shoreline, contradicted by cited evolution models (~98% retention).
- Habitable-zone retention 'pooled mean 0.34': an average over three arbitrary modelling choices (0.09, 0.25, 0.68), not an estimate.
- 'Critical p_M = 4.2e-12 at n = 4': exists only because the no-M-dwarf rank (1.05%) exceeds the 1% threshold by 0.05 points.
- Novelty item (iii), K dwarfs alone suffice: already stated in Hanson et al.'s abstract.
- '95% upper limit 0.18' on the atmosphere fraction: applies to thick or CO2-rich atmospheres on hot planets among outcome-selected verdicts; thin atmospheres up to about 1 bar are not excluded for several.
Novelty check
Novel: partly. The census with beta-binomial is an updated reproduction of what the 2025 review, Park Coy et al. and Ih et al. already state (no definitive atmosphere; occurrence below roughly 1 in 5-8). The shoreline fit follows Berta-Thompson et al. and adds no new constraint. The 'K dwarfs suffice' result is already in Hanson et al.'s abstract ('>99% of advanced life appears after today, unless n<3 and max planet duration <50Gyr'); Hanson's eq. 1 at 45 Gyr with a 4 Gyr SFR peak gives 30 / 9.2 / 2.7 / 0.76 / 0.06% for n = 1/2/3/4/6 against the analyst's 38 / 12 / 3.7 / 1.05 / 0.08%. The 'not early with a 10 Gyr cap' result is implied by Hanson's own appendix. I did not find the critical p_M versus n table elsewhere; it is the most useful new item. Linking earliness probabilities to a JWST census and to hypothetical TRAPPIST-1 / LHS 1140 b outcomes is new, but the closest prior work on rank under priors on n and Lmax (Cook 2022) is uncited.
- Hanson, Martin, McCarter & Paulson 2021, arXiv:2102.01522 (abstract and figures 2, 26)
- T. Cook 2022, 'Replicating and extending the grabby aliens model', Center on Long-Term Risk, https://longtermrisk.org/replicating-and-extending-the-grabby-aliens-model/
- R. Hanson, 'Cook's Critique of Our Earliness Argument', https://www.overcomingbias.com/p/cooks-critique-of-our-earliness-argumenthtml
- Kipping 2025, 'Solar Hegemony', arXiv:2510.01215
- Kipping 2021, 'Red Sky Paradox', arXiv:2106.11207
- Haqq-Misra, Kopparapu & Wolf, arXiv:1705.07813
- Loeb, Batista & Sloan 2016, arXiv:1606.08448
- Berta-Thompson et al. 2025, arXiv:2507.02136
- Ih et al. 2025, arXiv:2508.08253
- Park Coy et al. 2024, arXiv:2412.06573
- Kreidberg et al. 2025 review, arXiv:2507.00933
- Krissansen-Totton 2023, arXiv:2306.05397
Required changes
- Headline: replace 'The census is decisive only for few hard steps (n = 1: 0.35 to 0.03)' with: for n = 1, P(rank<1%) falls from 0.35 to 0.14 with the JWST-informed shoreline alone (0.02-0.31 across shoreline variants) and to 0.03 only when the assumed water and flare penalties are included.
- Headline and key-numbers row on M dwarfs excluded: replace 'for n >= 4 ... about the 1% rank or below' with the cut and window dependence (n = 4: 1.05% / 2.8% / 6.3% for cuts 0.6 / 0.65 / 0.7 Msun; 5.9% / 15% / 29% with a 60% window); state that 70-83% of the weight is from 0.60-0.65 Msun stars; delete '4.2e-12 (n = 4)' and say 'effectively impossible for n >= 4 at a 0.6 Msun cut'.
- Relabel P(rank<1%) and P(rank<10%) as prior-weighted fractions of (n, Lmax) space, show them by n, state the [0.49, 0.75] bound and that 82% of the Lmax prior lies above 20 Gyr, and add E[rank] (0.093 / 0.114 / 0.136) or an equivalent likelihood summary. Either condition on our own datum or state that this is not done, citing Cook 2022 and Kipping 2025.
- Shoreline slopes row: delete 'q agrees with Berta-Thompson et al. (2025) value 1.17'; replace with 'q > about 0.5 (95%); central value set by the prior' and report that p = 4.3 differs from Berta-Thompson's 5.9.
- Remove P(TRAPPIST-1 e) = 0.02 (0-0.15) from the key numbers or pair it with Krissansen-Totton 2023/2024 (~98% retention); describe habitable-zone retention as unconstrained (0.09-0.68 across defensible choices) and do not quote 0.34 as an estimate.
- Impose and justify a floor on extrapolated retention probability (1e-3 to 1e-2), or show the tail-floor sensitivity (uniform n 0.64 to 0.67-0.68; n = 1-3 0.28 to 0.34-0.37) next to the headline.
- Census statement: reword to '0 of 14 with a decisive verdict have a thick (roughly >= 1-10 bar or CO2-rich) atmosphere; 0-3 of 17 including ambiguous eclipse results; 12 host stars; 7 planets below 25 S_Earth; none in the habitable zone with a decisive verdict', and state that thin N2/O2 atmospheres up to about 1 bar are not excluded for several.
- Novelty section: attribute the K-dwarf and 10 Gyr cap results to Hanson et al. (abstract; figures 2 and 26) as confirmations with a physical IMF and measured star-formation history; cite Cook (2022) and Hanson's reply.
- Small fixes: flag m sin i masses as lower limits for Proxima b, GJ 1002 b, Teegarden's b, Wolf 1069 b, Ross 128 b, GJ 3378 b; correct the Rocky Worlds data-status sentence (public JWST eclipses only for GJ 3929 b, TOI-771 b, LHS 1140 b); relabel 'n = 1 (no hard steps)' in figure 5; note that a 10 Gyr cap leaves the host-type datum unexplained and that an unsaturated t^n law out to 1e4 Gyr is an assumption equivalent to choosing a very large Lmax.