Where is everybody? · Working papers
Sixty years of radio searches, combined
Revised after a second, separate analysis run for this project tried to break it. Neither analysis is an outside expert.
Merging 29 published radio-survey components into one de-duplicated coverage function (Milky Way model: 7.5e10 stars), the null record limits always-on isotropic 1e17 W narrowband beacons to N < 4.4e5 (1.7e5 to 2.6e6) if the frequency is anywhere in 1-10 GHz.
Summary
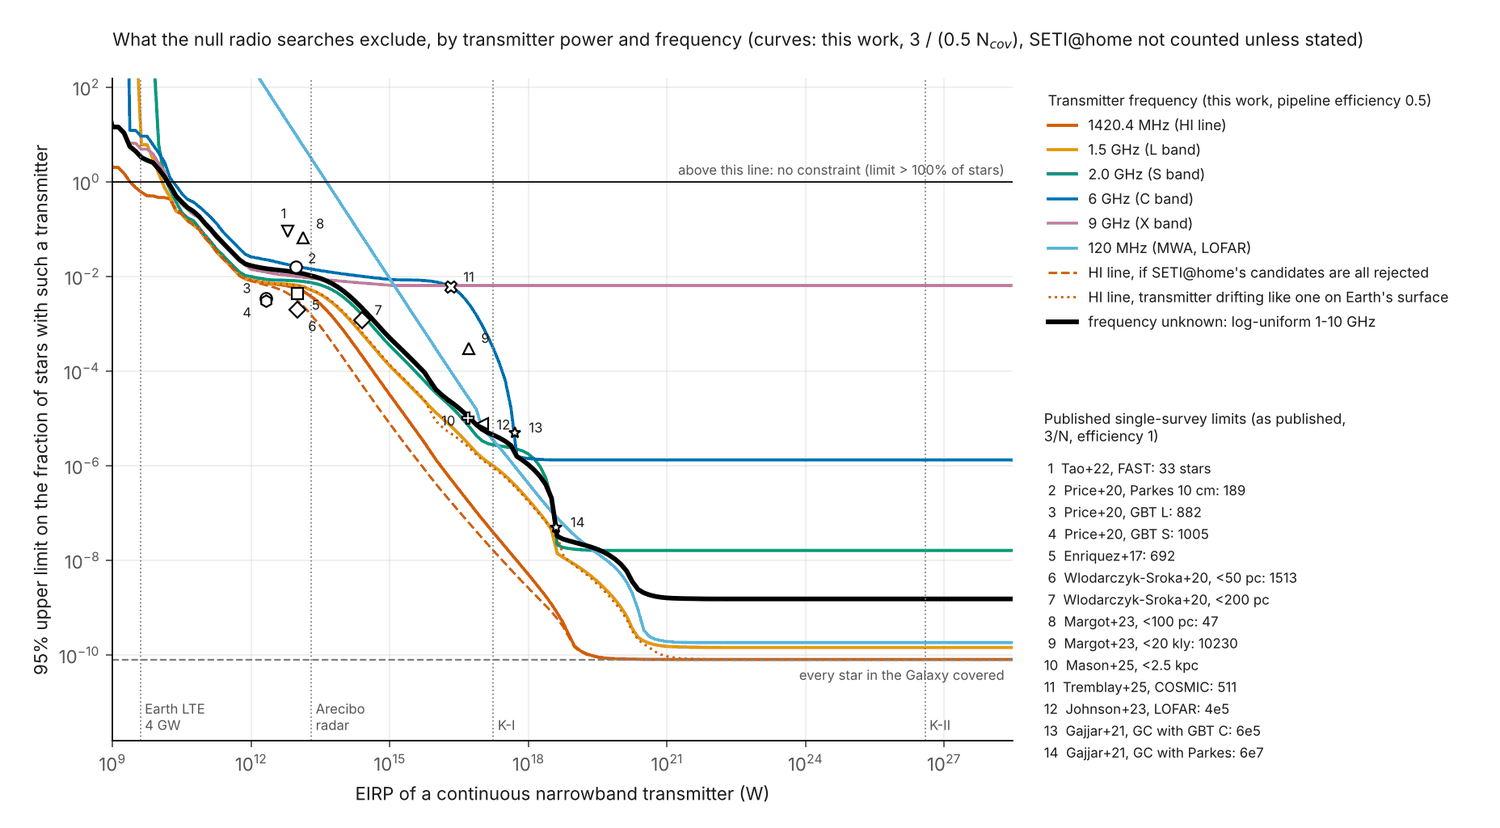
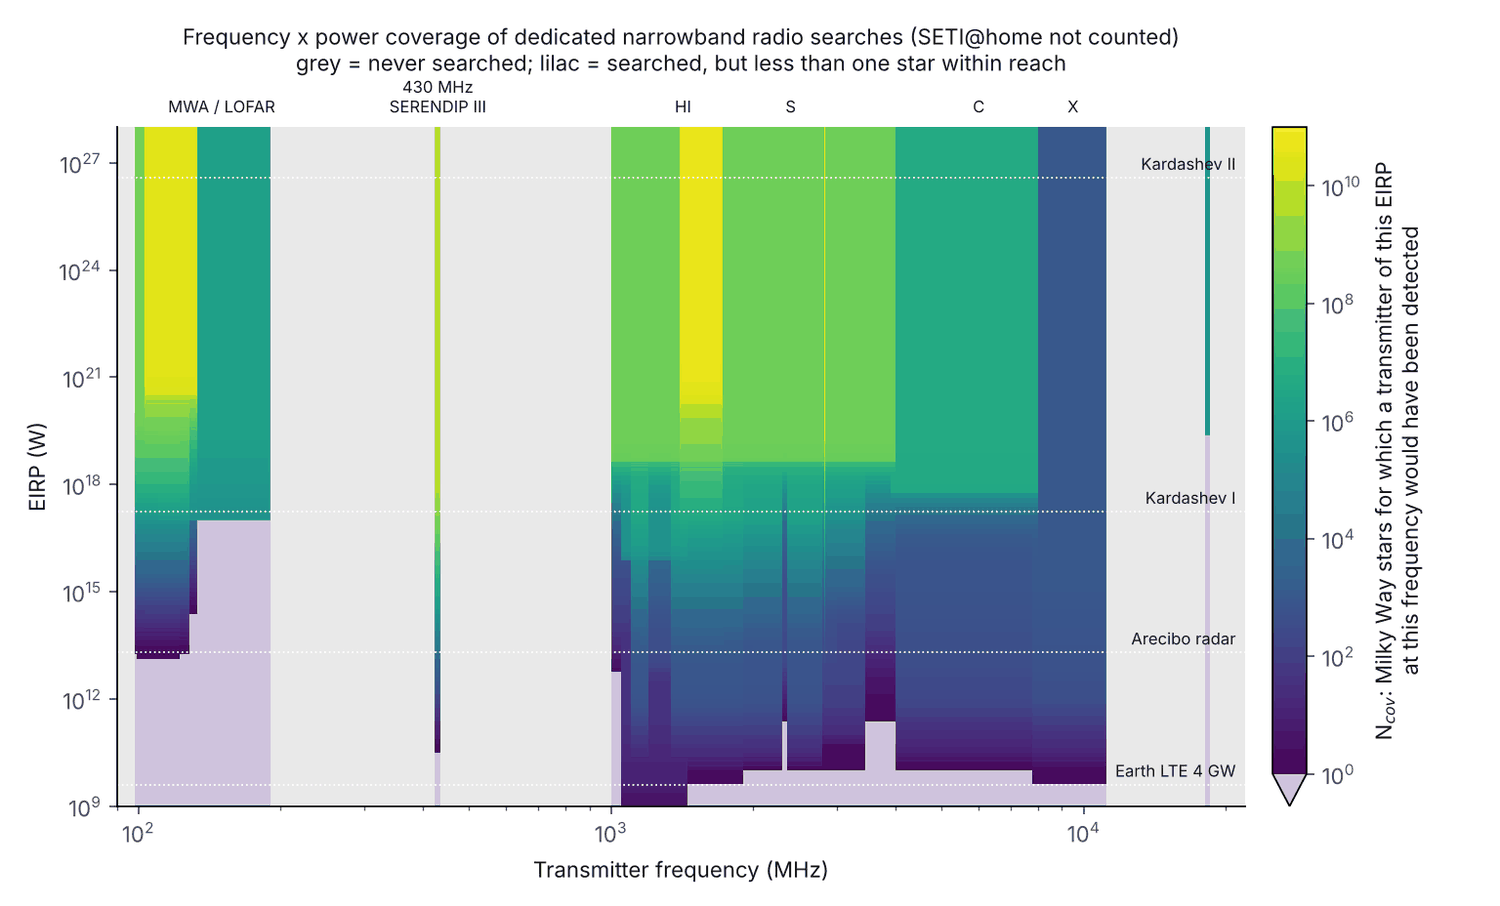
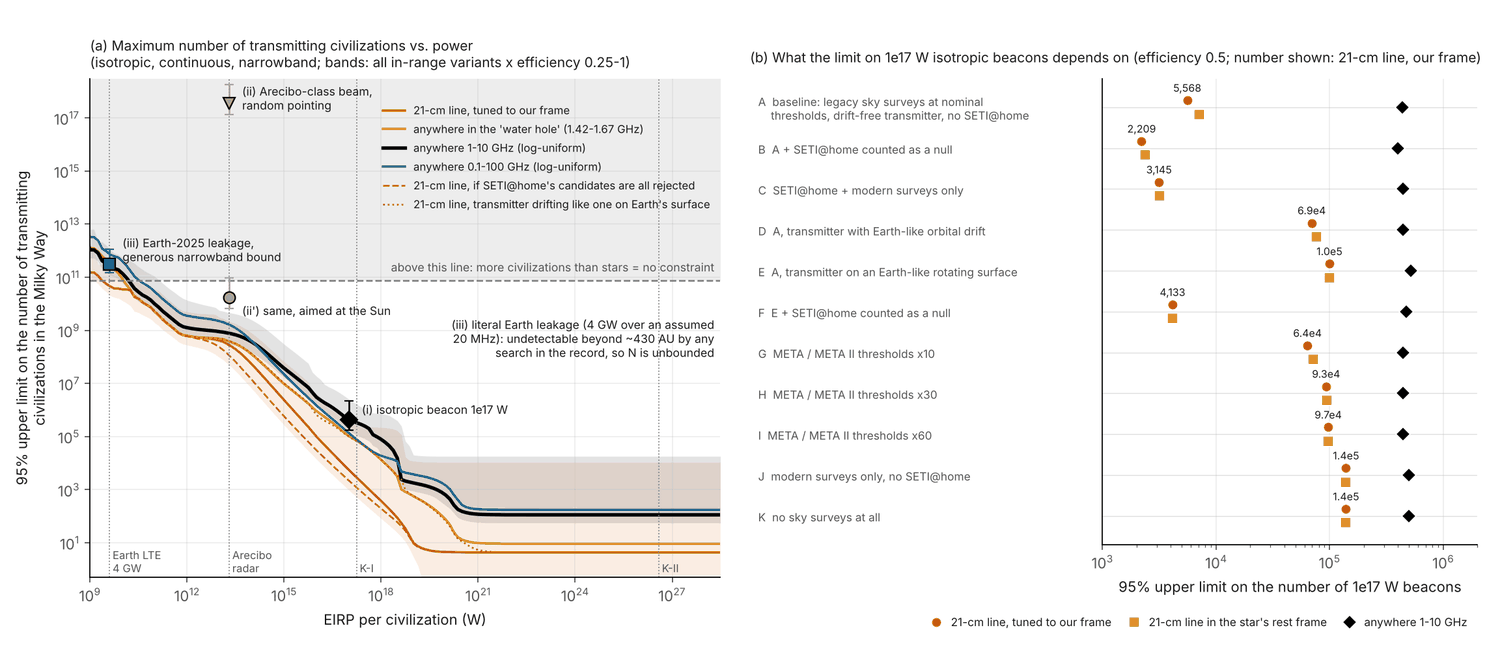
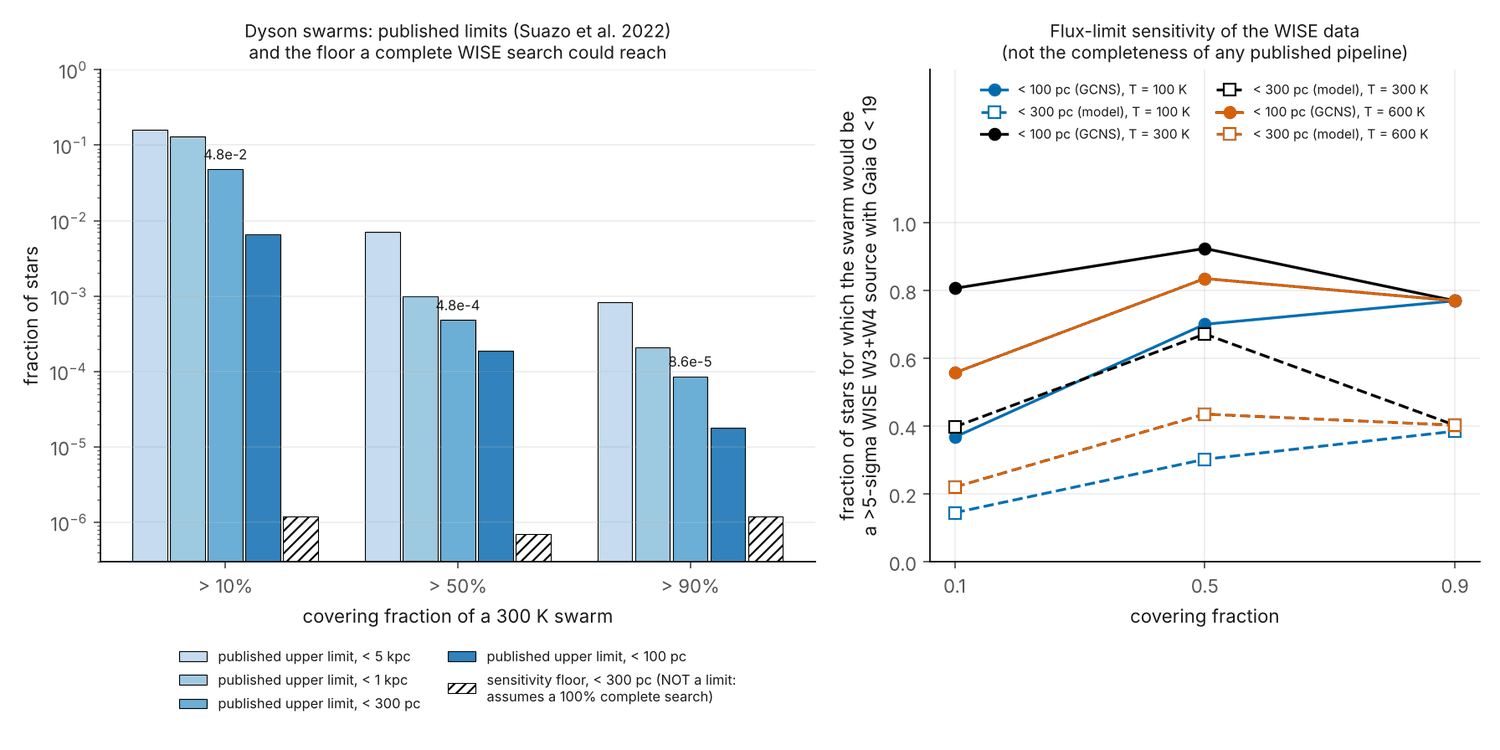
Merging 29 published radio-survey components into one de-duplicated coverage function (Milky Way model: 7.5e10 stars), the null record limits always-on isotropic 1e17 W narrowband beacons to N < 4.4e5 (1.7e5 to 2.6e6) if the frequency is anywhere in 1-10 GHz. On the 21-cm line the limit is N < 5,600 only if META/META II are trusted at nominal thresholds and the carrier is drift-free; the defensible range is 970 to 3.7e5 (2,200 if SETI@home's unresolved candidates are all rejected, about 1e5 for a transmitter on a rotating planet without SETI@home). Kardashev-II beacons: N < 4.3 on the 21-cm line (the efficiency floor; 57 if only SETI@home plus post-2015 searches are trusted, 1,200 to 5,300 if neither legacy surveys nor SETI@home count) and N < 113 (55 to 18,000) in 1-10 GHz, where dedicated searches cover only 5.3% of stars x log-frequency, 94% of it via BETA at a nominal threshold. Arecibo-class radars and Earth-2025 leakage are unconstrained (limits exceed the number of stars), and the only published Dyson-swarm limits remain Suazo et al. 2022 (4.8e-2, 4.8e-4, 8.6e-5 of stars within 300 pc for covering fractions above 10%, 50%, 90%).
Key numbers
| Quantity | Value | Uncertainty | Note |
|---|---|---|---|
| N_max (95%), isotropic always-on 1e17 W narrowband beacon, log-uniform 1-10 GHz | 4.35e5 transmitters in the Milky Way | 1.7e5 to 2.6e6 (all in-range variants, both drift classes, efficiency 0.25-1) | baseline: no SETI@home, drift-free, eta=0.5; N_eff = 1.04e6 stars, p = 6.9e-6 per transmitter; 81% of N_eff is in-beam stars of Breakthrough Listen pointings calibrated to Mason+ 2025 |
| N_max (95%), isotropic 1e17 W beacon on the 21-cm line as received in our frame (1420.2-1420.6 MHz) | 5.57e3 | 972 to 3.7e5; conditional: 2.2e3 if SETI@home counted; 6.9e4 (orbital drift) and 9.95e4 (surface drift) without SETI@home; 4.1e3 surface drift with SETI@home; 1.39e5 with no legacy sky surveys | 94% of baseline N_eff is META + META II at nominal Technosearch thresholds; these lose a factor 11 (orbit) to 64 (surface) for drifting carriers |
| N_max (95%), isotropic 1e17 W beacon on the 21-cm line in the host star's rest frame | 7.08e3 | 1.07e3 to 3.7e5 | META velocity window (-41..+43 km/s) contains 34% of Milky Way stars; SETI@home window 95% |
| N_max (95%), isotropic K-II (3.83e26 W) beacon, 21-cm line our frame | 4.32 | <1 (eta=1) to 1.1e4; 57 if only SETI@home + post-2015 searches trusted; 1,200 (5,300 with Gajjar+ 2021 Galactic-centre star counts) if neither legacy surveys nor SETI@home count | this is the efficiency floor ln(0.05)/ln(1-eta); detection chance for one such beacon is 50%, 5.1% or 0.25% in the three cases; 6.8 in the star's rest frame |
| N_max (95%), isotropic K-II beacon, log-uniform 1-10 GHz | 113 | 55 to 1.8e4; 2.0e3 with post-2015 searches only (9.0e3 with Gajjar+ 2021 star counts) | probably conservative: continuum surveys not included (such a beacon would be a 61-567 Jy NVSS source at 25-8.2 kpc) |
| Fraction of stars x log-frequency (1-10 GHz) covered at K-II power by dedicated narrowband searches | 5.25% | 0.30% from post-2015 searches alone; 3.4% for 0.1-100 GHz | 94% of the 5.25% is the BETA survey at a nominal threshold |
| N_max (95%), Arecibo-class beam (2e13 W EIRP), random pointing, 5% duty, 1-10 GHz | 3.4e17 | 1.3e17 to 1.9e18 | p = 8.7e-18 per civilization; 6.6e-7 detections expected if every star hosted one; aimed at the Sun: N_max 1.7e10 (6.6e9 to 9.3e10) |
| Earth-2025 leakage, generous bound (all 4 GW in one narrowband carrier), 1-10 GHz | N_max 3.1e11 (4x the number of stars) | 1.5e11 to 1.2e12 | 0.72 detections expected if every star hosted one; literal case (4 GW over an assumed 20 MHz = 558 W per 2.79 Hz channel) is visible to FAST only to 427 AU, so N is unbounded |
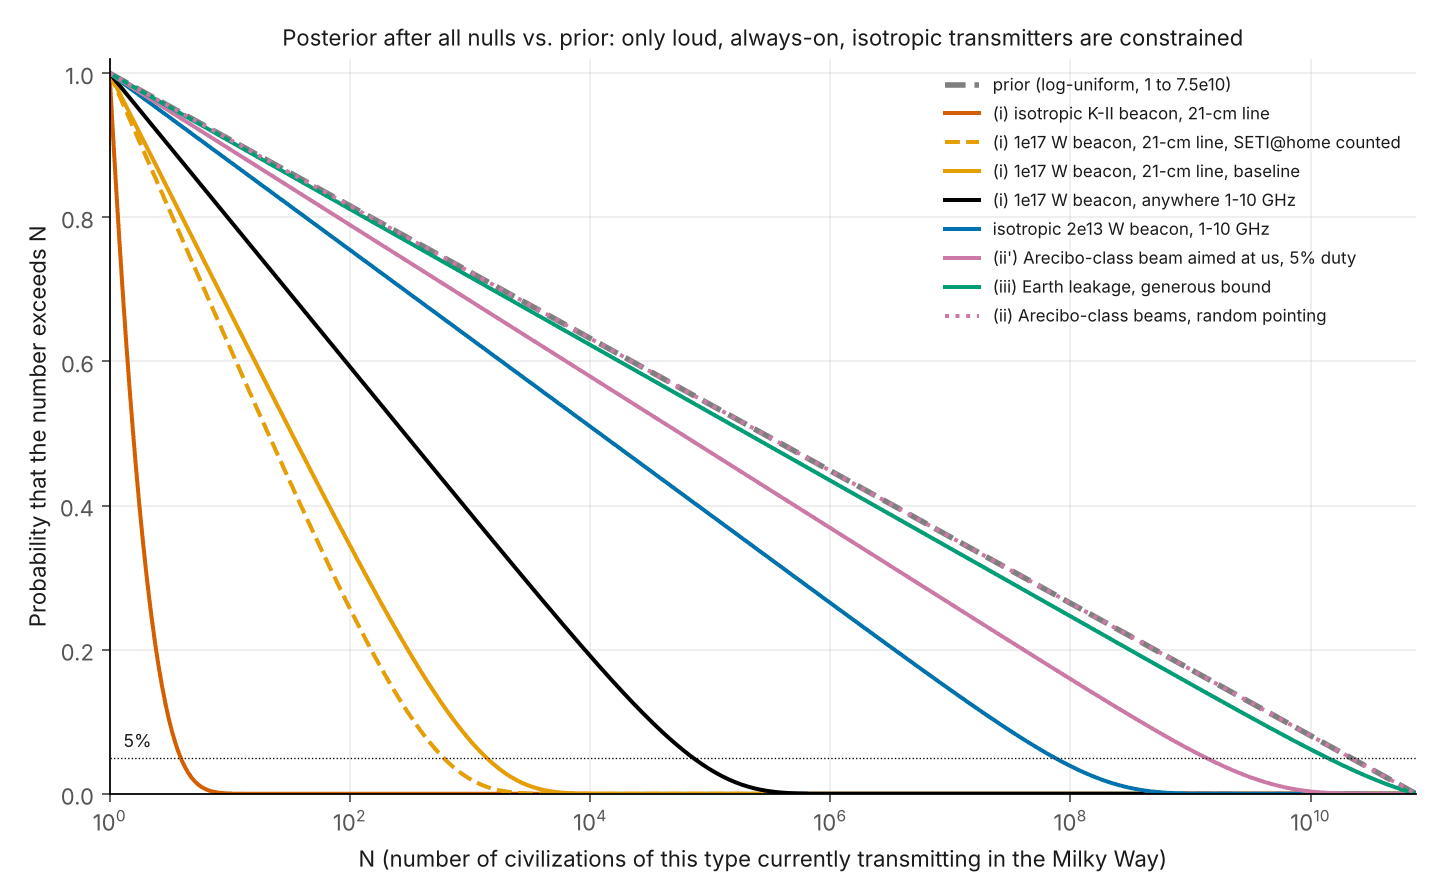
| Posterior 95th percentile of N, log-uniform prior on [1, 7.5e10] (prior q95 2.2e10) | 1,373 (1e17 W, 21 cm, baseline); 7.2e4 (1e17 W, 1-10 GHz); 46 (K-II, 1-10 GHz) | 602 for 1e17 W 21 cm if SETI@home counted | radar and leakage posteriors are essentially the prior |
| SERENDIP III share of 0.1-100 GHz N_eff at 1e17 W | 88% | one legacy survey (424-436 MHz) at a nominal threshold; tier-B thresholds x10 moves the 0.1-100 GHz limit from 1.4e5 to 8.0e5 | |
| In-beam star concentration (GBT L band, 1e17 W) | top 10 pointings carry 44% (52% at S band); 80% within 10 deg of the plane; median distance 6.0 kpc | unscaled model / Mason+ 2025 counts: 0.75-0.90 inside 3 kpc, 1.27 at <=1e17 W, 1.92 at <=1e18 W | |
| Coverage fraction vs Grimaldi & Marcy 2018 idealised prior search (uniform 1-2 GHz) | 1.2e-8, 4.3e-7, 5.4e-6 at 2e13, 1e15, 1e16 W | ratio to their 2.6e-8 (L/L_Arecibo)^1.5: 0.46, 0.046, 0.019 | theirs assumes the whole sky searched to 1e-23 W/m2 across the band |
| Dyson swarms at 300 K, published upper limits on fraction of stars within 300 pc (Suazo+ 2022) | 4.8e-2, 4.8e-4, 8.6e-5 for covering fraction >10%, >50%, >90% | sensitivity floor of a hypothetical 100%-complete WISE search: 2.5e-6 (10% bin, two unrefuted candidates), 7.1e-7, 1.2e-6; not a limit, no published completeness | |
| Milky Way model normalisation | 7.54e10 stellar objects, about 4.2e10 Msun | about 25% below the usual 5-6e10 Msun; limits scale at most linearly |
Data used
- SETI Institute Technosearch radio, optical and archival lists (https://technosearch.seti.org): 121 + 42 + 13 entries
- VizieR J/MNRAS/498/5720 (Wlodarczyk-Sroka, Garrett & Siemion 2020: Breakthrough Listen pointings and in-beam Gaia stars)
- VizieR J/AJ/152/181 (Harp et al. 2016 ATA targets), cross-matched to Gaia DR3 via CDS XMatch
- VizieR J/PASP/129/E4501 (Isaacson et al. 2017 target list)
- VizieR J/A+A/649/A6 (Gaia Catalogue of Nearby Stars)
- VizieR J/MNRAS/478/1520 (Baumgardt & Hilker 2018 globular-cluster masses)
- Gaia archive TAP query for a magnitude-luminosity relation
- Hand-transcribed 98-row literature compilation (data/surveys_compilation.csv) and 33-row model input table (data/radio_model_components.csv); 66 arXiv identifiers verified through the arXiv API
- Published numbers read from full texts: Anderson et al. 2025 (SETI@home Table 8), Mason et al. 2025 Table 1, Price et al. 2020, Gajjar et al. 2021, Margot et al. 2023, Suazo et al. 2022 Table 1 and 2024 Table 5, Grimaldi & Marcy 2018, Saide et al. 2023; Lacki 2024/2025 from arXiv abstracts
Method
For each of 33 radio survey components (16 tier A from the papers, 14 tier B legacy/nominal, 3 extragalactic never counted) N_cov(L) is the number of Milky Way stars inside the footprint closer than sqrt(L/4 pi S_min); stars are named targets with distances or come from an analytic Galaxy model (two discs, halo, bulge) normalised to the Gaia 100 pc sample. Components are merged zone by zone (max where footprints overlap, sum otherwise) and averaged over five frequency priors (21-cm line in our frame, 21-cm line in the star's rest frame with a kinematic model for survey velocity windows, water hole, log-uniform 1-10 and 0.1-100 GHz) to give N_eff(L). Per-survey drift losses max(1, drift x integration / channel width) are applied for three transmitter classes (drift-free, Earth-like orbit, Earth-like surface); SETI@home is excluded by default with a switch (barycentric or non-barycentric sensitivities). In-beam star counts use a Gaussian beam taper and are calibrated in five power shells to Mason et al. 2025. Limits use the exact binomial likelihood: p = eta x duty x beam fraction x N_eff/N_MW, N_max = ln(0.05)/ln(1-p); 24 robustness variants x drift classes x eta 0.25-1 define the quoted ranges; posteriors use a log-uniform prior on N. Dyson swarms: published Suazo et al. 2022 limits plus a WISE W3+W4 flux-limit sensitivity count on the Gaia Catalogue of Nearby Stars.
Closest prior work and what is new
Closest prior work. Wlodarczyk-Sroka, Garrett & Siemion 2020 and Mason, Garrett & Siemion 2025 (arXiv:2511.20231) count in-beam stars for Breakthrough Listen only; Price et al. 2020, Enriquez et al. 2017 and Margot et al. 2023 give per-survey transmitter fractions; Wright et al. 2018 and Tarter et al. 2010 give searched-volume fractions; Grimaldi & Marcy 2018 and Grimaldi 2023 do population inference from idealised search volumes; Lacki 2024 (arXiv:2405.04651) and 2025 (arXiv:2508.00249) bound broadcast populations including non-SETI radio data; Suazo et al. 2022/2024 for Dyson swarms.
What is new. (1) One cross-survey coverage function N_cov(L, nu) in units of Milky Way stars, de-duplicated across legacy sky surveys, targeted surveys, in-beam stars and fields, packaged as an exact-binomial per-behaviour likelihood module. (2) The explicit conditional structure of the 21-cm limit: SETI@home status x transmitter drift class x legacy thresholds changes it by a factor of 63. (3) For dedicated SETI searches only, the statement that above about 1e21 W frequency coverage rather than sensitivity sets the limit. Not new: the in-beam counting (a re-derivation calibrated to Mason et al. 2025) and the Dyson sensitivity count (the first-pass novelty claim for it is withdrawn).
Confidence that it is new: medium
Limitations
- Only continuous narrowband (few Hz or less) transmitters are constrained; pulsed, swept or broadband emission enters only through a duty factor.
- Transmitters are assumed to be distributed like stars.
- The 21-cm and K-II results rest on legacy sky surveys (META, META II, BETA, Big Ear, SERENDIP III) entered at nominal thresholds that I could verify only in the Technosearch database, not in the original papers; META/META II had no drift search and a frame assumption.
- SETI@home is excluded from the baseline because no disposition of its ~200 final candidates (92 re-observed with FAST) was found published as of October 2026; counting it changes the 1e17 W 21-cm limit from 5,600 to 2,200.
- 81% of the 1-10 GHz coverage at 1e17 W is model-counted, uncatalogued in-beam stars, about half of it in ten low-latitude pointings at about 6 kpc, tied to the Besancon counts of Mason et al. 2025; the Parkes calibration needs unexplained shell factors from 3.4 (near) to 0.26 (far).
- Non-SETI radio astronomy is not included: continuum surveys (NVSS, GB6/PMN) would probably have detected a K-II narrowband beacon as a source of tens to hundreds of Jy, so the K-II limits are probably conservative; this is stated, not quantified.
- My Galactic-centre field star counts are 4.6-6.1 times those quoted by Gajjar et al. 2021; this matters only when legacy surveys are dropped (K-II 'modern only' limits rise from 1,200/2,000 to 5,300/9,000).
- Model Galaxy holds 7.5e10 objects (4.2e10 Msun), about 25% below canonical; pipeline efficiency 0.5 is assumed (0.25-1 in ranges).
- The compilation is sparse: of 98 rows, 18 were checked against full text, 36 against arXiv abstracts only, 31 against Technosearch only; dwell time is filled in 36% of rows, flux threshold in 37%, drift range in 21%. Recovered Breakthrough Listen target lists hold 834/708/168 unique stars against 882/1005/189 published.
- Optical, artefact and most infrared searches are compiled but not modelled; the Dyson floor is a sensitivity count, not a limit.
- The 20 MHz bandwidth for the literal LTE leakage case is my assumption; Saide et al.'s 4 GW is summed over all LTE bands.
What it means for the Fermi question
The radio 'Great Silence' is a narrow observational fact that constrains behaviour, not abundance. It excludes a Galaxy with more than a handful of deliberate K-II 21-cm beacons (if legacy surveys are trusted), more than roughly 1e2 to 9e3 K-II beacons elsewhere in 1-10 GHz, or more than 1e3 to 4e5 planet-scale (1e17 W) 21-cm beacons; if a fraction f of civilizations run 1e17 W isotropic beacons somewhere in 1-10 GHz, then N x f < 4.4e5. It does not exclude a Galaxy in which every star hosts a civilization like Earth in 2025: the whole record would expect 0.7 detections under a generous leakage bound, zero under the literal one, and 7e-7 from randomly pointed planetary radars. An integrator should use seti_likelihood.log_likelihood (exact N ln(1-p)) with an explicit behaviour mixture, treating the drift class and the SETI@home switch as nuisance choices; for any population without loud, persistent, omnidirectional beacons the radio term is flat, so the paradox must be carried by other evidence (absence of settlement or artefacts, and waste heat, where fewer than about 1 in 1e4 nearby stars can host a near-complete Dyson swarm).
Changes made after the referee report
- Baseline record changed: SETI@home is excluded by default (candidates unresolved) and exposed as a switch; the 21-cm 1e17 W limit is now stated conditionally (5,600 baseline; 2,200 with SETI@home; about 1e5 with drift or without legacy surveys; range 970 to 3.7e5).
- Drift-rate coverage added as an explicit per-survey threshold factor for three transmitter classes (data/drift_factors.csv), with META/META II x10/x30/x60 variants and SETI@home's non-barycentric sensitivity column for drifting transmitters.
- New 'HI_rest' frequency prior (21-cm line in the star's rest frame) with a kinematic Galaxy model for survey velocity windows; META split into its 1420 and 2840 MHz bands.
- K-II limits restated: 21-cm limit given as the exact-binomial efficiency floor 4.3 with a 0.25%-50% detection-chance range; 1-10 GHz quoted as 113 with 'modern only' 2,000 (9,000 with Gajjar et al.'s star counts); coverage statement reworded (5.3% by dedicated narrowband searches, 94% via BETA at nominal threshold, 0.3% post-2015).
- In-beam star counts recomputed with a Gaussian beam taper and calibrated shell by shell to Mason et al. 2025; central 1-10 GHz limit moved from 3.2e5 to 4.35e5; pointing-concentration statistics added (data/bycatch_pointings.csv).
- Continuum-survey caveat added with computed flux densities, and Lacki 2024/2025 cited (both arXiv IDs verified).
- Dyson section rebuilt: published Suazo et al. 2022 fractions lead; the 1e-6 figures are labelled a sensitivity floor; the seven-candidate column removed; at most two survivors in the 10% bin; Galaxy-wide Dyson numbers no longer quoted as limits.
- seti_likelihood.py rewritten: log_likelihood returns N ln(1-p), n_max is exact, drift class and SETI@home switch are arguments, p_detect_dyson requires an explicit completeness, dyson_published_limit added.
- All '2e13 W' quantities are interpolated at 2e13 W; behaviour id renamed i_beacon_2e13W.
- SERENDIP III share of the 0.1-100 GHz coverage stated (88%); LTE 20 MHz bandwidth labelled as an assumption.
- Figures redrawn: Fig. 1 at eta=0.5 with numbered non-overlapping labels; Fig. 3 gains a scenario-ladder panel; Fig. 5 separates published limits from the sensitivity floor.
- Compilation: result column filled for all 98 rows ('no detection' instead of the string 'null'), structured ir_* columns added for infrared rows, verified drift ranges added for Margot+ 2023 and Johnson+ 2023, verification levels reported.
- Novelty statement revised (claim 4 removed, claim 3 restricted to dedicated SETI searches, in-beam counting described as a re-derivation); numerical comparison with Grimaldi & Marcy 2018 added (data/grimaldi_comparison.csv) and the reason for no like-for-like comparison with Grimaldi 2023 stated.
- Minor points: target-list attrition, star-count normalisation (7.5e10 objects, 4.2e10 Msun) and the SETI@home sky fraction (30%, 25% variant) are now stated; a new variant scales Galactic-centre fields to Gajjar et al.'s star counts in the 'modern only' record.
Referee points not accepted
- Referee's K-II rest-frame figure (p about 0.19, N about 16) not adopted: BETA's 1400-1720 MHz band contains every Doppler shift, so at K-II power the star-frame limit is 6.8 (p = 0.36); 16.2 is what the model gives at 1e20 W, where BETA no longer reaches the whole Galaxy.
- 'Roughly 4 to 60' is not the full K-II 21-cm range: if neither the legacy surveys nor SETI@home count the limit is 1,200 (5,300 with Gajjar et al.'s Galactic-centre star counts), so the report quotes 4.3, 57 and 1,200-5,300 for the three cases.
- '69 of 98 compilation rows have no result' was a parsing artefact: the rows contained the string 'null', which pandas reads as missing; the entries now read 'no detection' and the code asserts no blank results.
- Central 1-10 GHz value: I did not round to the referee's 'about 5e5'; a like-for-like shell-by-shell calibration to Mason et al. gives 4.35e5 (the referee's own rebuild gave 4.8e5), and the model excess over Mason is 1.3-1.9x only beyond 3 kpc (0.75-0.9x inside), not uniformly 1.8-2x.
- Required change 8 asked to document SETI@home as a completed null with a switch; I went further and made exclusion the default, since no disposition of its candidates is published.
- Required change 2 asked to extend the 21-cm range to 1.1e5; the range now runs to 3.7e5 because drift classes and efficiency 0.25 are included.
- SERENDIP III share is stated as 88% (recomputed with the new in-beam calibration) rather than the referee's 85%.
Figures
Code
Every number above is produced by these scripts from public data. The data tables themselves are not hosted here; the scripts download them.
analysis.py common.py coverage.py fetch_data.py figures.py galaxy.py make_compilation.py make_report.py run_all.py seti_likelihood.py
Referee report
A second, separate analysis re-ran the code, recomputed the main numbers by its own route and tried to break the result. Like the first, it was run by Claude for this project; it is not an outside expert. In its report “the analyst” is the first analysis, which wrote the paper, and file names that are not linked on this page are its own working files. The paper above is the version revised in response.
Verdict: sound with fixes. Results reproduced: yes.
Reran code/run_all.py --offline from a scratch copy (70 s). Ten output tables, including behaviour_limits, robustness_variants, dyson_limits, neff_table and key_numbers.json, are byte-identical to the analyst's, and every headline number matches them.
Three independent recomputations:
- HI-line coverage by my own Monte Carlo (6 million stars sampled directly from the density law, astropy coordinates, star-by-star survey footprints): N_eff at 1e17 W = 2.04e8 against the analyst's 2.05e8; N_max = 2.2e3; K-II N_max = 6.0; model star total 7.532e10 against 7.537e10.
- The 1-10 GHz limit at 1e17 W rebuilt from the published Besancon in-beam counts of Mason et al. 2025: N_max about 4.8e5 against the analyst's 3.2e5, a factor 1.5 and inside the quoted range.
- Dyson sensitivity counts with a separately typed luminosity relation and a plane-parallel disc: 225,738 / 261,523 / 217,842 within 100 pc (analyst 228,230 / 261,523 / 217,842) and 2.4e6 / 4.0e6 / 2.4e6 within 300 pc (analyst 2.5e6 / 4.2e6 / 2.5e6).
Citation spot-checks against cached full texts all match: SETI@home Table 8, Mason 2025 Table 1, Price 2020, Gajjar 2021, Margot 2023, Johnson 2023, Painter 2025 Table 7, Tao 2022, Tremblay 2025, Suazo 2022 Table 1, Wright 2018, Saide 2023, and the Technosearch thresholds. Thirteen arXiv identifiers, including the 2026 ones, resolve to the stated papers.
Strongest objection
The headline numbers are carried by the least-verified parts of the record. The well-characterised targeted surveys contribute almost nothing above 1e15 W. The limits come from three sources whose completeness for the assumed signal was never demonstrated end to end: SETI@home, whose roughly 200 candidates are still awaiting FAST re-observation; legacy sky surveys entered at nominal Technosearch thresholds, of which META and META II detect only drift-free carriers inside a +-42 km/s window; and several million model-predicted, uncatalogued stars at 3 to 11 kpc in about ten low-latitude Breakthrough Listen beams.
The conclusion survives qualitatively: under any reading, always-on isotropic beacons of 1e17 W or more are limited to between a few thousand and about a million in the Galaxy (under roughly 1e-5 of stars), and Earth-like emitters are unconstrained by many orders of magnitude. The specific figures do not all survive: the HI-line figure moves by up to 50 times (2,200 to about 1e5), the K-II figures by 3 to 15 times, and the 1-10 GHz figure by about 1.5 times.
Errors found
- major. The study directory holds only code, data
and figures; the report text exists solely in the analyst's returned
object.
- Evidence: ls of shows code/, data/, figures/ only.
- Fix:
- major. The HI-line limit at 1e17 W (2,200; range
970 to 11,000) depends on SETI@home, which is not yet a null, and the
fallback surveys (META, META II) detect only drift-free carriers.
Drift-rate coverage was set to 1 and justified only for Breakthrough
Listen, although the study plan asked for it as an explicit factor.
- Evidence: Anderson et al. 2025: about 200 candidates selected, 92 being re-observed with FAST; no result published as of 12 Oct 2026 (arXiv search). META uses 0.05 Hz channels and 20 s integrations, so an uncorrected Earth-like transmitter (0.03 to 0.16 Hz/s at 1.4 GHz) is smeared over roughly 10 to 60 channels. My Monte Carlo: SETI@home alone gives 3.2e3 (barycentric) or 4.3e3 (non-barycentric); META/META II alone give 5.8e3 for drift-corrected beacons; with thresholds x10 to x30 and no SETI@home the total limit is about 6e4 to 1e5. The analyst's own 'no sky surveys' variant gives 1.1e5 but is excluded from the quoted range.
- Fix: State the limit conditionally: about 2,000 to 4,000 if SETI@home's pending candidates are all rejected; about 6,000 from META/META II alone for Doppler-corrected carriers; about 1e5 otherwise. Add a drift-smearing variant for META/META II and extend the range to 1.1e5.
- major. The Kardashev-II HI-line statement (N <
6, 'about 50% chance of detection') is the efficiency floor 3/eta,
carried entirely by META and META II at nominal thresholds, with a
frequency prior (1420.2 to 1420.6 MHz) drawn to coincide with META's 400
kHz window.
- Evidence: At K-II power N_eff equals the number of stars, so p = eta = 0.5. META's window is +-42 km/s; in a simple kinematic model only about one third of Galactic stars have line-of-sight velocity inside it, giving p about 0.19 and N_max about 16 once SETI@home's wider band is included. The analyst's modern-only figure is about 60. With p = 0.5 the exact binomial limit is 4.3, not 6.
- Fix: Quote 'roughly 4 to 60' and 'a 5% to 50% chance of detection', and say that the lower end is 3/eta.
- major. The 1-10 GHz limit at 1e17 W rests on
model-counted, uncatalogued in-beam stars concentrated in a few
pointings, and the model runs high against the published Besancon
counts.
- Evidence: In-beam stars supply 83% of N_eff. The ten richest pointings contribute 47% (L band) and 54% (S band) of them; 82 to 89% lie at |b| < 10 degrees, median distance 6.3 to 6.8 kpc. The analyst's model is 1.8 to 2.0 times Mason et al. 2025 at 9 to 25 kpc; using their counts gives N_max about 5e5 rather than 3.2e5.
- Fix: Keep the range 1.5e5 to 1.6e6, move the central value to about 5e5 (or state that Besancon-based counts give 5e5), and add a sentence naming the dependence on about ten low-latitude pointings.
- major. 'Only 5% of stars x log-frequency in 1-10
GHz has ever been searched at any power' and the K-II 1-10 GHz limit of
114 depend on one legacy survey and ignore non-SETI radio surveys.
- Evidence: BETA at a nominal 2.2e-22 W/m2 supplies 94% of the 5.3% (3.73e9 of 3.96e9 effective stars); with modern surveys only the figure is 0.3% and N_max about 1,900. A 3.8e26 W narrowband beacon anywhere in the Galaxy would appear as a 60 to 570 Jy source averaged over the NVSS band and 9 to 80 Jy in the 4.85 GHz single-dish surveys. Lacki 2024 and 2025 already bound broadcast populations with non-SETI radio data.
- Fix: Reword to 'covered by dedicated narrowband searches, 94% of it by BETA at a nominal threshold; 0.3% by modern surveys'. Quote the limit as about 100 to 2,000, add the continuum-survey caveat, and cite Lacki 2024/2025.
- major. The Dyson-swarm figures of 1.2e-6 to 5.2e-6
within 300 pc are a sensitivity floor, not an upper limit, and the '7
candidates' case is applied to the wrong covering-fraction bins.
- Evidence: Suazo et al. 2024 report no completeness; the pipeline goes from about 5 million sources to 7 through cuts that include rejecting variable sources, which the paper says 'rejects potential Dyson spheres made of pieces large enough to cause stellar variability'; 328 of 368 high-S/N sources were rejected as blends. The seven candidates have fitted covering fractions 0.03 to 0.16 and temperatures 100 to 275 K; only C, D and G exceed 0.1, and D is a background galaxy (arXiv:2607.09460).
- Fix: Lead with the published Suazo et al. 2022 fractions (4.8e-2, 4.8e-4, 8.6e-5). Relabel the 1e-6 figures as an idealised floor. Delete the k = 7 column for the 50% and 90% bins and use at most two survivors (2.5e-6) for the 10% bin. Apply the same to the Galaxy-wide 5e4 to 9e4 and to p_detect_dyson.
- minor. Rows and key numbers labelled '2e13 W' use
the nearest grid point, 1.78e13 W, while the behaviour table
interpolates at 2e13 W.
- Evidence: N_eff 567 (1-10 GHz) and 3.5e3 (HI line) in the coverage table against 581 and 4.0e3 in behaviour_limits.csv; the quoted p = 9.6e-18 uses 581.
- Fix: Use interpolated values everywhere or relabel the row 1.78e13 W.
- minor. seti_likelihood.log_likelihood returns -N p,
which is inaccurate when p approaches 1.
- Evidence: For K-II on the HI line p = 0.5: exp(-0.5) = 0.61 against the exact 0.5 for N = 1.
- Fix: Return N ln(1 - p).
- minor. SETI@home enters with the barycentric
sensitivity column and a 30% sky fraction.
- Evidence: Table 8's non-barycentric column is up to 1.9 times worse; the two SETI@home papers give both 25% and 30% for the sky fraction.
- Fix: Use the non-barycentric column in the fiducial or add it as a variant; state which sky fraction is used.
- minor. The 0.1-100 GHz limit (1.3e5) is tighter
than the 1-10 GHz limit because of one legacy commensal survey.
- Evidence: SERENDIP III (12 MHz at 430 MHz, nominal 5e-25 W/m2) supplies 85% of that prior's N_eff at 1e17 W.
- Fix: Add one sentence naming SERENDIP III as the driver.
- minor. The 'literal leakage' case treats 4 GW as
spread over 20 MHz.
- Evidence: Saide et al. 2023 give about 4 GW summed over all LTE bands; 20 MHz is the observing bandwidth they assume.
- Fix: Label 20 MHz as an assumption; the true per-channel power is lower, so the conclusion is unchanged.
- minor. Figure 1 is drawn with pipeline efficiency 1
while all tables use 0.5; several labels overlap.
- Evidence: Figure title states 'pipeline efficiency = 1'.
- Fix: Redraw at 0.5 or state the difference next to the table.
- minor. The Part 1 compilation is sparse and partly
verified from secondary sources.
- Evidence: Of 98 rows, 69 have no 'result' entry; 63% lack a sensitivity, 64% a dwell time, 81% a drift range; 36 rows verified from abstracts only and 31 from Technosearch only; infrared rows have no structured covering-fraction column.
- Fix: Fill the result column, add covering-fraction columns, and state the verification levels in the report.
- minor. The comparison with Grimaldi & Marcy
2018 and Grimaldi 2023 requested in the study plan is one qualitative
sentence.
- Fix: Add a side-by-side numerical comparison or state plainly that none was made.
- minor. Target lists from the Wlodarczyk-Sroka
catalogue are shorter than Price et al. 2020 and contain duplicates.
- Evidence: 874 L-band rows (834 unique), 733 S-band, 168 Parkes, against 882 / 1,005 / 189.
- Fix: State the attrition; the effect is small and conservative.
Overclaims
- 'N < 2,200 (970 to 11,000)' for 1e17 W HI-line beacons is presented as a settled limit; it is conditional on SETI@home's unfinished candidate follow-up, and the quoted range excludes the analyst's own 1.1e5 variant.
- 'A single K-II beacon on the HI line anywhere in the Galaxy would already have had about a 50% chance of being found' and 'N < 6': this is the assumed pipeline efficiency, on a frequency prior matched to META's window; a defensible range is 5% to 50% and N of 4 to 60.
- 'Only 5% of stars x log-frequency in 1-10 GHz has ever been searched at any power' and 'above 1e20 W frequency coverage, not sensitivity, is binding': true only for dedicated SETI searches, and 94% of the 5% is one legacy survey at a nominal threshold.
- 'Dyson swarms covering more than 10% are limited to roughly 1e-6 to 5e-6 of stars within 300 pc': a sensitivity floor under an undemonstrated completeness assumption, not a limit; the upper figure misapplies seven candidates whose fitted covering fractions are 0.03 to 0.16.
- 'Galaxy-wide N_max for 300 K Dyson swarms 5e4 to 9e4': inherits the same assumption.
- Novelty claim (4), 'a star-by-star WISE completeness for Dyson swarms': it is a sensitivity count, and Suazo et al. 2022 already did the star-by-star analysis.
- The central value 3.2e5 for 1-10 GHz is about 1.5 times more stringent than published Besancon star counts support, though the quoted range covers it.
Novelty check
Novel: partly. I found no published work that combines the legacy sky surveys, SETI@home tiers, targeted surveys and in-beam stars into one de-duplicated, frequency-resolved coverage function in units of Milky Way stars, or that packages it as a per-behaviour likelihood. That synthesis is new. The ingredients are not: the in-beam counting re-derives Mason et al. 2025 (with a model 1.8 to 2 times higher at large distances); the finding that frequency coverage is the bottleneck restates Wright et al. 2018 and holds only for dedicated SETI searches; the Dyson sensitivity calculation is a coarser version of Suazo et al. 2022, so novelty claim (4) should be removed. Lacki 2024/2025 already bound Milky Way broadcast populations with non-SETI radio data and should be cited against claim (3). The honest description is a synthesis and extension of published limits, not a new measurement.
- Mason, Garrett & Siemion 2025, arXiv:2511.20231 (Besancon bycatch for Breakthrough Listen; <1e-5 of systems within 2.5 kpc above 5e16 W)
- Wlodarczyk-Sroka, Garrett & Siemion 2020, MNRAS 498, 5720 (Gaia in-beam stars)
- Margot et al. 2023, AJ 166, 206 (injection-measured efficiency; re-scaled Breakthrough Listen limits)
- Price et al. 2020, AJ 159, 86 and Gajjar et al. 2021, AJ 162, 33 (per-survey transmitter-rate diagrams)
- Wright, Kanodia & Lubar 2018, AJ 156, 260 (haystack fraction 6.0e-18)
- Grimaldi & Marcy 2018, arXiv:1810.01207 and Grimaldi 2023 (Bayesian emitter counts)
- Lacki 2024, arXiv:2405.04651 (individual versus collective bounds on Milky Way broadcasts)
- Lacki 2025, arXiv:2508.00249 (bounds from radio source counts)
- Suazo et al. 2022, MNRAS 512, 2988 (star-by-star Dyson-sphere upper limits to 5 kpc)
Required changes
- HI line, 1e17 W: replace 'about 2,200 (970 to 11,000)' with a conditional statement: about 2,000 to 4,000 if SETI@home's pending candidates are all rejected; about 6,000 from META/META II alone for Doppler-corrected carriers; about 1e5 otherwise. Extend the quoted range to 1.1e5.
- Add drift-rate coverage as an explicit per-survey factor: at minimum a variant with META and META II thresholds multiplied by 10 to 60, and the non-barycentric SETI@home column.
- K-II, HI line: replace '6' and 'about 50% chance' with 'roughly 4 to 60' and 'a 5% to 50% chance', and say the lower end is the efficiency floor 3/eta on a prior matched to META's window.
- 1-10 GHz, 1e17 W: keep the range 1.5e5 to 1.6e6, move the central value to about 5e5 or state that Besancon-based counts give 5e5, and add that about half the effective sample comes from roughly ten pointings within 5 degrees of the Galactic plane at 6 to 7 kpc.
- K-II, 1-10 GHz: quote 'about 100 to 2,000'. Reword the 5% statement to 'covered by dedicated narrowband searches, 94% of it by BETA at a nominal threshold; 0.3% by modern surveys'. Add the caveat that continuum surveys would have seen a K-II beacon as a source of tens to hundreds of janskys, and cite Lacki 2024/2025.
- Dyson swarms: lead with the published Suazo et al. 2022 fractions (4.8e-2, 4.8e-4, 8.6e-5 within 300 pc). Relabel the 1e-6 figures as a sensitivity floor under undemonstrated 100% pipeline completeness. Delete the '7 candidates' column for the 50% and 90% bins; for the 10% bin use at most two survivors (2.5e-6). Apply the same relabelling to the Galaxy-wide 5e4 to 9e4 and to p_detect_dyson.
- seti_likelihood.py: return N ln(1 - p) in log_likelihood; document that SETI@home is treated as a completed null and expose a switch for it.
- Fix the '2e13 W' rows (interpolated values everywhere, or relabel as 1.78e13 W) so that 567 and 581 are not both quoted.
- Add one sentence naming SERENDIP III as the source of 85% of the 0.1-100 GHz coverage at 1e17 W.
- Label the 20 MHz leakage bandwidth as an assumption and note that Saide et al.'s 4 GW is summed over all LTE bands.
- Redraw Figure 1 at eta = 0.5 or state the difference; fix overlapping labels.
- Compilation: fill the result column for all 98 rows, add structured covering-fraction columns for infrared rows, and state that 36 rows were verified from abstracts only and 31 from Technosearch only.
- Novelty statement: remove claim (4); restrict claim (3) to dedicated SETI searches; describe the in-beam counting as a re-derivation of Mason et al. 2025.
- Add a numerical comparison with Grimaldi & Marcy 2018 and Grimaldi 2023, or state that none was made.